Development of automated methods using syringe based flow analysis techniques and capillary electrophoresis for biotechnological process monitoring and environmental analysis
308
0
0
Texto completo
(2)
(3) UNI VERSI DAD DE LAS I SLAS BALEARES DEPARTAMENTO DE QUÍMI CA. Development of automated methods using syringe based flow analysis techniques and capillary electrophoresis for biotechnological process monitoring and environmental analysis. Memoria presentada para optar al grado de Doctor en Ciencias Experimentales y Tecnología (Química) con mención europea. Burkhard Horstkotte. Palma de Mallorca, Septiembre, 2008.
(4)
(5) UNIVERSIDAD DE LAS ISLAS BALEARES Departamento de Química. El Dr. Víctor Cerdà Martín, Catedrático de Química Analítica del Departamento de Química de la Universidad de las Islas Baleares, España y el Dr. Olaf Elsholz, Profesor de Química de la Facultad de Ciencias Naturales de la Universidad de Ciencias Aplicadas de Hamburgo, Alemania, en carácter de director y codirector de esta Tesis Doctoral,. CERTIFICAN:. Que el presente trabajo titulado: "Development of automated methods using syringe based flow analysis techniques and capillary electrophoresis for biotechnological process monitoring and environmental análisis" ha sido realizado por Burkhard Horstkotte en el Área de Química Analítica del Departamento de Química de la Universidad de las Islas Baleares con una estancia en la mencionada Universidad de Ciencias Aplicadas Hamburgo. Constituye la memoria para optar al título de Doctor en Ciencias Experimentales y Tecnología, mención Química y con mención europea, cuya presentación autorizan.. Y para que así conste a los efectos oportunos, firman la presente en Palma de Mallorca, 04 de Septiembre de 2008.. Dr. Víctor Cerdà Martín. Dr. Olaf Elsholz. (Director). (Co-director).
(6)
(7) Acknowledgements I wish to express my gratitude to all people who have contributed or were involved in the development of this work by some means or other.. Especially I would like to thank my supervisors Víctor Cerdà Martín and Olaf Elsholz for their assumption of responsibility to supervise this work, their continuous support, material provision, advices, discussion-time, and possibility to learn.. All my actual and former colleagues who have accompanied my studies at the University of Applied Sciences Hamburg and at the University of the Balearic Islands cheering me up, helping, and finally for a really good time together: Alexander Rohde, Antonia Frias, Eduardo Becerra, Enrique Gómez, Francesca Mas, Hilda María González, Inga Rosenberg, Jesus Alpízar, José Manuel Estela, Luz Leal, Mailen Fernández, Maria Rosende, Markus Walter, Matias Manera, Miquel Coll, Nancy Ornelas Soto, and Rafel Forteza. Special thanks to Antonio Serra, Carmen Pons, Fernando Maya, Laura Ferrer, and Yamila Fajardo for all their patience, affection and help in solving problems attributed to difficulties of software, language, translation, proof-reading, or to fulfill the never-ending administration requests or applications.. Reiner Luttmann and the members from the Research Center of Bioprocess Engineering and Analytical Techniques at the Hamburg University of Applied Sciences, Elisabeth Werner, Ali Kazemi Seresht, Gesine Cornelissen, Hans-Peter Bertelsen, Sandra Landwehr, Stefan Wiedemeier, Thorsten Peuker, Torsten Bartsch, and Ulrich Scheffler.. As well as Francisco Valero, Carol Arnau, and the members of the group of Bioprocess Engineering and Applied Biocatalysis from the Autonomous University of Barcelona for the possibility to test analytical systems developed in this work on yeast cultivation processes and their help during the bioprocess monitoring, material and information provision and the friendly collaboration.. Manuel Miró, who helped me to obtain a financial grant and Fernando Albertús, who was my first instructor in multisyringe flow injection analysis.. Jörg Henningsen and co-workers from the Zentralwerkstatt at the Hamburg University of Applied Sciences as well as Víctor Cerdà Martín for their excellent work of custommade manifold device used in this work..
(8) Bo Karlberg and Malin Kölhed from the Stockholm University for two weeks of training on capillary electrophoresis, their hospitality, and the gift of a high voltage source used in the fourth experimental work presented in this thesis.. The Conselleria de Economia, Hisenda i Innovació of the government of the Balearic Islands for the financial grant as well as the University of Balearic Islands and the Hamburg University of Applied Sciences for financial supports for the participation on international congresses or distances abroad.. The Spanish Ministry of Sciences and Technology for supporting this work as part of the project CTQ2004-1201, "Desarrollo de métodos automáticos en flujo para la monitorización y control de biorreactores y depuradoras de aguas residuales".. All my friends who helped me to overcome frustrations and anger and who made me to have an unforgettable great time in Mallorca, all my proof-readers and all the people who made me get interested in science and investigation.. Finally, I want to thank my parents for their support, confidence, bolstering, and encouragement and to whom I dedicate this work.. "La verdadera grandeza de la ciencia acaba valorándose por su utilidad." "The true greatness of science ends up valuing itself by its utility" Gregorio Marañon y Posadillo Spanish physician, scientist, historian, writer, and philosopher (1887-1960).
(9) Meinen Eltern (To my parents).
(10)
(11) ABSTRACT Since the appearance of flow analyzer systems, the monitoring of environmental or industrial processes and the automation of sample treatment prior to analysis have become stronghold domains for the application of flow techniques. Thus, they present important analytical tools for environmental and process vigilance enabling system studies, risk control, optimization, and higher process sustainability. They are further characterized by high time resolution, cost and consumable efficiency, and reproducibility. In this work, five automated analytical systems using the syringe pump-based flow techniques – Sequential Injection Analysis (SIA) and Multisyringe Flow Injection Analysis (MSFIA) – have been developed and applied with satisfactory analytical performance. A SI-analyzer for formaldehyde was developed automating the Hantzsch reaction with acetylacetone. Formaldehyde is the first intermediate in the metabolic degradation of the carbon source methanol by the yeast Pichia pastoris, one of the most frequently used microorganism in biotechnological productions. The analyzer was successfully applied to the formaldehyde monitoring in a continuous medium filtrate flow of a semi-industrial cultivation of P. pastoris. By this, an analytical tool for the study of the relation between process conditions and formaldehyde concentration was made available for the first time. A second SI-analyzer was developed for the determination of glycerol and sorbitol, two frequently used carbon sources in yeast cultivations. Periodate was used as an additional reagent to carry out the Malaprade reaction. Formaldehyde, generated by the oxidation of the polyalcohol using periodate was quantified by Hantzsch reaction. The system included automated sample dilution and procedures for two complementing working ranges, which were selected by smart software decision (glycerol) or by software-guided user-input (sorbitol), respectively. By this, analyte quantification within an amplified concentration range was possible. The system was applied to the monitoring of both analytes in P. pastoris cultivation processes. A capillary electrophoresis (CE) system was developed and coupled to a SIA system for fully automated maintenance, sampling, and sample injection. The system was applied to the separation and on-capillary photometric detection of mono-nitrophenols used as model substances of high environmental impact. In a second work, the system was modified and MSFIA and CE were coupled for the first time. The fully automation of analyte, solid phase pre-concentration, eluate injection, separation, and quantification of mono-nitrophenols was achieved. Both systems were applied to leaching, ground, and surface waters showing highly satisfying analyte recoveries. Besides, a review of MSFIA applications was presented. It includes a comprehensive overview of the applications and potentials of the technique and the different possibilities of sample injection, manifold configuration, and use of the control software AutoAnalysis.. −I−.
(12) ZUSAMMENFASSUNG Seit der Einführung von Fließanalyse-Systemen war eine ihrer wichtigsten Anwendungsbereiche das Monitoring von sowohl Umwelt- als auch Industrie-Prozessen sowie die Automatisierung verschiedener Arten der Probenvorbehandlung. Fließtechniken stellen damit wichtige analytische Instrumente für die Umwelt- und Prozessüberwachung dar. Sie erlauben Systemstudien, Risikokontrolle, Optimierung und eine bessere Nachhaltigkeit der überwachten Prozesse, und sind gekennzeichnet durch eine hohe Zeitauflösung, Kosten- und Material-Effizienz sowie durch eine hohe Reproduzierbarkeit. In dieser Arbeit wurden fünf automatische Analysensysteme unter Verwendung der Spritzenpumpen-basierenden Fließtechniken Sequentielle Injektionsanalyse (SIA) und Multisyringe Fließinjektionsanalyse (MSFIA) entwickelt. Ein SI-Analyzer für Formaldehyd wurde durch die Automatisierung der HantzschReaktion mit Acetylaceton entwickelt. Formaldehyd stellt das erste Zwischenprodukt in der Stoffwechselkette der Kohlenstoffquelle Methanol der Hefe Pichia pastoris dar, eines der am meistverwendeten Mikroorganismen in der Biotechnologie. Der Analyzer wurde erfolgreich für das Monitoring von Formaldehyd in einem kontinuierlichen MediumFiltratstrom einer Kultivierung von P. pastoris angewendet. Hiermit wurde erstmalig ein analytisches Instrument für die Untersuchung des Zusammenhangs von der Formaldehydkonzentration und anderer Prozessgrößen verfügbar. Ein zweiter SI-Analyzer wurde entwickelt für die Bestimmung von Glycerin und Sorbitol, zweier häufig verwendeter Kohlenstoffquellen in Hefe-Kultivierungen. Periodate wurde verwendet als zusätzliches Reagenz zur Durchführung der Malaprade Reaktion. Das Formaldehyd, das bei der Periodat-bedingten Oxidation des Polyalkohols entstand, wurde über die Hantzsch-Reaktion quantifiziert. Das System beinhaltete die automatisierte Probenverdünnung und Prozeduren für zwei, sich ergänzender Arbeitsbereiche, die entweder über eine intelligente Softwareentscheidung aktiviert wurden (Glycerin) bzw. entsprechend Software-geführter Anwender-Eingabe (Sorbitol). Hierdurch wurde die Quantifizierung in einem erweiterten Konzentrationsbereich möglich. Das System wurde für das Monitoring beider Analyten in P. pastoris Kultivierungen angewendet. Ein Kapillarelektrophorese (CE) System wurde entwickelt und an ein SIA System angebunden für die voll-automatisierte Wartung, Probenübergabe und Injektion. Das System wurde angewendet zur Trennung und photometrischen on-capillary Detektierung von den als Modellsubstanzen mit hoher Umwelteinwirkung verwendeten monoNitrophenolen. Im zweiten Schritt wurde das System modifiziert durch die erstmalige Kupplung von MSFIA und CE zur vollständig automatisierten FestphasenAufkonzentrierung der Nitrophenole, Injektion des Eluats, sowie die Trennung und Quantifizierung der Analyten. Beide Systeme zeigten gute Wiederfindungen für Bodenlaugen, Grund- und Oberflächenwässer. Desweiteren wurde ein Review über die Anwendungen der MSFIA Technik angefertigt. Es beinhaltet einen umfassenden Überblick der Anwendungen, Beschreibungen der Potentiale der Technik sowie die Möglichkeiten der Probeninjektion, der Manifold Konfiguration und der Verwendung der Kontrollsoftware AutoAnalysis.. − II −.
(13) RESUMEN Desde su comienzo, la aplicación de técnicas en flujo se ha enfocado a la monitorización del medio ambiente o de procesos industriales y a la automatización del tratamiento de muestras previo al análisis. Son herramientas poderosas de análisis para la vigilancia del medioambiente y de procesos, facilitando estudios de sistemas, el control de riesgos y la optimización para obtención de un mayor rendimiento. Se caracterizan por una alta resolución temporal, bajo coste, bajo consumo de reactivos y una alta reproducibilidad de análisis. En este trabajo se han desarrollado cinco sistemas analíticos automatizados utilizando las técnicas en flujo basadas en el uso de jeringas, el análisis por inyección secuencial (SIA) y el análisis por inyección en flujo multijeringa (MSFIA). Se ha desarrollado un analizador SIA para la determinación de formaldehído utilizando la reacción de Hantzsch con acetilacetona. El formaldehído es el primer metabolito en la degradación de la fuente de carbono metanol por la levadura Pichia pastoris, uno de los microorganismos más frecuentemente usados en biotecnología. El analizador fue aplicado con éxito a la monitorización del analito en un flujo de filtrado de un medio de cultivo semi-industrial de P. pastoris. Así, se ha desarrollado por primera vez una herramienta para el estudio de la relación entre las condiciones del proceso y la concentración del formaldehído. Se ha desarrollado un segundo analizador SIA para la determinación de glicerol y sorbitol, dos fuentes de carbono frecuentemente usadas para cultivos de levaduras. Se ha utilizado periodato como reactivo adicional para llevar a cabo la reacción de Malaprade. El formaldehído, generado por la oxidación del polialcohol por el periodato ha sido cuantificado con la reacción de Hantzsch. El sistema incluye la dilución automatizada de la muestra y procedimientos para dos rangos consecutivos de trabajo, seleccionado bien por decisión inteligente del programa (glicerol) o por el control del usuario guiado por el programa (sorbitol). Así es posible la cuantificación en un rango amplio de concentraciones. El sistema se aplicó a la monitorización de ambos analitos en cultivos de P. pastoris. Se ha desarrollado un sistema de electroforesis capilar (CE) acoplado a un sistema SIA para la automatización del mantenimiento, provisión e inyección de la muestra. Se ha aplicado el sistema a la separación y detección fotométrica on-capillary de mononitrofenoles usados como sustancias modelo por su alto impacto ambiental. A continuación se ha modificado el sistema para acoplar por primera vez el MSFIA con la CE para la automatización de la pre-concentración en fase sólida, inyección del eluato, separación y cuantificación de mono-nitrofenoles. Ambos sistemas muestran recuperaciones satisfactorias para aguas subterráneas y superficiales y lixiviados. Además se presenta una revisión de las aplicaciones de la técnica MSFIA. La misma incluye una visión general de las aplicaciones, descripción de las potencialidades de esta técnica y de las diferentes posibilidades de introducir la muestra, configuración del manifold y del uso del programa de control AutoAnalysis.. − III −.
(14) − IV −.
(15) STRUCTURE OF THE THESIS This thesis has been structured in ten chapters: Chapter 1 gives a general introduction to the applied and related analytical techniques, and describes the objectives and difficulties of process analytical chemistry, bioprocess strategies, and the analytes of interest for this work. Chapter 2 overviews the objectives of this work. Chapter 3 describes the general materials applied throughout in this work such as the flow system instrumentation components and sampling equipments, detection devices, and the software used for data acquisition and statistics. Chapters 4 to 8 contain the experimental part of this work including descriptions of the developed automated systems and analytical methodologies, their applications and discussions of the obtained results. Chapter 4 deals with the development of a sequential injection analyzer for formaldehyde monitoring in cultivation medium and its application to a cultivation of the yeast Pichia pastoris. Chapter 5 deals with the development of a sequential injection analyzer for glycerol monitoring in cultivation medium and its application to a cultivation of P. pastoris. Chapter 6 deals with the development of a sequential injection analyzer for sorbitol monitoring in cultivation medium and its application to a cultivation of P. pastoris. Chapter 7 deals with the development of a sequential injection analyzer coupled to capillary electrophoresis for the monitoring of mono-nitrophenols in waters. Chapter 8 deals with the development of a multisyringe flow injection analyzer coupled to capillary electrophoresis for the in-line concentration and monitoring of mono-nitrophenols in waters. Chapter 9 contains the general conclusions of this work. Chapter 10 gives a short outlook for perspectives of this work. Indices of figures, tables, graphical and written symbols, and formula signs can be found prior to the introduction. The references cited in this work are listed in a separate chapter at the end of this work. Journal names are abbreviated as done in the FI Science Citation Index published by the Spanish Ministry of Education and Science [1]. All publications or manuscripts accepted for publication, respectively, accomplished during this work and dealing with the investigation carried out are further included. Finally, the actual curriculum vitae of the author is added after the reference chapter. The appendix contains data tables, spectra, program protocols, instrument serial numbers and characteristics, technical drawings, chemical data of the applied reagents, and a photo documentation of the used commercial and developed devices in this work.. −V−.
(16) − VI −.
(17) TABLE OF CONTENTS 1. General Introduction......................................................................................... 1 1.1. Analytical flow techniques................................................................................... 1 1.1.1. Introduction and principles .......................................................................................... 1 1.1.2. Pump types ................................................................................................................. 3 1.1.3. Segmented flow analysis ............................................................................................ 4 1.1.4. Flow injection analysis ................................................................................................ 5 1.1.5. Sequential injection analysis ....................................................................................... 7 1.1.5.1. Classical sequential injection analysis ............................................................... 7 1.1.5.2. Lab-on-valve and bead injection technique ....................................................... 8 1.1.6. Multicommutated flow techniques ............................................................................... 9 1.1.6.1. Preliminary remarks to multicommutation.......................................................... 9 1.1.6.2. Multicommutated flow injection analysis ............................................................ 9 1.1.6.3. Multisyringe injection analysis ........................................................................... 11 1.1.6.4. Multipump flow systems ..................................................................................... 12 1.1.7. Limitations and future trends of analytical flow techniques......................................... 13 1.1.8. Selection for the proposed applications ...................................................................... 14 1.1.9. Software control for modern flow techniques .............................................................. 15. 1.2. Capillary electrophoresis .................................................................................... 16 1.2.1. History ......................................................................................................................... 16 1.2.2. Theory and operation modes ...................................................................................... 17 1.2.3. Instrumentation and analytical parameters ................................................................. 19 1.2.3.1. Fundamental instrumentation ............................................................................ 19 1.2.3.2. Injection .............................................................................................................. 19 1.2.3.3. Separation .......................................................................................................... 20 1.2.3.4. Detection ............................................................................................................ 21. 1.3. Process analytical chemistry .............................................................................. 22 1.3.1. Introduction to process monitoring .............................................................................. 22 1.3.2. Objectives of process analytical chemistry ................................................................. 22 1.3.3. Modes of process monitoring ...................................................................................... 23 1.3.4. General requirements on process analyzer systems.................................................. 25 1.3.5. Particular aspects of biotechnological process monitoring ......................................... 26 1.3.6. Applications for biotechnological process monitoring ................................................. 27 1.3.7. Sampling and conditioning at bio(techno)logical processes ....................................... 28. 1.4. Biotechnological background .............................................................................. 29 1.4.1. Biotechnological processes ........................................................................................ 29 1.4.2. Process operation modes ........................................................................................... 29 1.4.3. Pichia pastoris and promoter system PAOX1 ................................................................ 30. 1.5. The analytes ....................................................................................................... 31 1.5.1. Formaldehyde ............................................................................................................. 31 1.5.1.1. Properties and use of formaldehyde .................................................................. 31 1.5.1.2. Significance of formaldehyde in yeast cultivation .............................................. 31 1.5.2. Glycerol ....................................................................................................................... 33 1.5.2.1. Properties and use of glycerol ........................................................................... 33 1.5.2.2. Significance of glycerol in yeast cultivation ....................................................... 33 1.5.3. Sorbitol ........................................................................................................................ 34. − VII −.
(18) 1.5.3.1. Properties and use of sorbitol ............................................................................ 34 1.5.3.2. Significance of sorbitol in yeast cultivation ........................................................ 35 1.5.4. Mono-nitrophenols ...................................................................................................... 36. 2. Objectives......................................................................................................... 37 3. Common materials and methods...................................................................... 39 3.1. Flow instrumentation ...........................................................................................39 3.2. Manifold components ..........................................................................................40 3.2.1. Tubing ......................................................................................................................... 40 3.2.2. Heating water bath ...................................................................................................... 40 3.2.3. Debubbler devices ...................................................................................................... 41. 3.3. Detection instrumentation ...................................................................................41 3.4. Instrumental control.............................................................................................43 3.4.1. AutoAnalysis, structure and principles ........................................................................ 43 3.4.2. AutoAnalysis, functions and programming .................................................................. 44. 3.5. Reagents ............................................................................................................48 3.5.1. Standard and reagent preparation .............................................................................. 48 3.5.1.1. Formaldehyde analyzer ..................................................................................... 48 3.5.1.2. Polyalcohol analyzers ........................................................................................ 48 3.5.1.3. Nitrophenol CE analyzers .................................................................................. 49 3.5.2. Other solutions ............................................................................................................ 49 3.5.2.1. Indicators ............................................................................................................ 49 3.5.2.2. Cultivation medium and solutions for interference studies ................................ 49. 3.6. Data evaluation and calculations .........................................................................51 3.6.1. General statistics ......................................................................................................... 51 3.6.2. Analysis specific statistics ........................................................................................... 51 3.6.3. Error discussion........................................................................................................... 54. 4. Experimental Work 1: ....................................................................................... 55 At-line determination of formaldehyde in bioprocesses by sequential injection analysis ............................................................................................. 55 4.1. Task description for experimental work 1 ............................................................55 4.2. Introduction .........................................................................................................55 4.2.1. Spectrophotometric detection of formaldehyde .......................................................... 55 4.2.2. Standard addition in flow systems............................................................................... 57 4.2.3. Interfacing of sample transport line and analyzers ..................................................... 58. 4.3. Materials and methods ........................................................................................60 4.3.1. Cultivation process ...................................................................................................... 60 4.3.1.1. Sampling of cultivation medium ......................................................................... 60 4.3.2. Analyzer instrumentation ............................................................................................. 61 4.3.2.1. SIA apparatus and manifold............................................................................... 61 4.3.2.2. Flow-through adapter ......................................................................................... 62 4.3.3. Reagents ..................................................................................................................... 63 4.3.4. Analytical procedure .................................................................................................... 63 4.3.5. Software and program methods .................................................................................. 64. 4.4. Experiments and results ......................................................................................65. − VIII −.
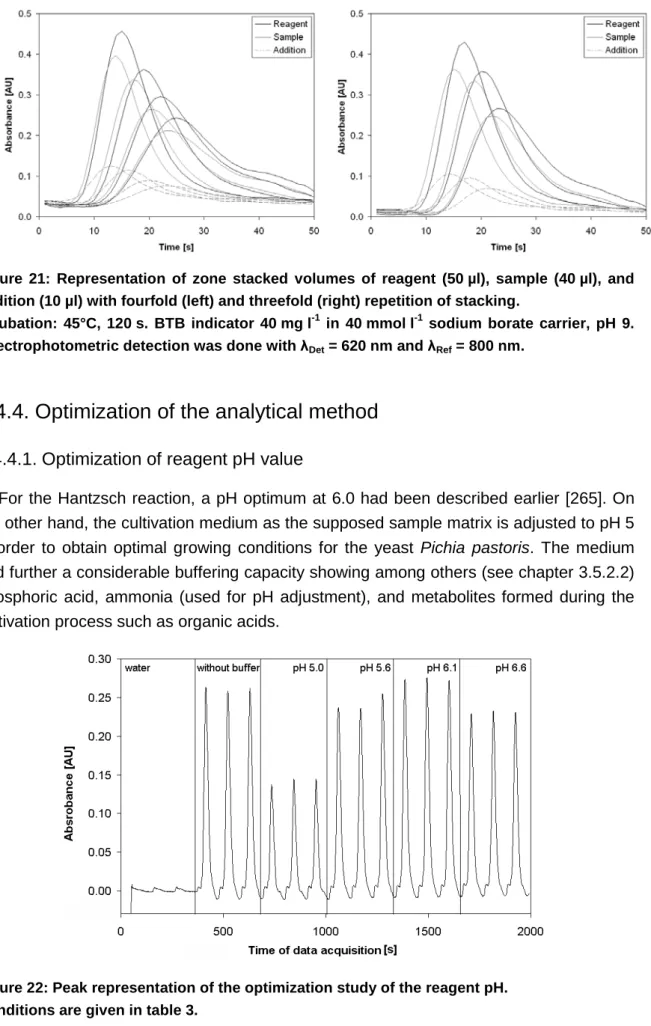
(19) 4.4.1. Optimization detection parameters ............................................................................. 65 4.4.2. Sampling procedure .................................................................................................... 65 4.4.3. Standard addition ........................................................................................................ 66 4.4.4. Optimization of the analytical method ......................................................................... 67 4.4.4.1. Optimization of reagent pH value ...................................................................... 67 4.4.4.2. Optimization of incubation temperature ............................................................. 68 4.4.4.3. Optimization of incubation time.......................................................................... 69 4.4.4.4. Optimization of acetylacetone concentration ..................................................... 70 4.4.4.5. Reagent yellowing.............................................................................................. 71 4.4.5. Method selectivity........................................................................................................ 72 4.4.5.1. Interference studies ........................................................................................... 72 4.4.5.2. Reduction of iron interference ............................................................................ 73 4.4.6. Cultivation process monitoring .................................................................................... 75 4.4.6.1. Preliminary experiments .................................................................................... 75 4.4.6.2. Cultivation process progress ............................................................................. 76. 4.5. Discussion .......................................................................................................... 78 4.5.1. Analytical characterization .......................................................................................... 78 4.5.1.1. Dispersion coefficient ......................................................................................... 78 4.5.1.2. Stability of the method ....................................................................................... 78 4.5.1.3. Linear working range, reproducibility, and detection limit .................................. 79 4.5.1.4. Solution consumption and sampling frequency ................................................. 80 4.5.1.5. Performance of flow-through adapter ................................................................ 81 4.5.1.6. Performance of debubbler devices .................................................................... 81 4.5.1.7. Performance of the method during monitoring .................................................. 81 4.5.2. Possible improvements and outlook ........................................................................... 83. 4.6. Conclusion ......................................................................................................... 83. 5. Experimental work 2 ......................................................................................... 85 Sequential injection analyzer for glycerol monitoring in yeast cultivation medium ........................................................................................................... 85 5.1. Task description for experimental work 2............................................................ 85 5.2. Determination of glycerol .................................................................................... 85 5.3. Dilution in flow systems ...................................................................................... 87 5.4. Materials and methods ....................................................................................... 88 5.4.1. Cultivation process and sampling ............................................................................... 88 5.4.2. Analyzer instrumentation............................................................................................. 88 5.4.3. Reagents ..................................................................................................................... 89 5.4.4. Analytical procedures .................................................................................................. 89 5.4.4.1. Sample splitting .................................................................................................. 89 5.4.4.2. Zone stacking and in-line dilution ...................................................................... 90 5.4.5. Software and program structure ................................................................................. 91 5.4.6. Reference method....................................................................................................... 93. 5.5. Experiments and results ..................................................................................... 93 5.5.1. Optimization detection parameters ............................................................................. 93 5.5.2. Sample splitting ........................................................................................................... 94 5.5.3. Zone stacking and in-line dilution................................................................................ 95 5.5.4. Optimization of the analytical method ......................................................................... 97. − IX −.
(20) 5.5.4.1. Preliminary remarks ........................................................................................... 97 5.5.4.2. Optimization of volumes of Hantzsch reagent (R1) and water .......................... 97 5.5.4.3. Optimization of volume of Malaprade reagent (R2) and incubation time .......... 98 5.5.5. Interference studies ..................................................................................................... 100 5.5.6. Cultivation process monitoring .................................................................................... 101. 5.6. Discussion ..........................................................................................................102 5.6.1. Analytical characterization .......................................................................................... 102 5.6.1.1. Linear working range, reproducibility, and detection limit .................................. 102 5.6.1.2. Stability of the method ....................................................................................... 103 5.6.1.3. Solution consumption and sampling frequency ................................................. 103 5.6.1.4. Influence of ambient temperature ...................................................................... 103 5.6.1.5. Quasi-simultaneous monitoring of formaldehyde and glycerol .......................... 103 5.6.2. Performance of the method during monitoring............................................................ 104 5.6.3. Possible improvements and outlook ........................................................................... 105. 5.7. Conclusion ..........................................................................................................106. 6. Experimental work 3 ......................................................................................... 107 Monitoring of sorbitol in Pichia pastoris cultivation applying sequential injection analysis ............................................................................................. 107 6.1. Task description for experimental work 3 ............................................................107 6.2. Determination of sorbitol .....................................................................................107 6.3. Materials and methods ........................................................................................108 6.3.1. Cultivation process and reference method ................................................................. 108 6.3.2. Analyzer instrumentation ............................................................................................. 109 6.3.3. Reagents ..................................................................................................................... 110 6.3.4. Analytical procedures .................................................................................................. 110 6.3.5. Software and program structure.................................................................................. 110. 6.4. Experiments and results ......................................................................................112 6.4.1. Elimination of stacked air bubbles............................................................................... 112 6.4.2. Bubbler separator ........................................................................................................ 113 6.4.3. Optimization of the analytical method ......................................................................... 113 6.4.3.1. Preliminary remarks ........................................................................................... 113 6.4.3.2. Optimization of volume of Hantzsch reagent (R1) ............................................. 114 6.4.3.3. Optimization of volume of Malaprade reagent (R2) ........................................... 115 6.4.3.4. Optimization of volume of water and incubation time ........................................ 116 6.4.4. Interference studies ..................................................................................................... 118. 6.5. Discussion ..........................................................................................................120 6.5.1. Analytical characterization .......................................................................................... 120 6.5.1.1. Linear working range, reproducibility, and detection limit .................................. 120 6.5.1.2. Conservation of standard solutions and stability of method .............................. 120 6.5.1.3. Stability of the method ....................................................................................... 120 6.5.1.4. Solution consumption and sampling frequency ................................................. 121 6.5.2. Cultivation process monitoring .................................................................................... 121 6.5.3. Possible improvements and outlook ........................................................................... 124. Conclusion .................................................................................................................125. 7. Experimental Work 4 ........................................................................................ 127 −X−.
(21) Development of a capillary electrophoresis system coupled to sequential injection analysis and evaluation by the analysis of nitrophenols .................... 127 7.1. Task description for experimental work 4............................................................ 127 7.2. Introduction......................................................................................................... 127 7.2.1. Determination of mono-nitrophenols ........................................................................... 127 7.2.2. Coupling of flow techniques with capillary electrophoresis ......................................... 128. 7.3. Materials and methods ....................................................................................... 130 7.3.1. SIA apparatus and manifold ........................................................................................ 130 7.3.2. CE apparatus and interfaces ...................................................................................... 132 7.3.2.1. Detector ............................................................................................................. 132 7.3.2.2. Capillary ............................................................................................................. 133 7.3.2.3. Capillary flow system interfaces ........................................................................ 133 7.3.2.4. Pressure reservoir .............................................................................................. 134 7.3.2.5. Protection case .................................................................................................. 135 7.3.2.6. Power source and remote safety control ........................................................... 136 7.3.3. Reagents ..................................................................................................................... 136 7.3.4. Software and analytical procedures ............................................................................ 137. 7.4. Experiments and results ..................................................................................... 139 7.4.1. Optimization of instrumentation .................................................................................. 139 7.4.1.1. Manifold and interfaces ...................................................................................... 139 7.4.1.2. Detection and data evaluation parameters ........................................................ 140 7.4.2. Optimization of physical variables............................................................................... 140 7.4.2.1. Influence of flow parameters .............................................................................. 141 7.4.2.2. Influence of hydrodynamic injection time ........................................................... 143 7.4.2.3. Influence of separation voltage .......................................................................... 144 7.4.3. Optimization of separation buffer composition ............................................................ 145 7.4.3.1. Influence of BGE borate concentration .............................................................. 145 7.4.3.2. Influence of methanol content............................................................................ 146 7.4.3.3. Influence of buffer pH......................................................................................... 147. 7.5. Discussion .......................................................................................................... 149 7.5.1. Analytical characterization .......................................................................................... 149 7.5.1.1. Linear working range and detection limit ........................................................... 149 7.5.1.2. Reproducibility ................................................................................................... 150 7.5.1.3. Recovery and time of analysis ........................................................................... 151 7.5.1.4. Limitations of the proposed system ................................................................... 152 7.5.2. Comparison of versatility ............................................................................................. 153. 7.6. Conclusion ......................................................................................................... 155. 8. Experimental work 5 ......................................................................................... 157 Multisyringe Flow Injection Analysis coupled to Capillary Electrophoresis (MSFIA-CE) as a novel analytical tool applied to the pre-concentration, separation, and determination of nitrophenols ................................................ 157 8.1. Task description for experimental work 5............................................................ 157 8.2. Introduction......................................................................................................... 157 8.2.1. Concentration techniques in capillary electrophoresis................................................ 157 8.2.2. Solid phase concentration of nitrophenols using flow techniques .............................. 158. − XI −.
(22) 8.3. Materials and methods ........................................................................................159 8.3.1. MSFIA apparatus and manifold................................................................................... 159 8.3.2. Solid phase extraction column .................................................................................... 161 8.3.3. CE apparatus and interfaces....................................................................................... 162 8.3.3.1. Capillary ............................................................................................................. 162 8.3.3.2. Power source and remote safety control ........................................................... 162 8.3.4. Reagents ..................................................................................................................... 163 8.3.5. Software and analytical procedures ............................................................................ 163. 8.4. Experiments and results ......................................................................................166 8.4.1. Adaptation of the CE procedure .................................................................................. 166 8.4.2. Optimization of physical variables ............................................................................... 167 8.4.2.1. Water volume for washing of SPE column ........................................................ 167 8.4.2.2. Flow rates for loading and elution ...................................................................... 168 8.4.2.3. Column length .................................................................................................... 169 8.4.3. Optimization of chemical variables.............................................................................. 169 8.4.3.1. Sorbent ............................................................................................................... 169 8.4.3.2. Concentration of hydrochloric acid..................................................................... 169 8.4.3.3. Eluent composition ............................................................................................. 170. 8.5. Discussion ..........................................................................................................173 8.5.1. Analytical characterization .......................................................................................... 173 8.5.1.1. Linear working range and detection limit ........................................................... 173 8.5.1.2. Reproducibility and column capacity ................................................................. 175 8.5.1.3. Recovery and time of analysis ........................................................................... 177. 8.6. Conclusion ..........................................................................................................179. 9. General conclusions ......................................................................................... 181 10.Outlook ............................................................................................................ 183. − XII −.
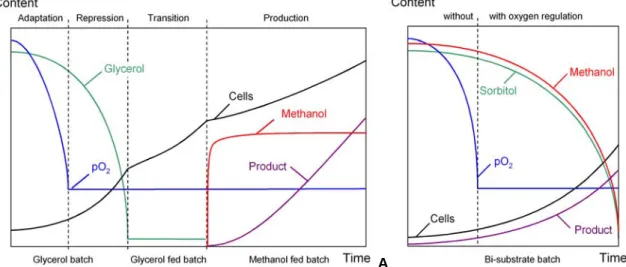
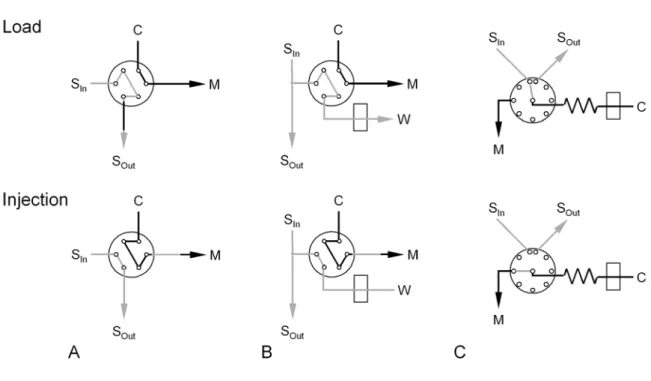
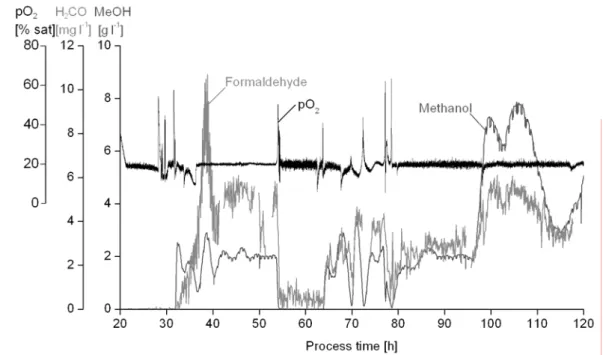
(23) INDEX OF FIGURES Figure 1: Typical structure of a SFA manifold. ................................................................................ 4 Figure 2: Typical structure of a FIA manifold. ................................................................................. 5 Figure 3: Typical structure of a SIA manifold. ................................................................................. 8 Figure 4: Typical structure of a LOV manifold (left) and LOV conduit (right). ................................. 9 Figure 5: Typical structure of a MCFIA manifold. ............................................................................ 10 Figure 6: Typical structure of a MSFIA manifold. ............................................................................ 11 Figure 7: Typical structure of MPFS manifolds. .............................................................................. 13 Figure 8: Capillary with double-layer and EOF plug profile superimposing the differential migration of the analytes (diamonds) and buffer components (bullets). .......................... 18 Figure 9: Basic capillary electrophoresis system. ........................................................................... 19 Figure 10: In-line, on-line, at-line, and off-line monitoring at a biotechnological process with different sampling techniques and interfaces for ex-situ measurements. ....................... 24 Figure 11: Enzymatic decomposition of methanol in methylotrophic yeast P. pastoris. ................. 32 S. Figure 12: Process phases and concentration courses of Mut P. pastoris cultivations. ............... 34 Figure 13: Tube knitting. .................................................................................................................. 40 Figure 14: Hardware configuration window of AutoAnalysis. .......................................................... 44 Figure 15: Editor window of AutoAnalysis. ...................................................................................... 45 Figure 16: Data window of AutoAnalysis with shown smoothed data. ............................................ 46 Figure 17: Hantzsch condensation with AcAc, formaldehyde, and ammonia. ................................ 56 Figure 18: Connection of a continuous process medium flow to an analyzer. ................................ 59 Figure 19: Manifold of the SIA analyzer for formaldehyde. ............................................................. 61 Figure 20: Operation scheme of the flow-through adapter. ............................................................ 63 Figure 21: Representation of zone stacked volumes of reagent (50 µl), sample (40 µl), and addition (10 µl) with fourfold (left) and threefold (right) repetition of stacking.................. 67 Figure 22: Peak representation of the optimization study of the reagent pH. ................................. 67 Figure 23: Influence of the incubation temperature on peak heights. ............................................. 69 Figure 24: Influence of incubation time on Hantzsch reaction. ....................................................... 69 Figure 25: Effect of molarity of acetylacetone in reagent on Hantzsch reaction. ............................ 70 Figure 26: Yellowing of Hantzsch reagent after preparation at room temperature. ........................ 71 Figure 27: Kinetic study with trace element solution components. ................................................. 72 Figure 28: Fluorescence spectra from reagent, DDL, medium, and iron acetylacetonate.............. 74 Figure 29: Spectra for formaldehyde, iron, and mixture after reaction with acetylacetone. ............ 75 Figure 30: Representative peak sequence for the monitored cultivation process. ......................... 76 Figure 31: Concentration courses of formaldehyde, methanol, and oxygen saturation between process time 20 h to 120 h of the observed cultivation process. ...................... 77 Figure 32: Concentration courses of formaldehyde, methanol, and oxygen saturation between process time 140 h to 250 h of the observed cultivation process. .................... 77 Figure 33: Stability of the method tested during 21 h...................................................................... 79 Figure 34: Ten-point calibration performed with automated Hantzsch reaction ............................. 80 Figure 35: Malaprade reaction of periodate with glycerol. .............................................................. 86 Figure 36: Manifold of the SIA analyzer for glycerol. ...................................................................... 88 Figure 37: Scheme of the applied procedure for sample splitting. .................................................. 90 Figure 38: Program scheme of the method used for at-line monitoring of glycerol. ....................... 92. − XIII −.
(24) Figure 39: Study of the splitting procedure...................................................................................... 94 Figure 40: Zone stacked sample, water, R1, and R2 for the LCR (A) and HCR procedure (B). .... 96 Figure 41: Influence of the volumes of reagent 1 and water on the sensitivity and blank value for the LCR procedure (A) and the HCR procedure (B)................................................... 98 Figure 42: Influence of the volume of reagent 2 and incubation time on sensitivity and linearity for the LCR procedure (A) and the HCR procedure (B). .................................... 99 Figure 43: Concentration of glycerol sampled directly or from the filtrate flow and measured off-line with HPLC as well as at-line in the filtrate flow with the SIA analyzer. ................ 102 Figure 44: Manifold of the SIA analyzer for sorbitol. ....................................................................... 109 Figure 45: Program scheme of the method used for at-line monitoring of sorbitol. ........................ 111 Figure 46: Scheme of the applied procedure for gas bubble elimination. ....................................... 112 Figure 47: Optimization results for volume of reagent 1 for both procedures for sorbitol. .............. 114 -1. Figure 49: Parabolic regression of calibration slope given as [AU l g ] versus volume of water and incubation time for the LCR (A) and HCR (B) procedure for sorbitol. ............. 117 -1. Figure 50: Stability test of the HCR procedure of sorbitol using a 10 g l aqueous standard. ....... 121 Figure 51: Discrete concentrations of sorbitol determined by HPLC (black diamonds) and the proposed SIA analyzer (white diamonds). Lipolytic activity, methanol and biomass concentrations are shown as splint charts. ...................................................................... 123 Figure 52: Correlation chart of sorbitol concentration data obtained with the proposed SIA analyzer and HPLC reference method............................................................................. 124 Figure 53: Principles and interface designs for the connection of flow techniques and CE. .......... 129 Figure 54: Manifold of the coupled SIA-CE system. ....................................................................... 131 Figure 55: Scheme of the sampling and injection procedure on the CE-SIA analyzer. .................. 138 Figure 56: Data representation of the optimization of flow rate for the injection procedure. ........... 141 Figure 57: Data representation of the optimization of the volume for sample positioning. ............. 142 Figure 58: Data representation of the optimization of the injection pulse holding time. .................. 143 Figure 59: Data representation of the optimization of the separation voltage................................. 144 Figure 60: Data representation of the optimization of the borate concentration of the separation buffer for buffer without methanol and with 10 v/v% of methanol. ................. 145 Figure 61: Data representation of the optimization of the methanol content of the separation buffer for an apparent pH of 9.4 (A) and of 9.7 (B). ......................................................... 146 Figure 62: Data representation of the optimization of separation buffer apparent pH. ................... 148 Figure 63: Peak height calibration curves for the three NP using the SIA-CE analyzer. ................ 149 Figure 64: Analysis of spiked waste water and standard with the proposed CE method. .............. 152 Figure 65: Manifold of the coupled MSFIA-CE system. .................................................................. 160 Figure 66: Scheme of the sampling, pre-concentration, elution, and injection procedure on the CE-MSFIA analyzer. .................................................................................................. 165 Figure 67: Data representation of optimization the sample positioning volume.............................. 166 Figure 68: Data representation of the water volume for SPE volume washing............................... 167 Figure 69: Data representation of the optimization study on loading and elution flow rates. .......... 168 Figure 70: Data representation of the optimization study of HCl concentration. ............................. 170 Figure 71: Data representation of optimization of eluent composition and volume. ....................... 171 Figure 72: Peak height calibration curves for the three NP using the MSFIA-CE analyzer. ........... 173 Figure 73: Separations in triplicate of aqueous NP standards. ....................................................... 176 Figure 74: Schematic representation of operation order of the different analytical procedures carried out three times on the MSFIA-CE analyzer. ........................................................ 178. − XIV −.
(25) INDEX OF TABLES Table 1: Composition of basal salt batch media used for P. pastoris cultivations. ......................... 50 Table 2: Combinations of variables used to perform different functions with one procedure. ........ 65 Table 3: Influence of reagent pH on peak heights. * ....................................................................... 68 Table 4: Influence of incubation temperature on peak heights. * .................................................... 68 Table 5: Influence of incubation time on peak heights. * ................................................................ 70 Table 6: Influence of acetylacetone concentration on peak heights. * ............................................ 71 Table 7: Parameters of optimized method for formaldehyde determination. .................................. 79 Table 8: Ten-point calibration performed with automated Hantzsch reaction. ................................ 80 Table 9: Distribution of calculated recoveries of monitoring data of the cultivation process. ......... 82 Table 10: Remaining sample volume in the holding coil after sample aspiration and partial discharge in dependency on the applied volumes. .......................................................... 95 Table 11: Determination of dispersion coefficients for the analytical glycerol procedures.* ........... 96 Table 12: Influence of the volume of water and reagent 1 on the slope and intercept values of the linear calibration functions obtained for both procedures. ..................................... 98 Table 13: Influence of the volume of reagent 2 and incubation time on sensitivity and linearity for both procedures. ......................................................................................................... 99 Table 14: Sensitivity values relative to glycerol for both used analytical procedures. .................... 100 Table 15: Optimization results for volume of reagent 1 using the slope, intercept and 2 coefficient of linear regressions (r )* as criteria for both sorbitol procedures. ................. 115 Table 16: Optimization results for volume of reagent 2 using the slope, intercept, and 2 coefficient of linear regressions (r )* as criteria for both procedures for sorbitol. ............ 116 -1. 2. Table 17: Slope [AU l g ], intercept [AU], and coefficient of linear regressions (r ) in dependence of the applied volume of water and incubation time for sorbitol. ................. 117 Table 19: Sensitivity values relative to sorbitol for the applied HCR procedure. ............................ 118 Table 22: Influence of the flow rate applied for sample positioning and interface flushing. * ......... 141 Table 23: Influence of volume for sample positioning of the applied 50 µl sample plug. * ............. 142 Table 24: Influence of the volume applied for interface flushing after injection. * ........................... 142 Table 25: Influence of holding time after injection pulse on peak heights and resolution. * ........... 143 Table 26: Influence of the separation voltage on the migration times and resolution. .................... 144 Table 27: Influence of the borate concentration of the separation buffer. * .................................... 146 Table 28: Influence of separation buffer methanol content on analytes migration times. * ............ 147 Table 29: Influence of the apparent pH value on the migration time of the solutes. * .................... 148 Table 30: Data of calibration performed for the estimation of the linear working range. ................ 149 Table 32: Determination of nitrophenols in spiked wastewater samples by SIA-CE. * ................... 151 Table 33: Instrumental comparison of coupling SIA or FIA via flow interfaces with CE. ................ 154 Table 34: Influence of the volume for sample positioning of the applied 50 µl sample plug. * ....... 166 Table 35: Influence of water volume for SPE column washing. * ................................................... 167 Table 36: Influence of flow rates for SPE column loading and analyte. * ....................................... 168 Table 37: Influence of hydrochloric acid concentration for in-line sample acidification. * ............... 170 Table 38: Influence of volume and composition of EL2 on the NP elution profiles. * ..................... 172 Table 39: Data of calibration performed for the estimation of the linear working range. ................ 174 Table 40: Comparison of LOD values of the actual work with other analytical methods. ............... 175 Table 42: Determination of nitrophenols in spiked wastewater samples by MSFIA-CE. *.............. 177. − XV −.
(26) − XVI −.
(27) INDEX OF ABBREVIATIONS AcAc. acetylacetone (2,4-pentanedione). Add. (standard) addition. AOX. alcohol oxidase. Bl. blank. BTB. bromothymol blue. C18. octadecylsilylated silica. CCD. Coupled Charge Device. CE. capillary electrophoresis. CTFE. chlorotrifluoroethylene. DDL. 2,4-diacetyl-1,4-dihydrolutidine. DLL. dynamic link library. DOC. dissolved organic compounds. EL EOF. eluent electro-osmotic flow. ESIP. eppendorf sterilizable inline probe. ETFE. ethylene tetrafluorethylene. FEP FIA. fluorinated ethylene propylene flow injection analysis. GC. gas chromatography. HC. holding coil. H2CO HPLC. formaldehyde high performance liquid chromatography. HUAS. Hamburg University of Applied Sciences. HV. high voltage. i.d. I-TAC. inner diameter interferon inducible T-cell alpha chemoattractant. IR. infrared. IV. injection valve. LED. light-emitting diode. LLE. liquid-liquid extraction. LOD. limit of detection. LOQ. limit of quantification. LOV MCSV. lab-on-the-valve multicommutation solenoid valve. MCFIA. multicommutation flow injection analysis. MeCN MeOH. acetonitrile methanol. MSFIA. multisyringe flow injection analysis. n.t.. not tested. − XVII −.
(28) NH4Ac NP. ammonium acetate (o- ortho-, m- meta-, p- para-) nitrophenol. o.d.. outer diameter. PEEK. polyetheretherketone. pH pKA. negative decadic logarithm of hydronium ions concentration negative decadic logarithm of the dissociation constant KA of an acid. PMMA. polymethylmethacrylate. PAOX1. promoter of the AOX1 gene. Pos PPS. position (position of valve port) polyphenylensulfide. PTFE. polytetrafluorethylene. PVC. polyvinyl chloride. PVDF. polyvinylidene fluoride. R. reagent. S. sample / syringe. SFA. (air) segmented flow analysis. SIA SPE. sequential injection analysis solid phase extraction. Std. standard. SV. selection valve. UAB. Autonomous University of Barcelona. UIB. University of the Balearic Islands. UNF. unified fine (American thread series). UNS USB. unified special (American thread series) universal serial bus. UV. ultraviolet. V. (solenoid) valve. W. waste. − XVIII −.
(29) INDEX OF FORMULA SIGNS Latin characters Character. Meaning. SI unit *. ai A. polynomial coefficients absorbance / signal. -. c. molar concentration. mol·l-1. D e. dispersion coefficient elementary charge. approx 1.6022·10–19 C. E. (electrical) field strength. V·m-1. F. force. kg·m·s-2. h l. height length. m m. m. mass. kg. M. molar mass. kg·mol-1. n. number of data sets. -. N. plate number. -. oxygen partial pressure. % of saturation. pressure. kg·m-1·s-2. regression coefficient / radius relative standard deviation. -/m %. R. recovery. %. RS. (peak) resolution. -. SD t. standard deviation time. s. tD. delay or dead time. s. tP. process execution time. s. tR. retention time. s. U. voltage. V. V V&. volume. l. flow rate. m3·s-1. w. width. m. wB. base line peak width. s. number of charge mean of values of magnitude x. -. pO2 p r RSD. z x. * Units used in the text can differ from the SI unit, applying mostly magnitude prefixes (…k, m, µ, n,…) and rather minutes (min) and hours (h) than seconds (s) for time scales, bar instead of Pascal (Pa) for pressure specification, and liters (l) instead of cubic meters for volumes, respectively.. − XIX −.
(30) Greece characters Character. Meaning. SI unit *. β. mass concentration. g·l-1. ε. molar absorptivity / relative dielectrical constant zeta potential dynamic viscosity. l·mol-1·m-1 / V kg·m−1·s−1. λDet. detection wavelength. m. λRef. reference wavelength. m. electrophoretic mobility. m2·V-1·s -1. ζ η. μ. * Units used in the text can differ from the SI unit, applying mostly magnitude prefixes (…k, m, µ, n,…) and rather minutes (min) and hours (h) than seconds (s) for time scales and bar instead of Pascal (Pa) for pressure specification, respectively.. − XX −.
(31) 1 General introduction. 1. GENERAL INTRODUCTION 1.1. Analytical flow techniques 1.1.1. Introduction and principles Analytical flow techniques are techniques used for the automation of the analyst work. The common principle is given by the carrying and treating of a sample in flow within a tube assembly, following denoted as "manifold". The basis of automation in flow distinguishes these techniques from batch-wise laboratory automation techniques such as using beakers on a conveyer belt or robots [2,3]. Commonly, peristaltic, syringe, or solenoid membrane pumps are used for liquid driving. Alternative propulsion techniques such as gravimetric flow [4], electro(endo)osmotic flow (EOF) [5] or the use of miniature piston [6] or piezoelectric pumps [7] have been reported further. Though liquid chromatography shows the basic characteristics of flow techniques, it is generally considered as an individual analytical technique. The simplest conceivable system is represented by the sample transport to a detection flow cell. Mostly, in-line addition of an analyte-selective, e.g. chromogenic reagent is carried out in order to obtain a reaction product of enhanced detection sensitivity. More complex systems are used to automate laboratory preparative and analytical procedures in order to eliminate matrix interferences and to improve the method selectivity. Among others, sample filtering, titration, mixing, leaching [8], dilution, microwave- [9], ultrasonic- [10], UV-irradiation-, and agent-assisted digestion or photo-degradation [11,12], analyte pre-concentration, or analyte separation from the matrix by distillation, membrane techniques (gas diffusion [13], pervaporation [14-16, dialysis [17],…), extraction (liquid-liquid [18], solid-phase ,…), or co-precipitation [19] have been performed so far in flow systems. For these tasks, a multitude of devices have been used in flow manifolds such as phase separators, leaching cells, columns for resins or solid samples [8], membrane cells, dilution chambers, ultrasonic reactors, gas-sampling units, optical and electrochemical detection flow cells of ingenious designs, or serpentine, knotted or coiled tubes [20]. The analytical information is obtained by the continuous registration of the physical or chemical property of interest in the liquid flow. The signals are either rectangular or peakshaped, whose characteristics area, height, or width are correlated with the analyte concentration. Apart from most frequently used detection techniques i.e. potentiometry, amperometry, spectrophotometry, and fluorescence spectrometry, also applications of conductimetry [21], reflectometry [22], infrared (IR) spectroscopy [23], turbidimetry [24], chemiluminescence detection [25], flame (FAAS) and electrothermal atomic absorption spectrometry (ETAAS) [8,26-28], atomic fluorescence spectrometry [29,30], inductivecoupled-plasma atomic-emission-spectrometry (ICP-AES), and mass spectrometry (ICPMS) [31,32] can been found.. −1−.
(32) 1 General introduction Among the benefits of automation of analytical procedures, the increase of sample frequency, miniaturization of the analytical system, and lower reagent and sample consumption, implying lower personal and consumable costs need to be highlighted. In consequence, the analysis can be carried out faster, more economically, and in absence of trained personal e.g. overnight and with a reduced environmental impact. As a further advantage, all procedures are carried out in a closed manifold made of resistant polymer or glass tubes. This prevents sample contamination or alteration by oxidation, evaporation, or radiation and decreases further the risk for laboratory personal and working area of contamination with applied hazardous substances. Generally, automation using analytical flow techniques involves a considerable gain of the overall repeatability of the analytical procedure due to the control of the volumes, volume ratios, and flow rates whereas the much vaunted robustness and flexibility of analytical flow techniques depend highly on the individually assembled instrumentation and the user's skills. Due to all former described characteristics, analytical flow technique are widespread used where fast, economic, reliable, and automated analysis of a large number of similar samples is demanded such as in routine clinical analysis, industrial or biotechnological process control, and environmental vigilance as discussed in detail in chapter 1.3.6. The different modes of propulsion and sample introduction, operation schemes and flow characteristics have led to the proposal of various distinct analytical flow techniques. In the following sections, the most frequently used analytical flow techniques and their characteristics are described. Extensive comparisons and introductions into the different techniques can be found in specialist books [2,33-38] and in numerous reviews and treatises about the different flow techniques and their fundamental aspects [3,20,39-50]. It should be highlighted, that some of the analytical characteristics of the automated method such as the sample frequency depend more on e.g. the used detector than on the applied flow technique and a comparison between these is only feasible for similar applications. Finally, the IUPAC technical report prepared by ZAGATTO ET AL. (2002) [51] stated the existence of only four basic flow-based analytical techniques with various distinct modes, likewise to be characterized by applied flow pattern, stream parameters, sample introduction, manifold configurations, sample processing, detection and its performance parameters. In contrast, the number of proposed flow techniques is much higher. However, to the author's opinion, novel benefits of a technique variant are much more relevant than claiming the novelty of a technique with variant benefits. It is even more the inventive utilization of ideas from distinct techniques and their intelligent combination for the fulfilling of the analytical task.. −2−.
(33) 1 General introduction. 1.1.2. Pump types The used liquid driving devices, either peristaltic, syringe, or solenoid membrane pumps, have a considerable influence on the robustness, precision, flow characteristics, and chemical resistance of the analytical system and applied technique. It is noteworthy, that one pump type is characteristically assigned to each flow technique. Peristaltic pumping is carried out by the positive displacement of the liquid contained within elastic pumping tubes fitted inside the circular pump casing. The tube is closed on various points under the compression exerted by cylinders mounted onto the pump rotor. By rotor turning, the fluid is forced to move through the tube as the points of compression move. The flow rates are modified by using pumping tubes with different inner diameters and by the rotation speed. The tube interior walls are the only part in liquid contact, which allows sterilization. The pumps are relatively inexpensive in maintenance since no moving parts are in contact with the liquid and neither valves nor seals are required. Most models can be equipped with several parallel channels. Computer interfacing enables the control of flow rate and direction but is not required for operation. The main disadvantages are the peristalsis-caused flow pulsation, flow rate drift, and progressive material abrasion caused by the mechanical stress and flattening of the pumping tubes, thus required re-calibration, and the moderate volumetric precision in sequential operation or under pressure. Finally, the typical tube materials PVC (Tygon®) is not resistant to common chemical agents in even moderate concentration such as various acids, bases, and organic solvents. Here, water-immiscible solvents can to be propelled using displacement bottles [36,52]. In syringe pumps, the liquid is dispensed or aspirated into a syringe by the movement of a piston, mostly driven by a step-motor-turned screw shaft. Important advantages are high-pressure stability, high volumetric precision, hardly pulsation, adaptable flow rate by computer control over a wide range, and suitability for solvents and acids due to the use of normally glass and highly resistant polymers. On the other side, syringe pumps require necessarily computer control. Most devices are equipped with only one syringe, which complicates the construction and increases the price of multichannel manifolds. Besides, the maximal volume is limited by syringe size and the time of analysis is prolonged by the required syringe refilling. Finally, gas bubbles can arise due to the negative pressure applied on the liquid during rapid refilling and affect the operational precision. Solenoid diaphragm micropumps operate by means of strokes generated by an electromechanical solenoid, which actuates over a liquid contacting diaphragm. Due to the incorporation of a dual check valve, a unidirectional, intermittently turbulent flow results from the line-up of several flow pulses. The high advantage of these devices are the small dimensions and low power consumption allowing the construction of miniature systems, the low purchase costs and simplicity of the required control, and the advantageous arising from the turbulent flow conditions. On the other hand, the reliability of the pumps is highly affected by the presence of gas bubbles, the practicable flow pressure is low, and bi-directional flow is not possible using only one pumping device.. −3−.
Figure

+7


Documento similar
Cells that were grown in 5% and 10% PRP containing media were comparable to those that were grown in MesenCult®, and could be regarded as adipose
Using ground-based data, meteorological observations, and atmospheric environmental monitoring data, a comparative analysis of the microphysical and optical properties, and
Different methods for removing interference by humic substances in the analysis of polar pollutants have been compared in the analysis of environmental water by solid-phase
All four plots have a similar overall shape with (i) an initial steep fall from approximately 35% EER to 15-20% EER when using 1 to 10 footsteps for train- ing, (ii) a smooth knee
The draft amendments do not operate any more a distinction between different states of emergency; they repeal articles 120, 121and 122 and make it possible for the President to
H I is the incident wave height, T z is the mean wave period, Ir is the Iribarren number or surf similarity parameter, h is the water depth at the toe of the structure, Ru is the
The study is based on the content analysis of media framing by text mining techniques of a sample of news pieces related to the work accidents and their prevention, published over
Electronic waste (e-waste), have a high potential as a source of precious metals, since they can contain metals like silver, gold, platinum, copper, zinc, nickel, tin and
