Dynamics and Synchronization of Motifs of Neuronal Populations in the Presence of Delayed Interactions
224
0
0
Texto completo
(2) Dynamics and Synchronization of Motifs of Neuronal Populations in the Presence of Delayed Interactions Leonardo Lyra Gollo Tesi presentada al Departament de Física de la Universitat de les Illes Balears. PhD Thesis Director: Prof. Claudio Mirasso. Copyleft 2012, Leonardo Lyra Gollo Univertsitat de les Illes Balears Palma de Mallorca This document was typeset with LATEX 2ε. ii.
(3) que aquesta tesi doctoral ha estat realitzada pel Sr. Leonardo Lyra Gollo sota la seva direcciò a l’Institut de Física Interdisciplinaria i Sistemas Complexos i, per a què consti, firma la present Tesi doctoral presentada per Leonardo Lyra Gollo per optar al títol de Doctor, en el Programa de Física del Departament de Física de la Universitat de les Illes Balears, realitzada a l’IFISC sota la direcció de Claudio Mirasso, Catedràtic d’Universitat.. Vist i plau, Director de la tesi. Doctorant. Prof. Claudio Mirasso. Leonardo Lyra Gollo. Palma, 02 de juny de 2012. iii.
(4) A Natália. iv.
(5) v.
(6)
(7) Contents Titlepage. i. Contents. vii. I. Introduction. 1. 1. Biological Overview 1.1 Segregation and integration: Two organizational principles of the brain . . . . . . . . . . . . . . . . . . . . . . . . . . . . . 1.1.1 Sensory input enters from specialized pathways . . . 1.1.2 Examples of receptive fields . . . . . . . . . . . . . . . 1.1.3 Intra- and cross-modal convergence: Picking up from fragments . . . . . . . . . . . . . . . . . . . . . . . . . 1.1.4 The binding problem . . . . . . . . . . . . . . . . . . . 1.2 An overview of the functional anatomy of the central nervous system . . . . . . . . . . . . . . . . . . . . . . . . . . . . . . . 1.2.1 C. elegans: An especial example . . . . . . . . . . . . . 1.2.2 Evolutionary perspective . . . . . . . . . . . . . . . . 1.2.3 Developmental perspective . . . . . . . . . . . . . . . 1.2.4 Principles of functional anatomy of the central nervous system . . . . . . . . . . . . . . . . . . . . . . . . 1.3 A brief comparative overview on the experimental measurements of brain activity . . . . . . . . . . . . . . . . . . . . . .. 3 . . .. 4 5 6. . .. 8 8. . 9 . 10 . 10 . 12 . 14 . 24 vii.
(8) viii. CONTENTS 1.4. 2. 3. Biophysical overview of the neurons and neuronal interactions 1.4.1 Neurons . . . . . . . . . . . . . . . . . . . . . . . . . . . 1.4.2 Neuronal morphology . . . . . . . . . . . . . . . . . . . 1.4.3 Nerst potential . . . . . . . . . . . . . . . . . . . . . . . 1.4.4 Neuronal activity . . . . . . . . . . . . . . . . . . . . . . 1.4.5 Neuronal communication . . . . . . . . . . . . . . . . .. On the Different Modeling Levels 2.1 Detailed neuron models . . . . . . . . . . . . . . . . . . . . . 2.2 Spiking neurons . . . . . . . . . . . . . . . . . . . . . . . . . . 2.2.1 Biophysical models . . . . . . . . . . . . . . . . . . . . 2.2.2 Reduced models . . . . . . . . . . . . . . . . . . . . . 2.2.3 A comparative view of the most influential models of spiking neuron. . . . . . . . . . . . . . . . . . . . . . . 2.3 Neuronal populations of spiking neurons . . . . . . . . . . . 2.3.1 Building a network of excitatory and inhibitory spiking neurons . . . . . . . . . . . . . . . . . . . . . . . . 2.3.2 Building modular structures . . . . . . . . . . . . . . 2.3.3 Modeling meso- and large-scale brain dynamics with populations of spiking neurons . . . . . . . . . . . . . 2.4 Reduced meso- and large-scale models . . . . . . . . . . . . .. . . . .. 26 26 27 30 30 32 37 39 41 42 44. . 48 . 48 . 50 . 51 . 52 . 53. Spatio-Temporal Neurodynamics: Rhythms, Synchronization and Coding 3.1 Single neuron activity: Excitability and oscillations . . . . . . . 3.1.1 Neuronal classification depending on the response to a driving current . . . . . . . . . . . . . . . . . . . . . . 3.2 Rhythmogenesis, neural synchrony and complexity . . . . . . 3.2.1 Oscillatory brain activity associated with cognitive behaviors . . . . . . . . . . . . . . . . . . . . . . . . . . . . 3.2.2 Oscillations as an emergent property of the network . . 3.2.3 Synchronization . . . . . . . . . . . . . . . . . . . . . . . 3.2.4 Complexity and frustration . . . . . . . . . . . . . . . . 3.3 Dynamical relaying . . . . . . . . . . . . . . . . . . . . . . . . . 3.3.1 Appraising the results in the dynamical-relaying framework. . . . . . . . . . . . . . . . . . . . . . . . . . . . . . 3.4 Binding by synchrony . . . . . . . . . . . . . . . . . . . . . . .. 55 56 56 58 59 60 60 62 64 68 69.
(9) CONTENTS. II. Results. ix. 71. 4. Dynamical Relaying: A Robust Mechanism to Promote Zero-Lag Long-Range Cortical Synchronization 73 4.1 How can zero-lag long-range synchrony emerge despite of conduction delays? . . . . . . . . . . . . . . . . . . . . . . . . . 76 4.2 Zero-lag long-range neuronal synchrony via dynamical relaying 79 4.2.1 Illustration of dynamical relaying in a module of three Hodgkin and Huxley cells . . . . . . . . . . . . . . . . . 80 4.2.2 Effect of a broad distribution of conduction delays . . . 84 4.2.3 Dynamical relaying in large-scale neuronal populations 87 4.3 General discussion, conclusions and perspectives . . . . . . . 95 4.4 Methods . . . . . . . . . . . . . . . . . . . . . . . . . . . . . . . 98 4.4.1 Models . . . . . . . . . . . . . . . . . . . . . . . . . . . . 98 4.4.2 Simulations . . . . . . . . . . . . . . . . . . . . . . . . . 102 4.4.3 Data analysis . . . . . . . . . . . . . . . . . . . . . . . . 102. 5. Controlling Cortical Synchronization via Thalamic Dynamical Relaying 105 5.1 Methods . . . . . . . . . . . . . . . . . . . . . . . . . . . . . . . 107 5.1.1 Neuronal model . . . . . . . . . . . . . . . . . . . . . . 109 5.1.2 Thalamocortical model . . . . . . . . . . . . . . . . . . . 109 5.1.3 Background activity and external input . . . . . . . . . 113 5.1.4 Cross-correlation analysis . . . . . . . . . . . . . . . . . 114 5.2 Results . . . . . . . . . . . . . . . . . . . . . . . . . . . . . . . . 114 5.2.1 Thalamocortical circuit dynamics . . . . . . . . . . . . . 115 5.2.2 Effect of the cortico-cortical connection . . . . . . . . . 120 5.3 Discussion . . . . . . . . . . . . . . . . . . . . . . . . . . . . . . 122. 6. Hippocampal Dynamical Relaying: Simulations and Experiment 127 6.1 Results . . . . . . . . . . . . . . . . . . . . . . . . . . . . . . . . 129 6.1.1 Modeling theta oscillations generated in the hippocampus . . . . . . . . . . . . . . . . . . . . . . . . . . . . . . 129 6.1.2 Dynamical relaying in the theta range . . . . . . . . . . 130 6.1.3 Large-scale motifs . . . . . . . . . . . . . . . . . . . . . 132 6.1.4 Zero-lag synchrony is enhanced during motor exploratory behavior . . . . . . . . . . . . . . . . . . . . . . . . . . . 135 6.2 Discussion . . . . . . . . . . . . . . . . . . . . . . . . . . . . . . 136.
(10) x. CONTENTS 6.2.1. 6.3. 7. 8. The role of hippocampal theta oscillations in longrange synchronization . . . . . . . . . . . . . . . . . . . 6.2.2 Dynamical relaying and phase relation . . . . . . . . . 6.2.3 Local field potentials recorded from hippocampus and neocortex: the role of volume conduction . . . . . . . . 6.2.4 Final remarks . . . . . . . . . . . . . . . . . . . . . . . . Materials and Methods . . . . . . . . . . . . . . . . . . . . . . . 6.3.1 Modeling theta synchronization in large-scale systems 6.3.2 Modeling theta synchronization in different behavioral states . . . . . . . . . . . . . . . . . . . . . . . . . . 6.3.3 Synchronization measurements from correlation function . . . . . . . . . . . . . . . . . . . . . . . . . . . . . . 6.3.4 Experimental protocol . . . . . . . . . . . . . . . . . . .. Resonance-Induced Synchronization 7.1 Common driving versus other motifs . . . . . . . . . . . . . 7.2 Pair of anti-phase synchronized nodes . . . . . . . . . . . . . 7.3 Common-driving motif versus different common-driving motifs enhanced with resonance-induce sources . . . . . . . . . 7.3.1 Hodgkin-Huxley neurons . . . . . . . . . . . . . . . . 7.3.2 Populations of Izhikevich neurons . . . . . . . . . . . 7.3.3 Neural mass models . . . . . . . . . . . . . . . . . . . 7.4 Characterizing the dynamics of the motifs . . . . . . . . . . . 7.5 Propagation of the resonant effect . . . . . . . . . . . . . . . . 7.5.1 Effects of common driving at higher orders . . . . . . 7.6 Discussion . . . . . . . . . . . . . . . . . . . . . . . . . . . . . 7.7 Methods . . . . . . . . . . . . . . . . . . . . . . . . . . . . . . 7.7.1 Motifs of Hodgkin Huxley neuronal model . . . . . . 7.7.2 Motifs of populations of Izhikevich neurons . . . . . 7.7.3 Motifs of neural mass models . . . . . . . . . . . . . . Concluding Remarks and Further Perspectives. 136 139 140 140 141 141 144 144 145. 147 . 149 . 151 . . . . . . . . . . . .. 152 153 155 155 158 159 161 162 165 165 167 168 171.
(11) Part I. Introduction. 1.
(12)
(13) Chapter 1. Biological Overview The purpose of this introductory chapter is twofold: to motivate, and to contextualize. The motivation aims at evidencing the importance of synchronization to brain functioning. Consciousness, cognition, behavior and perception require the interaction of multiple large groups of interconnected neurons, which are often segregated and distant. Fundamentally, the synchronous and precisely coordinated spiking activity is considered a middle-ground link between single-neuron activity to large-scale brain activity (Buzsáki and Draguhn, 2004). Afterwards, the contextualization is provided by the description of elementary characteristics, and relationships of the brain substrate, particularly emphasizing the structures involved in our results. Section (1.1) is devoted to the identification of two essential principles of structural and functional organization of the neuronal dynamics: segregation and integration. We signalize that the former principle is a recognized aspect that is observed in the brain. The latter principle is presumably a prerequisite for the cognitive functions to emerge from the activity of segregated and specialized areas. To understand how the brain integrates neuronal activity of segregated and frequently distant areas constitutes a long-standing theoretical inquiry of neuroscience. The cornerstone of most models tackling this issue relies on the synchronization of neuronal activity. Before we address the problem of synchronization between distant neuronal populations, this chapter contextualizes the field with respect to the established knowledge in biology. We provide a rather peripheral overview 3.
(14) CHAPTER 1. BIOLOGICAL OVERVIEW that highlights only the most relevant components invoked in the following chapters. As our prime efforts, we attempt to offer: • an intuitive view of the architectural structure of the nervous system (section 1.2); • a comparative assessment of the existing experimental techniques to capture the brain dynamics (section 1.3); • and a guide to understand the genesis of the neuronal dynamics (section 1.4).. 1.1. Segregation and integration: Two organizational principles of the brain The structure of the central nervous system is thought to be hierarchical (Maunsell and Van Essen, 1983; Zeki and Shipp, 1988; Felleman and Van Essen, 1991; Mesulam, 1998). According to this conceptualization, the sensory neurons and the periphery of the sensory systems comprise the bottom level of such hierarchy. On the other extreme, the deep cortical regions comprise the top level of the hierarchy. Under scrutiny, pervading all levels, cyto- and myeloarchitectural studies of the brain tissue indicate a segregated arrangement. Different aspects of the brain organization reflect the segregation principle. The following sections (1.1.1, and 1.1.2) shall discuss some striking examples of segregation at the peripheral level, where a plethora of studies have acquired abundant knowledge. The cortical level also presents a categorical segregation. However, at fine scale the cortical segregation gets lopsidedly fuzzier. Over a century ago, Campbell and Brodmann, the two contemporaries, mapped the human cerebral cortex with distinct segregation borders because they had used distinct criteria in their citoarchitectonic approach (Campbell, 1905; Brodmann, 1909). Currently, utilizing more sophisticated methods, several groups follow the same goal to characterize the human cortex (ffytche and Catani, 2005; Sporns, 2010). 4.
(15) 1.1. SEGREGATION AND INTEGRATION: TWO ORGANIZATIONAL PRINCIPLES OF THE BRAIN Along the history, a multitude of clinical studies involving brain damage show that some brain functions depend on the integrity of specific brain areas (Kolb and Whishaw, 1990; Sporns, 2010). This represents another rich field supporting the principle of segregation in the brain. Altogether, these approaches demonstrate the tendency of segregation of brain activity. The recognition of this fact leads straightforwardly to the necessity of an integration principle. Cognitive functions, like perception, attention, and memory, demand to assemble pieces of information that are coded at distant regions. Such integration is another organizational principle of the brain. Owing to their fundamental importance, most brain functions are thought to rely on the interrelationship of segregation and integration. The coexistence of these two principles has been proposed to be the origin of neural complexity (Sporns, 2010). A remarkable attempt to quantitatively measure the complexity of a system also depends on the expression of both segregation and integration (Sporns, 2010). In a completely segregated system, the units are independent and there is only randomness. In a completely integrated system, all units behave identically and there is only regularity. Both extreme cases have no complexity. Therefore, complexity depends on the coexistence of order/disorder, random/regularity, and segregation/integration. This mixture distinctly prevails in the brain structure and its function.. 1.1.1 Sensory input enters from specialized pathways As the animals grew in size and complexity, certain cell types, the sensory neurons, adapted to extract the maximum information of the environment with respect to different aspects of the sensory stimulus. This specificity is a consequence of differences in physical and chemical structures of the neurons. There are great differences among the receptor neurons of the sensory systems. Even within a given sensory modality, there are different specializations of the receptor neurons. For example, the olfactory system has hundreds of different chemoreceptor neurons that respond optimally to different chemical compounds; the somatosensory system possesses several types of receptors (thermoreceptors, mechanoreceptors); etc. 5.
(16) CHAPTER 1. BIOLOGICAL OVERVIEW 1.1.2 Examples of receptive fields From the periphery of the central nervous system to the higher levels, the sensory systems receive, process and transmit information. Irrespective of the sensory modalities, the pathway of the information flow is typically restricted by the receptive fields. The receptive field of a neuron is the region of sensory space that elicit neuronal responses in the presence of a stimulus (Alonso and Chen, 2009). The receptive field is a neural mechanism utilized to decompose complex stimuli. This procedure of decomposing is undertaken early in the periphery, and it is typically maintained along several hierarchical levels. This strategy to process complex information is thought to provide a reliable way for the information to reach the intended sensory cortical area. A considerable amount of the established knowledge about the receptive fields has been gathered in the peripheral areas. Independently of the sensory mode, the peripheral zones typically offer less challenging experimental barriers. To illustrate a little of the generality of the segregation principle, next we discuss some classical examples of receptive field in the peripheral areas of different sensory modalities.. Somatosensorial system. The somatosensory system responds to different sorts of stimulus: touch, vibration, body position, temperature or pain. The receptive fields in such system comprise a limited region of the skin or the internal organs where a stimulus can elicit a neuronal response. The size of the receptive fields vary both as a function of the stimulus, and the part of the body. The precision to detect changes of a somatosensorial stimulus decreases with the size of the receptive field. In humans, some areas have a very detailed somatosensorial resolution like the fingers, the lips, and the tongue; whereas other areas have poor resolution like the back, and the back of the legs. This resolution can be assessed by the two-point limen detection (Squire et al., 2003), a typical test to find the minimum detectable distance between two blunt probes. The areas with the smallest (largest) two-point limen represent the highest (lowest) resolution. Moreover, in addition to plentiful innervations of sensory neurons, superior resolution also demands a sufficient amount of cortical tissue to process the information. As reflected by the sensibility, both the distribution of innervations and the amount of cortical tissue are highly non-uniform. As the cortical homuncu6.
(17) 1.1. SEGREGATION AND INTEGRATION: TWO ORGANIZATIONAL PRINCIPLES OF THE BRAIN lus have popularized (Kandel et al., 2000), large proportions of cortical tissue correspond to the processing of especial regions of the body.. Visual system. From the peripheral level to the deep cortical level, the concept of receptive field pervades our knowledge about the visual system. Following the flow direction of the neuronal activity elicited by the visual stimulus, neurons from any level show traces of the receptive fields: photoreceptors, retinal ganglion, lateral geniculate nucleus, primary visual cortex (striate), up to extrastriate cortical cells. In the first layer, the receptive field of a photoreceptor neuron corresponds to the region in which light alters the firing response of that cell. For the ganglion cells in the retina, the receptive field encompasses the sensitive areas of their afferent photoreceptors. Among these neurons, the ganglion cells at the fovea (center of the retina) have the smallest receptive field, providing the finest resolution. Rising the level along this flow direction, the receptive fields increase in size and specificity of the stimulus. Neurons may respond to objects and faces (Bruce et al., 1981; Desimone et al., 1984; Tsao and Livingstone, 2008), or even to a single person (Quiroga et al., 2005). In the vision, the concept of receptive field has also been extended to capture a spatiotemporal feature of the stimulus. This generalization allows the characterization of direction selective responses from neurons in primary visual cortex (Alonso and Chen, 2009).. Auditory system. The neuronal receptive fields in the auditory system code at least two features of the stimuli: spatial and spectro-temporal information (Alonso and Chen, 2009). The response of neurons with the spatial receptive field depends on the position of the sound source (Knudsen and Konishi, 1978; Knudsen, 1982; Ashida and Carr, 2011). Such location can be precisely estimated by coincidence detection using the minute temporal disparity of arriving spikes from the sensory neurons of the two ears (Jeffress, 1948; Joris et al., 1998; Agmon-Snir et al., 1998), or by the recently proposed code by population spike rate (Vasilkov and Tikidji-Hamburyan, 2012). Neurons with the spectro-temporal receptive field respond preferentially to sound of a given frequency (Robles and Ruggero, 2001). The frequency decomposition of complex sounds takes place at the cochlea. The cochlea is a sensory organ in the auditory system that has a precise repre7.
(18) CHAPTER 1. BIOLOGICAL OVERVIEW sentation of sound frequency: the base detects higher tones and the apex detects lower tones. Olfactory system. The olfactory system depends on a chemical signaling that is rather complex and poorly understood. There are a multitude of families of olfactory receptor neurons, each type of neuron responding optimally to a certain odorant. Recently, an olfactory receptive field has been proposed to be mapped as a function of the molecular carbon chain length of the odorant (Mori et al., 1999; Wilson, 2001; Wilson and Stevenson, 2003; Alonso and Chen, 2009). 1.1.3 Intra- and cross-modal convergence: Picking up from. fragments The stimulus enters the brain through a myriad of relatively independent channels at the sensory systems. Each channel receives rather small data sets. Practically, the information of several of those small data sets must be collected to achieve any percept. This convergence is fundamental and ubiquitous within and among different sensory modalities. Convergence occurs at many levels. It is, however, more prominent at higher levels, where the activity is most raveled and cannot be decomposed into distinct contributions from discrepant sources. Despite being a requirement, convergence alone does not guarantee integration. 1.1.4 The binding problem Sensory, cognitive and motor processes involve essential interactions among large populations of neurons within different brain regions that must exchange information among themselves. The bind problem refers to how information from distinct populations is exchanged. A solid base to understand the neuronal pattern of activity representing the integration of coherent information is still needed (Roskies, 1999). It is still a general open question, which arises whenever information from distinct areas must be exchanged. The binding problem was originally stated as a theoretical problem when the experiments seemed to indicate that none of the localized parts of the brain could generate some aspects of mind’s function like con8.
(19) 1.2. AN OVERVIEW OF THE FUNCTIONAL ANATOMY OF THE CENTRAL NERVOUS SYSTEM sciousness or reason (von der Malsburg, 1981). Such studies raised hopes to fundamental question like: Will the solution of the binding problem resolve the mystery of consciousness? The most popular hypothesis for the binding conundrum involves the temporal correlation of firing patterns. It states that features should be bound by the synchronization of spikes of distant neurons. This is called the binding by synchrony theory and its validity is still under debate.. 1.2. An overview of the functional anatomy of the central nervous system There are two main lines of thought to understand neuroanatomy proceeding from a simple state to a more complex state (Squire et al., 2003). Evolution is the first line; it is hard to overstate about the importance of evolution because it constitutes a prime foundation of biology. Embryology is the second line; in a much faster time scale, embryology studies the dynamics of development of embryos from a single cell to the fetus stage. From the two complementary approaches we learn that all vertebrates share the same functional systems. This has profound implications on the way the research in those systems is typically undertaken. Such principles offer a solid foundation to tackle elaborated problems involving complex brains. The support of these pillars provides reasonable security to the successful approach: to solve a difficult problem beginning with a simple version and then increasing the level of complexity. The difficult problem in neuroscience consists of understanding the dynamics of a multitude of interconnected neurons and its manifold consequences. Despite the importance of this approach in complex systems, a straightforward extrapolation can occasionally be meaningless. A careful analysis is usually required because the interaction of non-linear elements can lead to unpredictable phenomenology, or can show counter-intuitive behavior (Anderson, 1972). Consciousness is a conspicuous example of behavior that emerge when increasing the complexity level of the system. To understand the emergence of consciousness constitutes a fundamental goal of neuroscience. 9.
(20) CHAPTER 1. BIOLOGICAL OVERVIEW Another remarkable lesson gotten from the evolutionary and the embryologic approaches is that, in terms of cell biology, nerve cells are basically the same in all animals (Squire et al., 2003). The focus is thus directed to what changes most during evolution and embryogenesis: the arrangement of the network. The architecture of the nervous system is profoundly important! 1.2.1 C. elegans: An especial example In spite of many efforts, the anatomical knowledge of the nervous system, studied for centuries, is still not well known, except very general principles. A very celebrated exception occurs with the Caenorhabditis elegans. The C. elegans is a nematode of about one millimeter in length. This worm lives in temperate soil environments, but it is easily grown in the laboratory. It has become a model organism in molecular and developmental biology mainly because of its simplicity. All its somatic cells have been mapped; they are around a thousand cells. In addition, it was the first multicellular organism to have its genome entirely sequenced. C. elegans was also the first and unique (by the date) organism to have the whole nervous system mapped. The wild type organisms are essentially invariant with respect to the number, and type of neurons and the synapses they make. In this way, White et al. (1986) identified all the 302 neurons of the hermaphrodite C. elegans, thus obtaining its complete wiring diagram. White and colleagues succeeded to obtain the neuronal network because they were studying a very simple organism. The neurons of the C. elegans typically have few branches, and make few synapses, being mostly local connections. Nevertheless, the work to obtain the complete neuronal network from reconstructions of electron micrographs of serial sections represents already a huge effort. 1.2.2 Evolutionary perspective From the metabolic viewpoint, it is really expensive to keep a nervous system. Nevertheless, following an evolutionary perspective, it seems intelligible that the nervous system favors the species by improving the behavioral repertoire of an animal. This, in turn, increases the probability of the individuals to survive and to generate offspring. 10.
(21) 1.2. AN OVERVIEW OF THE FUNCTIONAL ANATOMY OF THE CENTRAL NERVOUS SYSTEM Even unicellular organisms utilize several types of taxes to improve their chances of survival. These strategies consist on the movement of the organism towards or away from the external stimulus, typically attempting to reach an optimum concentration. The response could be associated to stimulus of several different qualities: chemical (chemotaxis), light (phototaxis), temperature (thermotaxis), sound (phonotaxis), gravity (gravitaxis), electric field (electrotaxis), concentration of oxygen (aerotaxis), and so on. In the case on chemotaxis, for example, the reliable discernment of shallow gradients of stimulus intensity might involve rather sophisticated mechanisms that combine cooperation and adaptation to perfect the sensitivity (Bray et al., 1998; Sourjik and Berg, 2002; Hansen et al., 2008; Skoge et al., 2011). In the case of multicellular animals, the onset of the nervous system has long been thought to largely improve their fundamental capacities to respond to environmental changes (Parker, 1919). The sensitivity to stimuli increases in the presence of nervous system, and the response to a stimulus can be faster and stronger. These factors have been critical for many animals to survive under evolutionary pressure.. On the history of the nervous system. The Cnidaria was the first phylum to present nervous system (Squire et al., 2003). This phylum contains over 10,000 species of aquatic animals; it comprises jellyfish, corals, anemones and the hydra. The nervous system of an animal from Cnidaria phylum is a decentralized nerve net; they have no brain or central nervous system, see Fig. 1.1. The nerve net of the hydra is distributed rather uniformly throughout the cell body, with the exception of some zones of larger concentration, like the mouth and the base of the tentacles, which could be considered already as a tendency for centralization. The flatworms are the simplest animals to display cephalization and centralization (Squire et al., 2003), which are fundamental organizational trends in the evolution of the nervous system. Besides from sensory and motor neurons, the flatworms have interneurons interpolated between sensory and motor neurons. The interneurons increase the capacity to transmit and process information. Differently of animals from cnidaria, the flatworms have a bilateral symmetry. As shown in the right panel of Fig. 1.1, their neurons form bundles of axons (nerve cords) extend along longitudinal and transverse directions. These nerve cords connect the clusters of neurons (ganglia), which are mostly concentrate in the rostral end (the head). 11.
(22) CHAPTER 1. BIOLOGICAL OVERVIEW. Figure 1.1: Left: the nerve net of a Hydra. Right: The nervous system with bilateral symmetry of a flat worm. Figure adapted from Bio1152 (2012).. Among the bilateral animals, there are two important configurations for the nerve cords. Arthropods, like insects, crustaceans, arachnids, and many other invertebrates, display a ventral nerve cord. Chordates, including all vertebrates, present a dorsal nerve cord surrounded by a notochord. The nerve cord generally defines a prime axis during the development of the chordates.. 1.2.3 Developmental perspective In an extremely faster time scale, the animals may develop the most complex nervous systems starting from a single cell. Remarkably, the early stages of embryogenesis follow basically the same steps for all vertebrates (Squire et al., 2003). This development leads straightforwardly to the main brain regions. The understanding of the development of the nervous system turns out to be an important guide for the modular anatomy of the brain (Kandel et al., 2000). In the ectoderm, the outermost layer of the trilaminar gastrula (early embryo), there is the neural plate. The neural plate, shown in Fig. 1.2, is a spoon-shaped region that gives rise to the central nervous system. As illus12.
(23) 1.2. AN OVERVIEW OF THE FUNCTIONAL ANATOMY OF THE CENTRAL NERVOUS SYSTEM trated in Fig. 1.2, the flat neural plate gets indented along the rostral-caudal axis forming the neural groove. Such invagination process is followed by the merging of the opposing lateral edges of the neural groove. This thin (one cell thick) closed tube is called neural tube.. Figure 1.2: Development of a neural tube from a neural plate. Left and middle columns represent a diagram of human development. Right column shows a chick embryo of two days (top), and a mouse embryo of 9.5 days (bottom). Figure adapted from Trimble (2012); Cell (2012).. Along the rostral-caudal axis, the neural tube presents inhomogeneities that are already the first sign of regionalization. As in the spinal cord, the early neural tube also develops three swellings at its rostral end (Swanson, 1998). Figure 1.3 illustrates the primary vesicles, which correspond to prosencephalon (forebrain), mesencephalon (midbrain), and rhombencephalon (hinbrain) vesicles. Next, the right and left differentiation occurs and the vesicles divide further (Fig. 1.3). The prosencephalon differentiates into two secondary vesicles, telencephalon and diencephalon, whereas the rhombencephalon differentiates into two secondary vesicles, metencephalon and myelencephalon. Following neurulation, the telencephalon gives rise to the cerebral cortex, and cerebral nuclei; the diencephalon gives 13.
(24) CHAPTER 1. BIOLOGICAL OVERVIEW rise to the thalamus and the hypothalamus; the mesencephalon gives rise to tectum and tegmentum; the rhombencephalon gives rise to rhombic lip, alar plate, and basal plate (Squire et al., 2003; Swanson, 1998).. Figure 1.3: Schematic and nomenclatural representation of a human embryo early development from the neural tube to the secondary vesicles. Figure adapted from Trimble (2012).. 1.2.4 Principles of functional anatomy of the central ner-. vous system The central nervous system comprises the brain and the spinal cord. The organization of the central nervous system of vertebrates follows the axis defined by the neural tube, i.e., the rostral-caudal axis. Along this axis, located between the spinal cord (most caudal) and the cerebral cortex (most rostral), there are six main regions (Kandel et al., 2000): Spinal cord. The spinal cord connects the brain to the rest of the body: receiving somatosensory information through afferent pathways, sending motor information through efferent pathways, and coordinating certain reflexes and many autonomic functions. 14.
(25) 1.2. AN OVERVIEW OF THE FUNCTIONAL ANATOMY OF THE CENTRAL NERVOUS SYSTEM. Figure 1.4: Main regions of the central nervous system. adapted from Umm (2012).. Figure. Medulla oblongata. The medulla is the direct rostral extension of the spinal cord. Resembling the anatomy of the spinal cord, the medulla transmits information between the higher regions of the brain and the spinal cord. As well as the spinal cord, the medulla is also responsible for coordinating certain reflexes and many autonomic functions. Pons and cerebellum. The pons is the rostral extension of the medulla, and the cerebellum is located dorsal to the pons. The pons is a relay center that transmits top-down signals from the telencephalon to the cerebellum, and to the medulla; and transmits bottom-up sensory signals to the thalamus. The human cerebellum has more neurons than the remainder of the brain combined (Williams and Herrup, 1988). Most of those neurons are tiny granule cells. Besides from these diminutive and numerous neurons, the Purkinje cells are also found in the cerebellum. These Purkinje neurons are widely known because of its fascinating and extensive dendrites (depicted in section 1.4.2). Among other functions, the cerebellum contributes to behavioral functions, and modulates cognitive information processing. For example, the 15.
(26) CHAPTER 1. BIOLOGICAL OVERVIEW cerebellum plays the role of coordinating and correcting movements, during tasks involving fine motor skills. Midbrain. The midbrain is the rostral extension of the pons, and is associated with different sensory systems: visual, auditory, and somatosensory. The midbrain also plays a role in temperature regulation, sleep/wake cycles, and alertness. Diencephalon. The diencephalon, which lies rostral to the midbrain, is comprised of two main structures: the hypothalamus and the thalamus. Forming the ventral part of the diencephalon, the hypothalamus coordinates activities of the autonomic nervous system, and regulates metabolic process. The thalamus plays the role of the gateway to the cortex, because it relays most of the information coming from the lower regions. The thalamus is one of the key regions of this thesis. We shall discuss the function and organization of the thalamus in more detail below. Cerebral hemispheres. The cerebral hemispheres are composed of cerebral cortex, and the basal ganglia (Kandel et al., 2000). Next we discuss some general features of the cortex, and the hippocampus (which is located in the medial temporal lobe). Along with the thalamus, those regions are central for the results of the thesis. cortex Comprising more than three fourths of the volume of the human central nervous system (see table 1.1), the cerebral cortex is a major processing center. This region is concerned with perceptual awareness, memory, attention, thought, language, and consciousness. Roughly speaking, the cortex can be viewed as a series of two-dimensional overlapping layers (up o six), which have been packed to cover a core brain region (basal ganglia and diencephalon) and to fit inside the approximately spherical surface constrained by the skull. This compression process gives rise to several folds: gyri and sulci. Despite a considerable fold variation among people (Toro et al., 2008), some notable divisions of the human cortex are invariant. These prime fissures, used as landmarks, separate each cortical hemisphere into four lobes: frontal, parietal, temporal, and occipital. 16.
(27) 1.2. AN OVERVIEW OF THE FUNCTIONAL ANATOMY OF THE CENTRAL NERVOUS SYSTEM. cerebral cortex basal ganlgia diencephalon midbrain hindbrain cerebellum spinal cord. proportions by volume (%) rat human 31 77 7 4 6 4 4 1 7 2 10 10 35 2. Table 1.1: Table extracted from Swanson (1995).. The cortex surface has a gray color. This color arises from large collections of cell bodies, dendrites and unmyelinated fibers. Thus, this part is called gray matter, and it surrounds the deeper white matter. The white matter is manly composed by glial cells, and myelinated axons responsible for transmitting signals between separated regions. The name of this part of the nervous system comes from the lipid tissue of the myelinated axons, which has a white color. Abounding in the white matter, the long-range connections are a general feature across several species. Comparing different mammalian species, there is a robust power-law scaling relating the volume of the gray matter to the volume of the white matter. This allometric relationship is shown in Fig. 1.5. The division of brain tissue into gray and white matter is a ubiquitous feature of the vertebrate anatomy. Different sorts of explanations have been given for this intriguing fact. Some authors claim that the origin of this separation could be a consequence of minimizing the wiring volume (Ruppin et al., 1993; Murre and Sturdy, 1995). Based on scaling arguments, an alternative proposal to solve this conundrum suggests that the fundamental element to minimize is not the wiring volume, but the conduction delay (Wen and Chkolvskii, 2005). On top of that, this optimization of the latencies would also explain why the cortical thickness remains almost unchanged whereas the brain volume varies by orders of magnitude between species (Fig. 1.5). Many efforts have been done to characterize the cortical networks. At the macroscopic level of cortical regions, which are connected by long-range 17.
(28) CHAPTER 1. BIOLOGICAL OVERVIEW. Figure 1.5: Scaling relation between the volume of neocortical gray and white matter. Figure extracted from Zhang and Sejnowski (2000).. fiber pathways, the mammalian cortex is characterized solely for a few of the most studied mammals like the cat (Scannell et al., 1999), and the monkey (Felleman and Van Essen, 1991; Kötter, 2004). Sometimes considered as the basic functional units of the neocortex, a next modular level or organization is given by the cortical columns and microcolumns (Mountcastle, 1997; Mountcastle et al., 1957; Mountcastle, 1957). These columns are modules that extend vertically across the layers, perpendicular to the pial surface. What defines a column is the fact that the neurons within a given column encode similar features. Despite the many efforts, like the neuronal reconstruction by electron microscopy (Briggman and Denk, 2006), the architectural network at the colum18.
(29) 1.2. AN OVERVIEW OF THE FUNCTIONAL ANATOMY OF THE CENTRAL NERVOUS SYSTEM nar level, as well as the microscopic level, have remained elusive (Sporns et al., 2004). This structural information is a key feature to build more precise models. The absence of detailed structural information requires a workaround. For this reason, we stick to a less constrained relationship, which is generally satisfied by the cortex. Microscopically, the cortex is mainly composed of excitatory pyramidal cells, and local inhibitory interneurons, in a proportion of 80% and 20% respectively. Typically, we simply utilize random recurrent networks (following this recipe), or a mesoscale model (mimicking this recipe). This is a frequent issue, and, from now on, we shall implicitly or explicitly invoke this argument in almost every chapter. The results of this work focus on the synchronization properties of cortical populations of neurons. Experimental observations of synchronization between distant neurons have long been observed (Engel et al., 1991; Frien et al., 1994; Roelfsema et al., 1997), however, the proposed mechanism explaining the observations (Traub et al., 1996) have not been entirely compelling. The hesitation appears especially because of the restricted robustness of the spike doublets model (Traub et al., 1996) with respect to key elements of the system, such as the broad range of cell types and delays in the connection. The universality of the synchronization found in the experiments suggests that a more general phenomenon must underpin this collective order. Based on recent advances in the synchronization aspects of delay-coupled systems [i.e., dynamical relaying (Fischer et al., 2006)], we attempt to identify and characterize the zero-lag long-range cortical synchronization. The first problem we tackle is how such isochronous cortical synchronization emerges in a generic cortical population of spiking neurons (Vicente et al., 2008b, 2009).. hippocampus Historically, the brain was first analyzed by post-mortem inspections. Several regions were named based on the appearance that they had in the freshly dissected state (Squire et al., 2003). One example, as depicted in the Fig. 1.6, the hippocampus was thus named because of the similarities of its shape with the sea horse. The hippocampus is among the most well studied brain areas. This region attracts much interest because it plays an important role in memory for19.
(30) CHAPTER 1. BIOLOGICAL OVERVIEW. Figure 1.6: Comparison of a hippocampus with a sea horse. Extracted from Wikipedia (2012a).. mation, and spatial navigation (Buzsáki, 2010). The consolidation of both long-term and short-term memories depends on the hippocampus. Remarkable examples of hippocampal activity include the place cells (O’Keefe and Nadel, 1978) and the replay of waking assembly sequences during sleep (Lee and Wilson, 2002). For example, the hippocampal place cells have been proposed to constitute a cognitive map (O’Keefe and Nadel, 1978). Additionally, there are further practical reasons to understand the hippocampus and its relationship with the brain. Hippocampal damage is one of the first events of Alzheimer’s disease. Moreover, schizophrenia and epilepsy have also been associated with abnormal activity of the hippocampus. The hippocampal activity is characterized by some oscillatory rhythms, ranging from slow to hight gamma oscillations. Recently, the isolated hippocampus has been shown to generate theta oscillations (Goutagny et al., 2009). Such rhythms spans beyond the default activity of the hippocampus. In rodents, for instance, theta oscillations are even enhanced when the animal is moving. The hippocampus exchanges a lot of information with cortical regions. For example, it has been recently proven that the prefrontal cortex and the hippocampus can develop phase locked oscillations (Siapas et al., 2005). As an attempt to establish a solid framework for such observations, we study the theta-band synchronization of distant cortical areas mediated by the hippocampus. As presented in chapter 6, our results suggest that such wellknown phase-locking between prefrontal cortex and hippocampus is a facet 20.
(31) 1.2. AN OVERVIEW OF THE FUNCTIONAL ANATOMY OF THE CENTRAL NERVOUS SYSTEM of a hippocampal dynamical relaying (Gollo et al., 2011). In addition to this phase-locking, a recurrent scenario, observed both in mice experiments and simulations, shows other cortical areas isochronously synchronized with the prefrontal cortex. This has been the prominent configuration generated by the hippocampal relaying. Moreover, in the experiments, such configuration appears with a higher probability when the mouse moves rather then quiet. This indicates that the dynamical relaying might play a key role in the integration of information from distant brain areas.. thalamus The thalamus is a pivotal product of the embryonic diencephalon. Lying under the cerebral hemispheres, the thalamus is a collection of nuclei that occupies a core position in the brain. Such centrality confers the thalamus a remarkable capacity to exchange information with the cerebral cortex throughout extensive thalamocortical radiations. With the exception of the olfactory stimulus, which is primitive in evolutionary terms, all sensory stimuli intermediately pass through the thalamus. For this reason the thalamus is famous to be the gateway to the cortex. Figure 1.7 illustrates the central location of the thalamus in the brain, the anatomic configuration of its nuclei, and the areas bridged by the extensive thalamocortical radiations. According to the functional role, each thalamic nucleus is classified as one of the three classes: specific relay nucleus, association nucleus, or nonspecific nucleus (Kandel et al., 2000). The specific relay nuclei receive sensory afferent input from a given sensory modality or motor function, project to and receive the feedback from the respective primary motor or sensory region of the cortex. The specific relay nuclei are: the medial geniculate (hearing), the lateral geniculate (vision), the ventral posteromedial (somatic sensation of the face), the ventral posterolateral (somatic sensation of the body), the ventral intermedial (motor), the ventral lateral (motor), the ventral anterior (motor), and the anterior nuclei (limbic function). The association nuclei receive input from several regions of the brain and project to an association cortex. The association nuclei are: the lateral dorsal (emotional expression), lateral posterior (integration of sensory information), pulvinar (integration of sensory information), and the media dorsal (limbic function). 21.
(32) CHAPTER 1. BIOLOGICAL OVERVIEW. Thalamocortical radiations Central sulcus. Thalamic nuclei CM LD LP MD VA VI VL VPL VPM. Centromedian Lateral dorsal Lateral posterior Medial dorsal Ventral anterior Ventral intermedial Ventral lateral Ventral posterolateral Ventral posteromedial. Internal medullary lamina Intralaminar nuclei Other medial nuclei Midline (median) nuclei MD Interthalamic adhesion. Anterior nuclei. LD LP VA. Pulvinar VL VI. From globus pallidus and substantia nigra Reticular nucleus (pulled away). Medial geniculate body. CM VPL VPM. Acoustic pathway From cerebellum. Somesthetic from body (spinothalamic tract and medial lemniscus). Lateral geniculate body Optic tract Somesthetic from head (trigeminal nerve). Figure 1.7: Thalamus in the human brain. The location of the thalamus (right panel), the position of the thalamic nuclei (bottom panel), and the thalamocortical areas connected by the thalamocortical radiations (top and bottom panels). See text for details. Figure adapted from Eneurosurgery (2012).. The other nuclei (midline, intralaminar, centromedian, centrolateral and reticular) have nonspecific functions. These nuclei have a widespread con22.
(33) 1.2. AN OVERVIEW OF THE FUNCTIONAL ANATOMY OF THE CENTRAL NERVOUS SYSTEM nectivity pattern. They are thought to regulate the motivational and the arousal states, as well as the level of activity of the brain. Except for the reticular nucleus, their outputs consist of excitatory projections to other regions. The reticular nucleus, on the other hand, sends inhibitory projections to the other thalamic nuclei. It plays an important role in controlling and modulating the activity of the thalamus. Considering the thalamus as the gateway to the cortex, the reticular nucleus is the guardian of the gateway (McAlonan et al., 2008) By analogy with the specific relay nuclei, it has been proposed that the olfactory bulb, which has also segregated and specialized moduli (glomeruli), plays the role of olfactory thalamus to pre-process the information, and to make the loops with the cortical areas involving the olfactory stimulus (Kay and Sherman, 2007). The thalamus plays the important role of being a relay station. It is believed that the cortical areas would not be able to interpret the sensory stimuli without the pre-processing of the information at the thalamus. The first stride in the generation of sensory perception occurs through the reception and transmission of unimodal sensory stimulus to the primary cortical areas. In a series of back and forth thalamocortical exchanges of information, the perception of the different sensory stimulus is integrated. These thalamocortical loops represent a fundamental flux of information, ascending and descending along the hierarchical pathways (Llinás et al., 1999). Such loops have been proposed to be the neural mechanism underlying consciousness (Llinás and Ribary, 1993; Ward, 2011). It has been argued that virtually any trivial task involves at least three distant brain regions (Kandel et al., 2000). This required integration is a central and recurrent topic of the thesis. A model of the thalamocortical circuit that attempts to elucidate a possible mechanism to give rise to such integration is presented in chapter 5. We consider the dynamical-relaying model in which the role of mediating element is played by the thalamus (Gollo et al., 2010). Remarkably, according to our results, the thalamus is not a passive element in the thalamocortical circuit, but instead its dynamics governs the long-distant zero-lag cortical synchronization. Due to the extensive thalamocortical radiations, the thalamus has always been the strongest candidate to mediate the cortico-cortical dynamics and synchronization. Not surprisingly, recent experimental evidences (Temereanca et al., 2008; Wang. 23.
(34) CHAPTER 1. BIOLOGICAL OVERVIEW et al., 2010a,b; Bruno, 2011; Poulet et al., 2012) support the fundamental importance of the thalamus in controlling the cortical activity.. 1.3. A brief comparative overview on the experimental measurements of brain activity Along the last century, during the course of the history of neuroscience, the anatomy of the nervous system has been studied thoroughly. Riding on top of such anatomical substrate, the neuronal dynamics is of exceptional relevance. Along a lifetime, there are certain changes in the anatomy, however, occurring at a much slower time scale than the changes in the dynamics. Thereby, the neuronal dynamics is asserted fundamental for cognition. The execution of essentially any task depends on some specific pattern of neuronal activity. There is an important research field in neuroscience concerned to assess the neuronal activity. Brain activity can be assessed with recording methods or imaging techniques. The electrophysiological recordings capture the action potentials and the post-synaptic potentials. The electric signaling characterizes in a most reliable way the neuronal activity, however, this comes with a price: it requires an invasive method. There are also noninvasive neuroimaging methods based on electrophysiological principles. Two important examples are electroencephalography (Berger, 1929) (EEG) and magnetoencephalography (Cohen, 1968) (MEG). These popular neuroimaging techniques measure electrical potentials and magnetic fluxes respectively with high temporal resolution. However, as illustrated by Fig. 1.8, the spatial resolution is rather poor, even when taking into account the electromagnetic source imaging (Michel et al., 2004) (ESI), which improves the spatial resolution of EEG and MEG to the order of centimeter. Other neuroimaging methods based on metabolic and hemodynamic principles can improve this limited spatial resolution. Some examples of such neuroimaging methods are functional magnetic resonance imaging (fMRI), near-infrared spectroscopy (NIRS), single-photon emission computed tomography (SPECT), and positron emission tomography (PET). The metabolic and hemodynamic activities reflect the neuronal dynamics in an indirect 24.
(35) 1.3. A BRIEF COMPARATIVE OVERVIEW ON THE EXPERIMENTAL MEASUREMENTS OF BRAIN ACTIVITY. Figure 1.8: Limits of resolution of the different experimental techniques. Blue areas represent the ranges of resolution of the noninvasive techniques. Red areas represent the ranges of resolution of the invasive electrophysiological recordings from single-unit activity (SUA), multi-unit activity (MUA) and local field potential (LFP). Figure adapted from Liu (2008).. way. The neuronal activity consumes energy and triggers a cascade of metabolic and hemodynamic events. These events can be traced with fine spatial resolution but poor temporal resolution (see Fig. 1.8) because these indirect effects of neuronal activity take place at a much slower time scale. For the time being, one cannot measure the brain activity with fine spatial and temporal resolutions by non-invasive methods. A promising advance in this direction is called the multimodal neuroimaging (Liu, 2008) (MN), which integrates different types of neuroimaging methods EEG/MEG and fMRI. To detect synchronization between distant neurons (or specific neuronal regions) is among the most technical challenges. Such detection requires simultaneously recorded data with high temporal precision (∼1 millisecond). 25.
(36) CHAPTER 1. BIOLOGICAL OVERVIEW In addition, an accurate spatial precision, which to a great extent depends on the spot of interest, is often desired.. 1.4. Biophysical overview of the neurons and neuronal interactions The brain activity is a product of the neuronal dynamics combined with the neuron-to-neuron communication. This section addresses the fundamental problem of how the brain dynamics is generated. We start by identifying the building blocks of the brain; some authors (Izhikevich, 2007) claim that the neuron is the most important concept in neuroscience. Next, we describe the typical anatomy of a neuron, and the main functions of its constituents. We follow characterizing the neuronal dynamic states originated from the activity of the ionic channels. Finally, we discuss the types of neuronal communication.. 1.4.1 Neurons Cells are the basic structural unit in all living beings. This idea is credit to Schwann and Schleiden who in 1839 suggested that cells were the fundamental unit of life and all organisms were composed by one or more cells. In 1858, Rudolf Virchow, concluded that all cells derive from pre-existing cells, thereby completing the classical cell theory. At that time, however, the nervous system was still considered to be an exception. The nervous tissue was thought to be a continuous reticulum system owing to its similarity to wire elements. This idea persisted until the Camillo Golgi’s development of a new histological stained technique with a silver chromate solution, which allowed Ramón y Cajal to perform his experiments. The technique dyes only a few neurons [∼ 2% of the cells (Kandel et al., 2000)], and enables the observation of single neuronal cells. Based on a deep investigation, Cajal concluded that the neurons were the fundamental building blocks of the nervous system (Squire et al., 2003). 26.
(37) 1.4. BIOPHYSICAL OVERVIEW OF THE NEURONS AND NEURONAL INTERACTIONS The human brain has about 1010 neurons organized in a multilevel hierarchical system (Shepherd, 1998). The nervous system presents an enormous diversity of neuron types, connectivity, functionality, etc. Our description is solely restricted to the most common behavior, despite the large variability that exists. In this section we describe the neuron, first by its anatomical structure, and second by its central dynamical states: rest, spike and refractory period. At last, we comment on how the transitions between the dynamical states take place. 1.4.2 Neuronal morphology Based on the neuronal morphology and on the cytological displaying features, Cajal proposed the principle of dynamic polarization (Kandel et al., 2000). This principle [which is part of the neuron doctrine (Golgi, 1906; Shepherd, 1991)] states that the activity coming from the dendrites are processed and passed from the axon to neighbor neurons. Despite of some exceptions (e.g., dendrodentric synapses), this directionality in the flow of activity typically occurs. In most cases the neuronal morphology can be understood as several parts adapted to fulfill its functional role. Some of the general morphological characteristics satisfied by most neurons (Kandel et al., 2000) are displayed in Fig. 1.9.. Figure 1.9: Sketch of a typical neuron with myelinated axon. Figure adapted from Wikipedia (2012b). The three main parts of a neuron are the dendrites, the soma (cell body), and the axon. Most of the incoming inputs to a neuron come from the dendrites. 27.
(38) CHAPTER 1. BIOLOGICAL OVERVIEW Presumably, the great distinctive feature of neurons is the presence of large dendritic trees. They are responsible for most of the variety in neuron size, shape and types [there are about 104 different morphological classes of neurons (Johnston et al., 1996)]. Figure 1.10, for example, compares two distinct types of neurons: The cerebellar Purkinje cell, and the cortical pyramidal cell. The dendritic tree contains most of the postsynaptic terminals of the chemical synapses. Several functions (Stuart et al., 1999) of the dendritic arbors have also been claimed: • to perform biological gates (Stuart et al., 1999; Koch, 1999); • to detect the coincidences of incoming spikes (Agmon-Snir et al., 1998; Koch, 1999); • to contribute with plasticity via dendritic spikes (Golding et al., 2002); • to increase the learning capacity of the neuron (Poirazi and Mel, 2001); • to improve the ability to distinguish the intensity of an incoming stimulus [i.e., to enhance the dynamic range] (Gollo et al., 2009, 2012a). Despite such dendritic-computation properties, the role of dendrites seems yet distant from been clearly understood. The cell body (soma) contains the nucleus and most of the cytoplasmic organelles. It is responsible for large part of the metabolic processes. Moreover, this region is where most recordings of the neuronal electrical activity take place. In general, the axon can extent to regions far away from the soma. It might have different size (from 0.1 to 2,000 mm) depending on its functionality (Kandel et al., 2000). It starts at the axon hillock, where the action potential is generated (see section 1.4.4), and present ramifications at the extremities. Most of the pre synaptic terminals come out from those terminal buttons. The axon might be covered by myelin, which protects and controls some properties of neuronal activity, such as the velocity of the pulse propagation. The axon is the crucial unit specialized to conduct the action potentials. Such propagation essentially occurs without distortion. This reliability property 28.
(39) 1.4. BIOPHYSICAL OVERVIEW OF THE NEURONS AND NEURONAL INTERACTIONS. Figure 1.10: Examples of two different types of neurons. Top: Drawings by Ramón y Cajal of a human Purkinje cell (left), and a human pyramidal cell (right). Bottom: A rat Purkinje neuron injected with a fluorescent dye (left) [panel extracted from Rikenresearch (2012)], and a confocal laser scanning microscope image of a typical mouse frontal cortical layer 3 pyramidal cell (right) [panel extracted from Bumc (2012)].. is important because the action potentials (or spikes) are considered to carry most of the information of the neuronal activity (Gerstner and Kistler, 2002; Fries et al., 2007), either by the precise timing of the events, or by the firing rate over a certain period. 29.
(40) CHAPTER 1. BIOLOGICAL OVERVIEW 1.4.3 Nerst potential The neurons are, as well as all other living cells, enclosed by a cell membrane. It separates the extracellular medium from the interior of the neuron. The neuronal membrane is a lipid bi-layer of 3 to 4 nm thick, which acts as a capacitor, separating the ions lying along its interior and exterior surface (Gerstner and Kistler, 2002; Dayan and Abbott, 2001). Variations of the ionic concentrations give rise to the potential difference maintained by the cell membrane. This is called the membrane potential. Under normal conditions, the membrane potential remains around -90 to 50 millivolts. The membrane potential also defines the rest potential, a dynamical equilibrium state of ions coming back and forth. Since the lipid bi-layer is impermeable in natural conditions, the ions might only cross the cell membrane via specialized structures (pore-forming proteins) called ionic channels, or by the active selective pumps. The operation process of channels does not involve metabolic energy, whereas the active movement of ions by the pumps requires the energy produced by the hydrolysis of adenosine triphosphate [ATP] (Kandel et al., 2000). Most channels possess gates that open in response to ligands (especially neurotransmitters), or voltage changes; they normally close by an intrinsic inactivation process (Lehmann-Horn and Jurkat-Rott, 2003). The ionic channels correspond to the molecular basis for the intracellular signal transduction, the maintenance of the resting potential, and the generation of action potentials. There are a variety of different types of ionic channels; each neuron has more than ten types. Each channel type has its own properties; in particular, some of them are highly selective to a specific ion. Figure 1.11 illustrates the typical behavior of a voltage-gated ionic channel.. 1.4.4 Neuronal activity Neurons are nonlinear excitable elements, i.e., they generate a spike when its membrane potential exceeds a defined threshold [about 20-30 mV above the rest potential (Gerstner and Kistler, 2002)]. This excitation is also called action potential. When the membrane potential of a given neuron is perturbed without reaching the threshold, it relaxes back to its rest potential in a time scale governed by the membrane properties. 30.
(41) 1.4. BIOPHYSICAL OVERVIEW OF THE NEURONS AND NEURONAL INTERACTIONS. Figure 1.11: Diagram of the possible states of a voltage gated cation channels. This type of channels is important for the sodium, potassium, and calcium ions. A depolarization of the rest membrane (left) promptly opens the channel allowing a flux of cations according to their electrochemical gradients (right). The channel with a reverse polarization closes (bottom) and reopens very rarely. From refractory state, the membrane recovers back to the resting state. Owing to a slow depolarization process, a transition from the polarized to the inactivated state may also occur without channel opening (accommodation). Figure extracted from Lehmann-Horn and Jurkat-Rott (2003).. The spike is generated in a particular region called axon hillock located in between the soma and the axon. The pulse propagates (Fatt, 1957) mainly throughout the axon (forward propagation), but may also propagate to the dendrites [backpropagating spike (Stuart and Sakmann, 1994; Johnston et al., 1996; Falkenburger et al., 2001; Häusser and Mel, 2003)]. The spike occurs in a very narrow time window followed by a sudden decay of the membrane potential bellow the rest state. At this moment, the neuron is said to be hyperpolarized, and its potential difference with respect to the exterior region is greater than at rest. This stage is called refractory period. During the refractory period the neuron rarely gather enough contributions to spike. Typically, the membrane potential relaxes to the rest potential before another cycle happens. Figure 1.12 B shows an example of a whole cycle of microelectrode recording. This particular case corresponds to the seminal experiments of Hodgkin and Huxley in the squid giant axon (Fig. 1.12 A). 31.
(42) CHAPTER 1. BIOLOGICAL OVERVIEW. Figure 1.12: Intracellular recording of an action potential in the squid giant axon. (A) A microelectrode of 100 µm of diameter is inserted into the interior of a squid giant axon of about 1 mm. (B) The dynamics of an action potential dynamics. The y axis refers to the membrane potential (millivolts) while the x axis represents the time. The time interval between two peaks below equals to 2 ms. Figure adapted from original work of Hodgkin and Huxley (1939).. 1.4.5 Neuronal communication Charles Sherrington, in 1897, suggested that neurons perform functional contacts with other neurons and other types of cells through synapses. The existence of such structures was solely demonstrated 50 years later by electron microscopy (Squire et al., 2003). Currently, we define the synapse as the specialized junctions through which cells of the nervous system signal to one another and to non-neuronal cells, such as muscles or glands. It is also the region in which two neurons are closest to each other. The cell transmitting a signal is known as pre-synaptic cell whereas the cell receiving the signal is the post-synaptic cell. The brain is a highly connected tissue. Each neuron exchanges synaptic information with about 104 other neurons (Kandel et al., 2000). There are at least three different ways of communication among neurons: chemical synapses, electrical synapses and ephaptic interaction. 32.
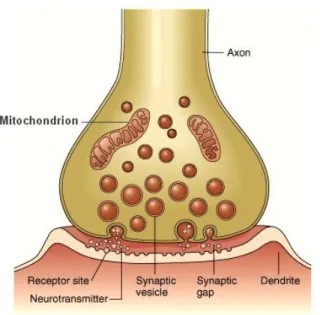
(43) 1.4. BIOPHYSICAL OVERVIEW OF THE NEURONS AND NEURONAL INTERACTIONS Chemical synapse The predominant form of communication between neurons of vertebrates is the chemical synapse (Gerstner and Kistler, 2002). In this type of synapse there is a separation of the order of a few tens of nanometers called synaptic cleft, see Fig. 1.13. In the pre-synaptic terminals, there are collections of synaptic vesicles, each containing thousands of molecules of neurotransmitters. The vesicles release neurotransmitters in the synaptic cleft when the pre-synaptic neuron fires. After the spike, the neurotransmitters suffer a diffusion process in the extra cellular space of the synaptic cleft space. The molecules of neurotransmitters may bind to the post-synaptic cell receptors. The effective coupling of neurotransmitters triggers the opening of the ionic channels. This dynamics of the channels generates the postsynaptic potentials, which are local changes (excitatory or inhibitory) of the membrane potential. If the potential difference exceeds a certain threshold, the post-synaptic neuron fires, concluding the communication. Note that, in this case, there is an anatomical difference between two well-defined cells, which makes this type of communication unidirectional. The resultant variation of membrane potential of the postsynaptic neuron depends on the type of neurotransmitter and the number of channels opened due to the binding of neurotransmitters. There are several types of neurotransmitters. Some of them excite (Brock et al., 1952) the postsynaptic neuron (increase its membrane potential, or depolarize); others inhibit (Wilson and Cowan, 1972; Duchamp-Viret and Duchamp, 1993; Rinzel et al., 1998) the postsynaptic neuron (decrease the membrane potential, or hyperpolarize). Our results focus on the chemical synapse because it is the most common type of interaction present in the brain.. Electrical synapse Another route of neuronal communication is via electrical synapses. The electrical synapses occur through the electrical interaction between cells. In this case, the cellular membranes of neighbor neurons are located very close to each other. They are directly connected through specialized channels called gap junctions, see Fig. 1.14. These gap junctions are proteins that have the channels larger than the pores of the ionic channels. Various substances are simply free to spread by these channels. More importantly, 33.
(44) CHAPTER 1. BIOLOGICAL OVERVIEW. Figure 1.13: Diagram of the action of a typical chemical synapse, where the axon represents the presynaptic terminal and the dendrite represents the postsynaptic terminal. Figure extracted from Hrsbstaff (2012).. the gap junction enables a bidirectional and virtually instantaneous flow of current between the neurons. Differently from the chemical synapses that are pulse-coupled, the electrical synapses have virtually instantaneous diffusive coupling. The effects of the chemical synapses are intermittent and sporadic, typically maintaining the communication active solely for brief time intervals. Such differences in the interactions can be reflected in the dynamics of neuronal networks (Balenzuela and García-Ojalvo, 2005; Rossoni et al., 2005; Feng et al., 2006; Pérez et al., 2011). 34.
(45) 1.4. BIOPHYSICAL OVERVIEW OF THE NEURONS AND NEURONAL INTERACTIONS. Figure 1.14: Schematic representation of a gap Junction. Two neurons get very closed together separated by an uniform gap, roughly 2-3 nm in width. Figure extracted from Antranik (2012).. Ephaptic interactions A third, and less common type of neuronal communication is called ephaptic interaction. Formally, ephaptic coupling is the process by which neighboring neurons affect each other by current spread through the extracellular space (Lowe, 2003; Bokil et al., 2001; Furtado and Copelli, 2006). Eventually, in some cases of convergence of unmyelinated neurons, the axons gather into densely packed fascicles allowing the neuronal communication. An example of extreme convergence that occurs in mammals is the projections of the olfactory receptor neurons from the olfactory epithelium to the Mitral cells of the olfactory bulb.. 35.
(46)
(47) Chapter 2. On the Different Modeling Levels From subatomic elementary particles to universe(s), models span all spatial scales. The determination of the most appropriated modeling level highly depends on the features of interest. The best model for a given feature can be useless for another. The quest for better models is a fundamental and interminable task. The brain, as a highly complex system, offers a multitude of functions, mechanisms, and behaviors. All of them become better understood after modeled (formally), or a set of experiments performed. Even the most pure empirical data demand a qualitative model to explain the results. Therefore, in science, one can never avoid modeling, which can indeed be of countless diverse natures. In particular, quantitative models, amenable to mathematical analysis, provide the advantage of enabling a formal consistency check. Furthermore, the understanding of suitable models of any kind frequently leads to successful predictions. Analogously to experiments, in which each experimental technique contains its own limitation, the validity of each model is also restricted by some boundaries. Thereby, it is important to take into account such restrictions to select the best model.. 37.
(48) CHAPTER 2. ON THE DIFFERENT MODELING LEVELS In neuroscience, where the quantum aspects have not been proved yet to play a role1 , probably, the smallest modeling scales correspond to the dynamics of the ionic channels. Several complex mechanisms of molecular interactions of the channels dynamics remain poorly understood. However, since the pioneer work of Hodgkin and Huxley, in a major conceptual leap, the opening and closing kinetics of the ion channels was deduced (Hodgkin and Huxley, 1952; Dayan and Abbott, 2001). They considered the conductance per unit of area of ion i (Gi ) equals the maximal conductance per unit of area (gi ) times the probability of finding a channel in the open state Pi , i.e., Gi = gi Pi . In turn, Pi might depend on one or more gates. In the case of persistent conductances (single gate), taking n (1 − n) as the probability of a subunit gate being permissive (non-permissive), then Pi = nk , where k represents the number of gating events (assumed independent). The probability of finding a channel in the open state is governed by the dynamics of n: dn = αn (V)(1 − n) − βn (V)n , (2.1) dt where αn (V) is the non-permissive to permissive transition rate, and βn (V) is the permissive to non-permissive transition rate. Finally, following the steps of the seminal work by Hodgkin and Huxley (1952), fitting these rates to the experimental data renders a biophysical model for the conductance. Another important subcellular elements to model is the synaptic dynamics. The optimal synaptic model customarily depends on the precision craved. For example, the postsynaptic potentials can assume a variety of shapes: delta functions, exponential functions, alpha functions, and so on. The strength of the synapses also varies as a function of time (Bi and Poo, 1998; Abbott and Nelson, 2000). It has been claimed that the synapses play indeed a computational role (Abbott and Regehr, 2004). However, for many purposes, say whenever the focus is restricted to the events occurring in a fast time scale, it is a good approximation to assume a steady synaptic strength. To summarize, the phenomenology highlights that there are plenty of interesting behaviors at the subcellular level. This chapter, however, aims at addressing the modeling strategies beyond the subcellular level, and to illustrate some of the major approaches that have been currently used. We start by the single neuron model. The approach of section 2.1 takes into account the neuronal tree topology and 1 There is not only researches, but also a journal (Neuroquantology), handling with the interface of neuroscience and quantum mechanics.. 38.
(49) 2.1. DETAILED NEURON MODELS considers the neuron as a spatially extended system. Although the most biophysically realistic model considers the neuronal structure, this strategy presents several limitations regarding its tractability. The most straightforward approximation to circumvent this limitations is to consider the neuron as a punctual element (section 2.2). To ignore the intricated morphology allows insights that, in several cases, justify the approximation. In particular, this compromise can be very convenient to study the behavior of a large number of interconnected neurons (section 2.3). In fact, it is already a considerable computational task to model populations of neurons using simple spiking neuron models. Frequently, a further simplification is advisable: to reduce the parameter space by the use of coarse-grained mesoscale models (section 2.4).. 2.1. Detailed neuron models The origin of the detailed neuronal modeling dates back to the development of the cable theory. Analogously to the heat equation, the cable theory comprises a partial differential equation that considers the membrane potential (V) as a function of space (x) (long axis of the neurite) and time (t) (Niebur, 2008): ∂V ∂2 V τ − λ2 2 = VL − V ; (2.2) ∂t ∂x where the parameters are: τ, a characteristic time scale; λ, a characteristic length; and VL , the equilibrium membrane potential. The cable theory was further improved to study the cylindrical geometry of the cable (Rall, 1959, 1964), and its ramifications (Mel, 1993), as well as to understand the activity of pulses propagating through small buttons placed into the membrane called spines (Segev and Rall, 1988). These studies motivated the extensions to the two-compartmental model (Pinsky and Rinzel, 1994), and the multicompartmental model (Traub et al., 1991; Migliore et al., 2005; Rumsey and Abbott, 2006; Root et al., 2007). The search for the most biologically realistic model has been a trend in neuronal modeling. The approach requires details concerning the neuronal morphology, the distribution of channels along the neuron, the precise behavior of each channel type, and so on. Those elements are largely unknown, 39.
Figure


+7


Documento similar
One of these problems is whether the critical coupling strength for the onset of synchronization remains finite in the thermodynamic limit for scale-free (SF) networks characterized
In this way, the quantization of the Kuramoto model is straightforward and includes its classical counterpart as a limiting case: The quantum version incorporates quantum
I have studied oscillations and spike synchronization in neural systems, and ap- plied them to different problems: binding, binocular rivalry and image segmentation.. Synchronization
The evidence that in our case of the Kuramoto model [Equation (5)] the GD-RBM method allows for a more efficient control computation, in particular for large oscillator networks,
There is no synchronization in the activity of these neurons: there are several epochs in which neuron a 6 remains silent whereas neuron b 6 is active; However, tran-
We will first address the local electronic structure of graphene with defects with a tight binding model, and then we will proceed to add interactions in the form of a Hubbard model
For instance, the best overall accuracy of bagging in Breast with 20% noise is achieved using a 10% sampling ratio: The test error goes from 4.1% when no noise is injected to 3.5%
In particular, different versions of the training set for the base learners can be used, as in bagging (bootstrap sampling of training data), class-switching (noise injection in
