TítuloMethodology for the Study of the Envelope Airtightness of Residential Buildings in Spain: A Case Study
20
0
0
Texto completo
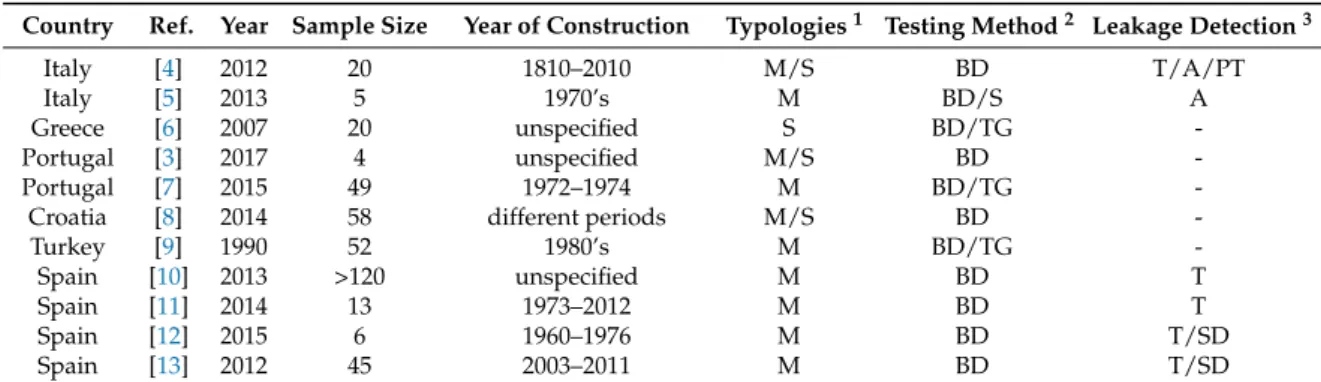
(2) Energies 2018, 11, 704. 2 of 20. higher energy consumption, lack of thermal comfort, entry of pollutants and odours, noise, inadequate functioning of ventilation systems, less protection against fire, etc. There are numerous studies that have been carried out in Northern Europe, USA, and Canada for decades [2]. However, in Mediterranean countries there is still a lack of knowledge in this area [3]. Some field studies have been carried out to characterize the behaviour of the envelope of residential buildings concerning infiltration (Table 1): Table 1. Examples of studies of airtightness characterization carried out in Mediterranean countries. Country. Ref.. Year Sample Size. Italy Italy Greece Portugal Portugal Croatia Turkey Spain Spain Spain Spain. [4] [5] [6] [3] [7] [8] [9] [10] [11] [12] [13]. 2012 2013 2007 2017 2015 2014 1990 2013 2014 2015 2012. 20 5 20 4 49 58 52 >120 13 6 45. Year of Construction 1810–2010 1970’s unspecified unspecified 1972–1974 different periods 1980’s unspecified 1973–2012 1960–1976 2003–2011. Typologies 1 Testing Method 2 Leakage Detection 3 M/S M S M/S M M/S M M M M M. BD BD/S BD/TG BD BD/TG BD BD/TG BD BD BD BD. T/A/PT A T T T/SD T/SD. 1 Multi-family dwellings: M/Single-family houses: S; 2 Pressurization method: BD/Tracer gas decay method: TG/Software simulation: S; 3 Thermography: T/Anemometer: A/Pitot tube: PT/Smoke detector: SD.. In the south of Italy, an experimental study [4] was carried out in 20 residential buildings of different periods (1810–2010), climatic zones, and typologies (cottages, terraced houses, apartments, and large buildings). The study focused on the impact of infiltrations on energy consumption and thermal comfort, analysing the influence of several parameters: net floor area, envelope area, internal volume, typology, type of window frames, and year of construction. Another study in Italy [5] analysed the airtightness of a three-story building of the 1970s recently renovated with six apartments to know the influence of air leakage on energy losses and indoor air quality. Repeated tests sealing different elements revealed the influence of each component on the total infiltration rate. Sfakianaki et al. [6] conducted a study in 20 single-family homes in the Attica area, Greece. Both the tracer gas decay and pressurization methods were used. In this way, the cases were classified into three categories according to EN ISO 13,790 [14] and the influence of different parameters on the global infiltration rate was statistically evaluated. In Coimbra, Portugal [3], four retrofitted and original buildings of the historic centre were studied. Three of them were multi-family buildings and one was a detached house. The objective was to know the air change rate (ACH) of the chosen sample and to establish the minimum ACH to maintain good indoor air quality and acceptable thermal behaviour. Another more extensive testing campaign in Portugal [7] analysed 49 apartments in two social housing neighbourhoods in order to know the relationship between the behaviour of the users of the dwellings and their airtightness and ventilation. One of the neighbourhoods had recently been rehabilitated. Tests were also carried out in an apartment to find out the individual impact of different elements on the airtightness of the whole envelope (window frame, self-regulated air inlets, mechanical extraction in kitchens, fixed air inlets in the laundry, and mechanical fan in the bathroom). A study in Osijek, Croatia, [8] obtained a database with airtightness test results in 58 residential units. The sample was considered representative in terms of year of construction after finding a relationship between the elements of the sample and the statistical data of residential buildings in Croatia. The purpose was to establish a method for predicting the airtightness of the envelope applying neural networks, which has been subsequently validated [15,16]. In Turkey [9], another study was carried out after the detection of problems in dwellings such as inadequate air conditioning and ventilation or condensation. Airtightness tests were conducted.
(3) Energies 2018, 11, 704. 3 of 20. in 52 newly built unoccupied homes to analyse the behaviour of the envelope and to proceed with a possible revision of the regulations. In the case of Spain, only partial studies have been carried out so far to characterize the airtightness of the envelope of the housing stock. None of them has covered the entire geography of the country. The study with the largest number of tests fulfilled was conducted in recently built dwellings in northern Spain [10] to determine the level of infiltration in residential buildings and to establish the determining factors. Also, in northern and central Spain, Meiss and Feijó-Muñoz [11] developed a procedure to evaluate the excess energy consumption caused by air infiltration, analysing 13 homes in residential buildings. The lack of airtightness in Spain was estimated to represent between 10.5% and 25.4% of the energy demand in winter in buildings built under current regulations [17]. Several social housing units in Madrid and Seville were analysed to determine the degree of airtightness and indoor air quality [12]. The sample was chosen paying attention to the representativeness of the architectural and construction typologies used in the period 1940–1980 and presented different degrees of retrofitting of the envelope. The airtightness of the envelope in residential buildings at the beginning of the 21st century in the south of Spain has also been characterized [13]. The selection of cases to be analysed in each building was made with a stratified probabilistic design. The objective of this work is to establish a rigorous and simple methodology in order to carry out a characterization of the envelope of residential buildings in Spain in terms of airtightness, through coordinated testing campaigns. A broad database of 411 cases that collects characterization information and results is being created. In a later phase, the analysis of the data under a unified procedure and criteria will be guaranteed. In this sense, it will be possible to know the impact that different factors have on airtightness, as well as the infiltration rates corresponding to the most widespread constructive solutions in Spain. This methodology has been conceived in such a way that it is easily applicable to other countries that intend to evaluate the energy impact of air leakage of existing buildings. Regulations in Spain The European Directive on the energy performance of buildings [18] is committed to the generalization of nearly-zero energy buildings (nZEB) by 2020. In response to it, many countries have been incorporating limitations in their regulations regarding the airtightness of the envelope [19] since the beginning of the 2000s. However, in Mediterranean countries with a temperate climate, where ventilation has traditionally been done in a natural and manually controlled way, infiltrations have been part of the air supply and have compensated the lack of regulation of specific controlled ventilation systems [13]. In Spain, after the oil energy crisis in the 70s, the building regulations NBE-CT-79 [20], relating to thermal conditions of buildings, tended to increase thermal insulation, achieving an improvement in the energy performance of buildings. NBE-CT-79 also affected indoor air quality as a consequence of the lack of ventilation. To give an answer to this problem, in 2006 regulations of the Technical Building Code (CTE) DB HS3 [21] were approved. This document implemented specific ventilation requirements and proceedings to ensure adequate indoor air quality, establishing minimum ventilation flows. The current version of the CTE [21], in spite of not contemplating a minimum requirement of global airtightness of the envelope, gives the option to consider the equivalent infiltration area as part of the ventilation opening area. In this way, using technical specifications tables or minimum values of airtightness established for each type of window (Table 2) it is possible to adjust the required flow rates. However, the obtaining of a precise value for the entire enclosure considering not only the airtightness of its elements separately, but also the encounters of each solution, would be necessary. In any case, the lack of knowledge of airtightness values results in the oversizing of the ventilation systems..
(4) Energies 2018, 11, 704. 4 of 20. Table 2. DB HE1: Limitation of the energy demand [22]: maximum air permeability values of the windows of the thermal envelope by winter climate zone 1 . Parameter Window air permeability 1. Zone α 2. (m3 /h·m2 ). ≤50. 3. Zone A. Zone B. ≤50. ≤50. Zone C. Zone D. Zone E. ≤27. ≤27. ≤27. 2. Zones A, B, C, D and E refer to Continental Spain. Zone α refers to Canary Islands. Airtightness measured with 100 Pa overpressure. 3 The values correspond to the window classification established in the EN 12207 [23]: class 1 (≤50 m3 /h·m2 ) and class 2 (≤27 m3 /h·m2 ).. 2. Methodology 2.1. Sampling Given the impossibility of testing and characterizing each home in the Spanish residential stock, sampling has been used, selecting a set of elements (sample), from which to extrapolate the results and establish statements. In this sense, the maximum representativeness of the sample has been ensured in order to characterize the existing housing stock in Spanish geography in the most reliable way. In the theoretical framework, the best way to estimate a relevant statistical distribution would be to analyse cases in a random sample of buildings in Spain that would ensure the representativeness of the sample [24]. However, taking into account the objectives and characteristics of the present study, a more realistic and efficient approach has been considered, proposing a non-probabilistic quota sampling scheme. The sample reproduces the population on a smaller scale, ensuring the heterogeneity and proportionality of the selected cases. The problem of this methodology lies mainly in the possibility of bias in the sample when the cases are selected in a very specific environment. The appropriate measures to avoid it have been taken. It is also necessary to indicate that sampling errors cannot be estimated because the probability of each case being selected is unknown [25]. 2.1.1. Parameters The Spanish residential stock has been stratified into subgroups (strata) according to a series of control variables. In order to define relevant control variables, a review of previous studies that have established predictive airtightness models in residential buildings [26] has been used. It is deduced that one of the variables with greater relevance is the year of construction [27–30]. Also, characteristics of the building such as typology [31], type of construction [30], type of window/glazing [15] and window frame [6,32], foundation [28], construction system [33], materials [15,24,32,34], floor area [28], total height [28], number of storeys [33], ventilation system [35,36], type of insulation [30] and sealing devices [34], and management type [31] should be considered. In addition, the execution also seems to be a relevant factor in the airtightness of the envelope [36,37]. Several authors have also considered that the climatic zone is a variable to consider [28,38]. There are many factors that have an impact on airtightness. However, in order to be considered as control variables for sampling, its distribution must be known. Finally, the year of construction, typology, and climatic zone have been taken as control variables for the sampling, given their relevance. The impact on the infiltration rate generated by the other parameters will be evaluated afterwards, during the data analysis phase. The year of construction is relevant for several aspects. First, materials and joints deteriorate over time [39]. A 10–15% increase in the infiltration rate has been estimated every 10 years [40,41]. Second, construction systems are evolving and improving, although in countries with temperate climates where there are no regulations that limit the infiltration rate, the most recent buildings are not necessarily the most airtight [2]. Third, the year of construction is linked to the regulations in force at each moment, which establishes the requirements and conditions of the construction systems. A total of 10 groups have been determined by periods, based on statistical sources [42]. Regarding the typology, a distinction has been made between single-family and multi-family dwellings, which represent more than 70% of the residential stock in Spain [40]..
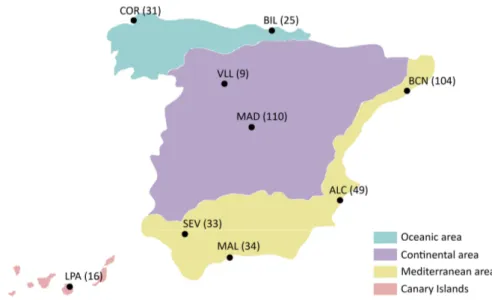
(5) Second, construction systems are evolving and improving, although in countries with temperate climates where there are no regulations that limit the infiltration rate, the most recent buildings are not necessarily the most airtight [2]. Third, the year of construction is linked to the regulations in force at each moment, which establishes the requirements and conditions of the construction systems. A total of 10 groups have been determined by periods, based on statistical sources [42]. Energies 2018, 11, 704 5 of 20 Regarding the typology, a distinction has been made between single-family and multi-family dwellings, which represent more than 70% of the residential stock in Spain [40]. The climatic zone also also has on airtightness. The climatic zone has aa significant significant impact impact on airtightness. Buildings Buildings located located in in cold cold climates climates tend to to be be more more airtight airtight than than others others located located in in temperate temperate climates climates [41]. [41]. Climatic only tend Climatic zones zones do do not not only affect weather conditions, but they can also establish differences in regulatory requirements or affect weather conditions, but they can also establish differences in regulatory requirements or different different construction systems [28]. A simplification of the climatic zones Spain has been made, construction systems [28]. A simplification of the climatic zones in Spain hasinbeen made, obtaining a obtaining a total of Continental, four zones: Continental, Oceanic, Mediterranean, Canary Islands total of four zones: Oceanic, Mediterranean, and Canary and Islands (Figure 1). (Figure 1). The number number of according to to the the The of cases cases belonging belonging to to each each stratum stratum has has been been made made proportionally, proportionally, according statistical distribution stratified representation representation of the statistical distribution of of the the housing housing stock stock in in Spain Spain [42]. [42]. This This way, way, aa stratified of the population is obtained. population is obtained.. Figure 1. Considered climate zones in Spain, location of the participant Universities, and size of the sample of each of them.. 2.1.2. Size and Distribution of the Sample Once the control variables were defined, stratification defined, the number of cases to be analysed and the stratification of the population is carried The size of the sample depends on three variables: carried out. out. The variables: the level of confidence, the the variance, variance,and andthe themargin marginofof error that is considered acceptable Statistically, error that is considered acceptable [43].[43]. Statistically, the the Spanish residential stock is considered an infinite population. This means that the size of the Spanish residential stock is considered an infinite population. This means that the size of the sample sample will be determined by the following Equation (1): will be determined by the following Equation (1):. Z2 σ σ2 Z nn0 == e2 e. (1) (1). where: where: n0: sample size (number of dwellings to be studied) n samplevalue, size (number of dwellings to be studied) Z:0 :critical depending on the confidence level Z: critical value, depending on the confidence level σ: population standard deviation (unknown value in Spain) σ: population standard deviation (unknown value in Spain) e: margin of error The value of Z is given by the Gaussian distribution, depending on the level of confidence accepted. The most frequent values are Z = 1.645, Z = 1.96 and Z = 2.575, for confidence levels of 90%, 95% and 99% respectively. The value of the variance in terms of the airtightness of the envelope in Spain is an unknown value, since there is still no representative data in this regard. Values obtained in a study carried out in Italy were taken as reference, by proximity, constructive, and climatic analogy [44]. The study carried out analysed 20 cases of several typologies and year of construction, resulting from the air change rates values at 50 Pa (n50 ) a variance of 17.584..
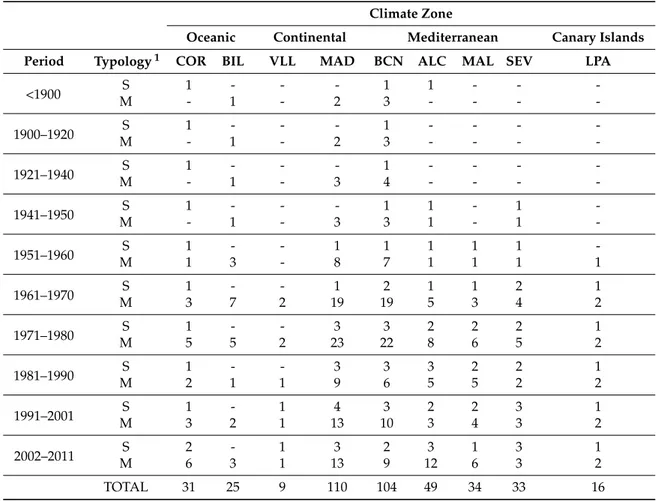
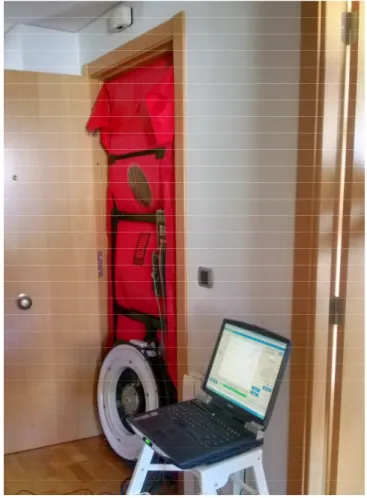
(6) Energies 2018, 11, 704. 6 of 20. Taking into account that a higher level of confidence or a minor admissible error significantly increases the sample size and that the number of cases to be analysed is conditioned by the purpose of the study, the availability of resources, and the time limitation, a confidence level of 95% and an error of ±0.4 have been considered acceptable, resulting in a sample size of 423 cases. This figure has finally been reduced to 411 due to numerical rounding in the stratification process. The distribution of the samples and their location are detailed in Table 3 and in Figure 1. Table 3. Distribution of the sample. Climate Zone Oceanic. Continental. Mediterranean. Canary Islands. Period. Typology 1. COR. BIL. VLL. MAD. BCN. ALC. <1900. S M. 1 -. 1. -. 2. 1 3. 1 -. -. -. -. 1900–1920. S M. 1 -. 1. -. 2. 1 3. -. -. -. -. 1921–1940. S M. 1 -. 1. -. 3. 1 4. -. -. -. -. 1941–1950. S M. 1 -. 1. -. 3. 1 3. 1 1. -. 1 1. -. 1951–1960. S M. 1 1. 3. -. 1 8. 1 7. 1 1. 1 1. 1 1. 1. 1961–1970. S M. 1 3. 7. 2. 1 19. 2 19. 1 5. 1 3. 2 4. 1 2. 1971–1980. S M. 1 5. 5. 2. 3 23. 3 22. 2 8. 2 6. 2 5. 1 2. 1981–1990. S M. 1 2. 1. 1. 3 9. 3 6. 3 5. 2 5. 2 2. 1 2. 1991–2001. S M. 1 3. 2. 1 1. 4 13. 3 10. 2 3. 2 4. 3 3. 1 2. 2002–2011. S M. 2 6. 3. 1 1. 3 13. 2 9. 3 12. 1 6. 3 3. 1 2. 31. 25. 9. 110. 104. 49. 34. 33. 16. TOTAL 1. MAL SEV. LPA. S are single-family houses and M multi-family or apartment buildings.. 2.2. Tests Assessment 2.2.1. Testing Method The evaluation of the leakages is carried out in accordance with EN 13829 standard [45], used for the determination of air permeability of buildings by the fan pressurization method, commonly known as Blower door test (Figure 2). There are other measurement techniques such as the tracer gas method, which is more accurate but requires well-trained experts and also higher costs [3]. The blower door test has been considered the most appropriate technique because it is simpler and comparatively inexpensive. The generation of a high-pressure differential (50 Pa) is sufficient to mitigate the wind and temperature action on the envelope. In this sense, it is reasonably accurate and reproducible [2]. In return, the envelope is subjected to an unreal situation, because the average pressure differential under normal environmental circumstances is around 1–4 Pa. Measurement sets are made both for pressurization and depressurization, in the internal volume of the deliberately conditioned space of the house. In the case of apartment buildings, in which part of.
(7) but requires well-trained experts and also higher costs [3]. The blower door test has been considered the most appropriate technique because it is simpler and comparatively inexpensive. The generation of a high-pressure differential (50 Pa) is sufficient to mitigate the wind and temperature action on the envelope. In this sense, it is reasonably accurate and reproducible [2]. In return, the envelope is subjected to an unreal situation, because the average pressure differential under normal environmental Energies 2018, 11, 704 circumstances is around 1–4 Pa. 7 of 20 Measurement sets are made both for pressurization and depressurization, in the internal volume of the deliberately conditioned space of the house. In the case of apartment buildings, in which part the envelope is in contact with other or unconditioned spaces different fromfrom the outdoor of the envelope is in contact withconditioned other conditioned or unconditioned spaces different the outdoor the air permeability of eachisdwelling is measured individually. Dividing walls and space, the airspace, permeability of each dwelling measured individually. Dividing walls and horizontal horizontal partitions to adjacent spaces areto considered be envelope. part of the It envelope. must be taken partitions to adjacent spaces are considered be part oftothe must beIttaken into account, into account, though, that there are air inlets with different environmental conditions [11]. Thus, though, that there are air inlets with different environmental conditions [11]. Thus, envelope areas from different conditions are measured in a differentiated way. Technical and from envelope different areas conditions are measured in a differentiated way. Technical and operational limitations operational limitations do not allow addressing more accurate approaches like the pressure do not allow addressing more accurate approaches like the pressure equalization method [46]. equalization method [46].. Figure 2. Blower door system.. Figure 2. Blower door system.. Through an automated test using the software provided by the blower door manufacturer (TECTITE Express), a total of 10 data points measured, with increments of 6 Pa door in the manufacturer range 11– Through an automated test using the were software provided by the blower 65 Pa. Express), a total of 10 data points were measured, with increments of 6 Pa in the range (TECTITE. 11–65 Pa. The infiltration curve is calculated according to the power law equation (Equation (2)), based on the fundamental mechanics airflow, to establish the relationship between the fan flow (qenv ) and the building pressure difference (∆p): Venv = Cenv (∆pn ) (2) where: Venv : air flow rate through the envelope of the dwelling (m3 /h) Cenv : air flow coefficient, which is related to the size of the opening (m3 /(h·Pan )) ∆p: induced pressure difference (Pa) n: pressure exponent The pressure exponent n provides an indication of the flow regime. It has the limiting values of 0.5 and 1 [2]. On the one hand, when n is closer to 0.5, the flow regime is turbulent and leakage.
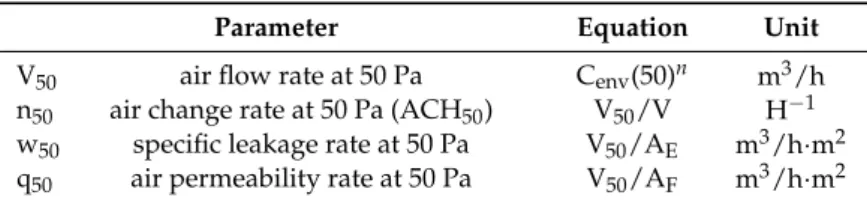
(8) Energies 2018, 11, 704. 8 of 20. paths are expected to be large, short leaks. On the other hand, when the exponent is closer to 1, the flow is laminar and long-path leaks are expected. Typical flow exponent values range between 0.6 and 0.7 [47]. Two procedures are carried out by Methods A (testing of a building in use) and B (testing of the building envelope), as described in standard EN 13829 [45], taking into account the different preparations of the building that each method requires (Table 4). Table 4. Preparation of the building envelope for Methods A and B. Openings on the Envelope. Method A. Terminal devices of mechanical ventilation or air conditioning systems Terminal devices of mechanical ventilation or air conditioning systems Heating systems with indoor air intake Natural ventilation with adjustable openings Natural ventilation without adjustable openings Exhaust openings Enclosed fireplaces Open fireplaces Plumbing overflows and drains (without traps) Water traps in plumbing Cupboards and closets doors Exterior windows and doors Interconnecting doors. } } ⊗ ⊗ # ⊗ ⊗ # # ⊗ ⊗ #. # open position; ⊗ close position; } sealed position; filled position.. Method B. } } } } } } } } /} /} ⊗ ⊗ #. The parameters obtained from the power law, defined in the EN 13829 standard [45] that allow the comparison of results in different buildings (Table 5) are listed below: Table 5. Parameters obtained from the power law. Parameter V50 n50 w50 q50. air flow rate at 50 Pa air change rate at 50 Pa (ACH50 ) specific leakage rate at 50 Pa air permeability rate at 50 Pa. Equation. Unit. Cenv (50)n V50 /V V50 /AE V50 /AF. m3 /h H−1 3 m /h·m2 m3 /h·m2. V (m3 ): internal volume. Volume of air inside the measured building, calculated by multiplying the net floor area by the ceiling height. The volume of the furniture is not subtracted. AE (m2 ): envelope area. Total area of walls, floors, and ceilings bordering the internal volume subject to the test. AF (m2 ): net floor area. Total floor area of all floors belonging to the internal volume subject to the test.. Additionally, two parameters are considered:. •. •. EqLA (10 Pa): equivalent leakage area—National Research Council (NRC) of Canada Model (cm2 ). It is defined as the area of a sharp-edged orifice that would leak the same amount of air as the building does at a pressure of 10 Pa [48]. ELA (4 Pa): effective leakage area—Lawrence Berkeley Laboratories Model (LBNL) (cm2 ). It is defined as the area of a special nozzle-shaped hole that would leak the same amount of air as the building does at a pressure of 4 Pa.. During the depressurization stage, leakage points were identified by thermography (Figure 3). However, due to the climatological conditions of the areas where the tests were carried out, a large thermal gradient to allow thermographic observation was not always expected. In these cases, thermography will be replaced by the use of smoke generators. For the assessment of the tests, a common protocol based on the standard [45] has been developed, which specifies the correct execution of the experimental procedures and data capture, in such a way that all the cases are analysed in a systematic and uniform way..
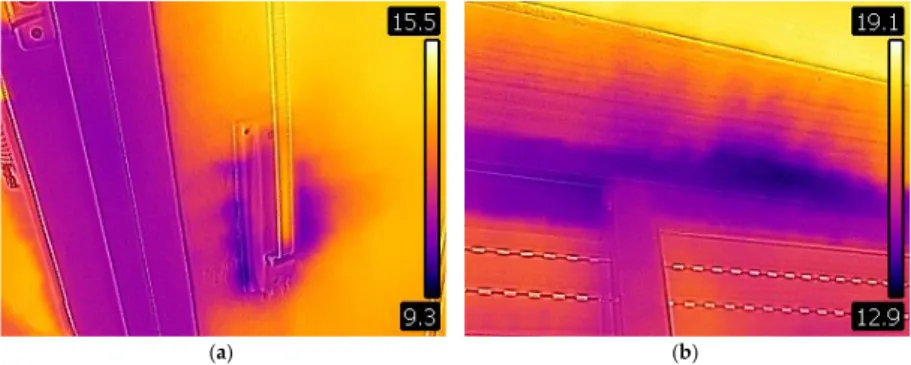
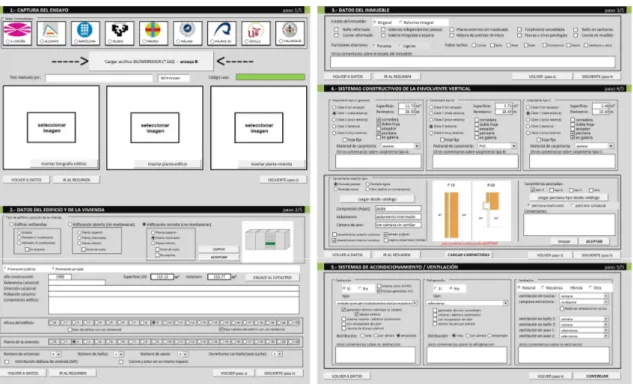
(9) defined as the area of a special nozzle-shaped hole that would leak the same amount of air as the building does at a pressure of 4 Pa. During the depressurization stage, leakage points were identified by thermography (Figure 3). However, due to the climatological conditions of the areas where the tests were carried out, a large thermal gradient to allow thermographic observation was not always expected. In these cases, thermography will be replaced by the use of smoke generators. Energies 2018, 11, 704 For the assessment of the tests, a common protocol based on the standard [45] has been developed, which specifies the correct execution of the experimental procedures and data capture, in such a way that all the cases are analysed in a systematic and uniform way.. (a). 9 of 20. (b). Figure 3. Usual leakage paths detected with thermography. (a) Leakage path at the strap coilers of. Figure 3. Usualrolling leakage paths detected with thermography. (a) Leakage path at the strap coilers of shutters; (b) Leakage path at window joints. rolling shutters; (b) Leakage path at window joints. 2.2.2. Software Development for Data Gathering A specific tool has been developed to store all the data from each case, “infil-APP” (Figures 4– 2.2.2. Software 7). Development for Data Gathering A wide characterization of different parameters, up to a total of more than 140, are stored in a tabulated way, detailed in Table 6. The application has been conceived to allow a simple, fast, and. A specific intuitive tool has been developed to store all the data from each case, “infil-APP” (Figures 4–7). operation. Its structure is in accordance to the testing process, so that technicians only need A wide characterization different parameters, to to a total ofthe more 140, stored to follow theof steps. The information needed inup order perform test isthan gathered in are advance, so in a tabulated that the minimum time is spent on site. way, detailed in Table 6. The application has been conceived to allow a simple, fast, and intuitive The first stage is completed before the test performance and comprises data of the technicians operation. Its structure is in accordance to the testing process, so that technicians only and the owner, responsible university, location, and year of construction of the dwelling (Figure 4). need to follow code is automatically generated for each which allows personal data protection the the steps. The Ainformation needed in order tocase, perform the test is gathered in and advance, so that the identification of each case. Dimensions are also gathered at this stage whenever graphical minimum timedocumentation is spent onofsite. the dwelling is available. Otherwise, simple floor plans are sketched on site in order to obtain the required information. Dimensions such as floor area F), volume (V), envelope areatechnicians and The first stage is completed before the test performance and(Acomprises data of the (AE), or shape factor (Sf) are automatically calculated from partial dimensions. In order to guarantee the owner, responsible university, location, and year of construction of the dwelling (Figure 4). A code suitable meteorological conditions limited by EN 13829 standard [45], weather forecast at the date, and of the test iswhich also introduced. the wind speed exceeds 6 m/s, “infil-APP” is automaticallyexpected generated fortime each case, allowsIfpersonal data protection and the identification does not allow one to continue to further steps and the test needs to be postponed. of each case. Dimensions are also gathered at this stage whenever graphical documentation of the dwelling is available. Otherwise, simple floor plans are sketched on site in order to obtain the required information. Dimensions such as floor area (AF ), volume (V), envelope area (AE ), or shape factor (Sf) are automatically calculated from partial dimensions. In order to guarantee suitable meteorological conditions limited by EN 13829 standard [45], weather forecast at the expected date, and time of the test is also introduced. If the wind speed exceeds 6 m/s, “infil-APP” does not allow one to continue to further steps and the test needs to be postponed. Energies 2018, 11, x FOR PEER REVIEW. 10 of 20. Figure 4. Screenshots of “infil-APP”. Previous Data. Figure 4. Screenshots of “infil-APP”. Previous Data.. The second stage is the characterization of the case (Figure 5). It is done during the visit to the dwelling. Pictures of the exterior, each room, windows, systems, special features, and cracks or other pathologies detected are taken. General information about the dwelling, construction systems, and conditioning and ventilation systems are saved in “infil-APP”. A catalogue of preset typical construction solutions in Spain has been developed (Figure 6),.
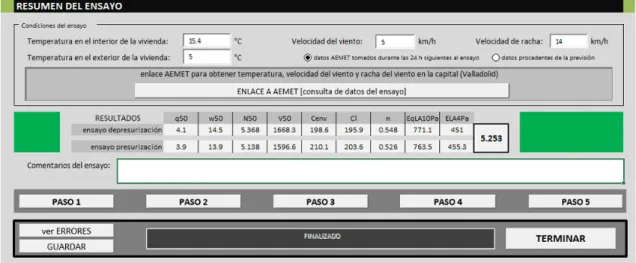
(10) Energies 2018, 11, 704. Figure 4. Screenshots of “infil-APP”. Previous Data.. 10 of 20. The second stage is the characterization of the case (Figure 5). It is done during the visit to the The second stage is the characterization of the case (Figure 5). It is done during the visit to dwelling. Pictures of the exterior, each room, windows, systems, special features, and cracks or other the dwelling. Pictures of the exterior, each room, windows, systems, special features, and cracks or pathologies detected are taken. General information about the dwelling, construction systems, and other pathologies detected are taken. General information about the dwelling, construction systems, conditioning and ventilation systems are saved in “infil-APP”. and conditioning and ventilation systems are saved in “infil-APP”. A catalogue of preset typical construction solutions in Spain has been developed (Figure 6), A catalogue of preset typical construction solutions in Spain has been developed (Figure 6), paying paying attention to singular elements such as shutters. Nevertheless, customized solutions are also attention to singular elements such as shutters. Nevertheless, customized solutions are also possible to possible to introduce. The retrofitting state of each case has been considered in detail due to its introduce. The retrofitting state of each case has been considered in detail due to its decisive relevance. decisive relevance.. Figure 5. Screenshots of “infil-APP”. Characterization of the case. Figure 5. Screenshots of “infil-APP”. Characterization of the case.. Energies 2018, 11, x FOR PEER REVIEW. 11 of 20. Figure 6. Catalog of preset typical façade and rolling shutters in Spain. Figure 6. Catalog of preset typical façade and rolling shutters in Spain.. Once the pressurization test is performed, tests results are imported into “infil-APP”, together with environmental conditions details during the test (Figure 7). As soon as the case is completed, it is automatically uploaded to the cloud server, ready to be reviewed by the coordinating university (VLL) and geolocated in an interactive map. A full report and a test certificate are automatically obtained..
(11) Energies 2018, 11, 704. Figure 6. Catalog of preset typical façade and rolling shutters in Spain.. 11 of 20. Once the pressurization test is performed, tests results are imported into “infil-APP”, together Once the pressurization test is performed, tests results are imported into “infil-APP”, together with environmental conditions details during the test (Figure 7). As soon as the case is completed, it with environmental conditions details during the test (Figure 7). As soon as the case is completed, it is is automatically uploaded to the cloud server, ready to be reviewed by the coordinating university automatically uploaded to the cloud server, ready to be reviewed by the coordinating university (VLL) (VLL) and geolocated in an interactive map. A full report and a test certificate are automatically and geolocated in an interactive map. A full report and a test certificate are automatically obtained. obtained.. Figure 7. Screenshots of “infil-APP”. Results and environmental conditions. Figure 7. Screenshots of “infil-APP”. Results and environmental conditions. Table 6. Parameters that the tool “infil-APP” retains. Table 6. Parameters that the tool “infil-APP” retains. 1. PREVIOUS DATA. 1. PREVIOUS DATA General information General information Participating University. Participating University Name, phone and email address of the. Name, phone and email address owner of the owner Bar code. Bar code. Name, phone and email. Name, phone and email address of technician. Name, phone and email1address2of address of technician technician 1. Name, phone and email address of technician 2. Year of construction. Cadastral reference. Full address of the case. Planned test date. Year of construction. Full address of the case. Cadastral reference Planned test date. Dimensions of the dwelling. Dimensions of the dwelling Global ceiling Global ceilingheight height. Floor area and ceiling. Floor area and ceiling height of Presence of false ceilings Presence of false ceilings eachheight roomof each room. AF (m2 ), automatically calculated. V. Horizontal AE by adjacent space (exterior, heated space, unheated space, other use, ground). AE (m2 ), automatically calculated. (m3 ),. automatically calculated. Vertical AE by adjacent space (exterior, heated space, unheated space, other building, other use, ground) Sf (h−1 ), automatically calculated. Expected weather conditions during the test Altitude. Temperature. Wind speed. Wind speed according to Beaufort scale. Wind exposure. Time. Exterior image of the building. Thermographic image. 2. CHARACTERIZATION DATA Graphic information Floor plan.
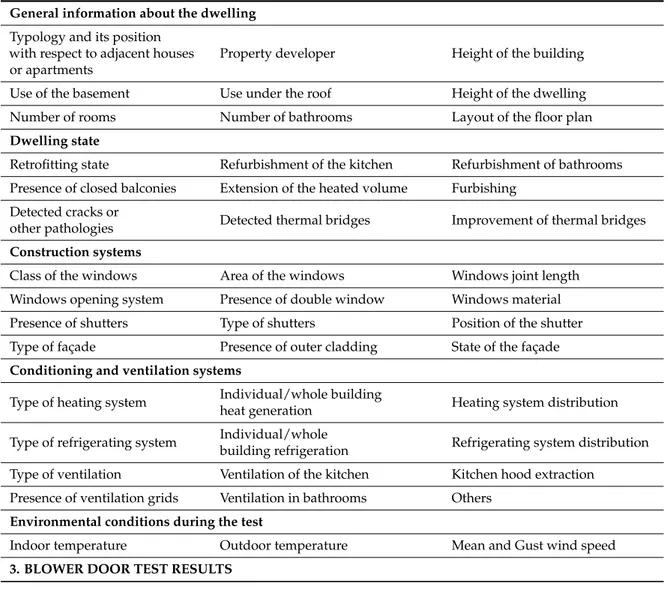
(12) Energies 2018, 11, 704. 12 of 20. Table 6. Cont. General information about the dwelling Typology and its position with respect to adjacent houses or apartments. Property developer. Height of the building. Use of the basement. Use under the roof. Height of the dwelling. Number of rooms. Number of bathrooms. Layout of the floor plan. Retrofitting state. Refurbishment of the kitchen. Refurbishment of bathrooms. Presence of closed balconies. Extension of the heated volume. Furbishing. Detected cracks or other pathologies. Detected thermal bridges. Improvement of thermal bridges. Class of the windows. Area of the windows. Windows joint length. Windows opening system. Presence of double window. Windows material. Presence of shutters. Type of shutters. Position of the shutter. Type of façade. Presence of outer cladding. State of the façade. Dwelling state. Construction systems. Conditioning and ventilation systems Type of heating system. Individual/whole building heat generation. Heating system distribution. Type of refrigerating system. Individual/whole building refrigeration. Refrigerating system distribution. Type of ventilation. Ventilation of the kitchen. Kitchen hood extraction. Presence of ventilation grids. Ventilation in bathrooms. Others. Environmental conditions during the test Indoor temperature. Outdoor temperature. Mean and Gust wind speed. 3. BLOWER DOOR TEST RESULTS. The development of the protocol and the software described allow the performance of standardized tests and data systematization that enables results interpretation. Its extended use would allow the construction of a single national database developed by multiple agents. Besides, its basis is replicable in other scenarios, such as other areas with a lack of knowledge on this field, or countries that do not count on a standardized database. 2.2.3. Test Campaigns A total of nine universities (Figure 1) participated in the characterization and testing of the required cases. To this end, testing campaigns have been organized throughout 2016 and 2017, taking into account the number of cases assigned to each site and paying special attention to the expected climatic conditions, given that the EN 13829 standard [45] determines limitations with respect to the wind during the test. Each site consisted of a coordinator and one or two teams of technicians, with a total of 11 teams to cover the field work. These teams were trained before the campaigns to ensure proper compliance with the developed protocol. A common cloud server was created to allow constant data transfer and supervision from the coordinating University (VLL). In order to obtain access to the dwellings required in the sampling, dissemination campaigns and search for volunteers through leaflets, posters and advertisements on the websites of participating universities and social networks were designed. Agreements with public administrations were established, which allowed access to a number of cases for the study..
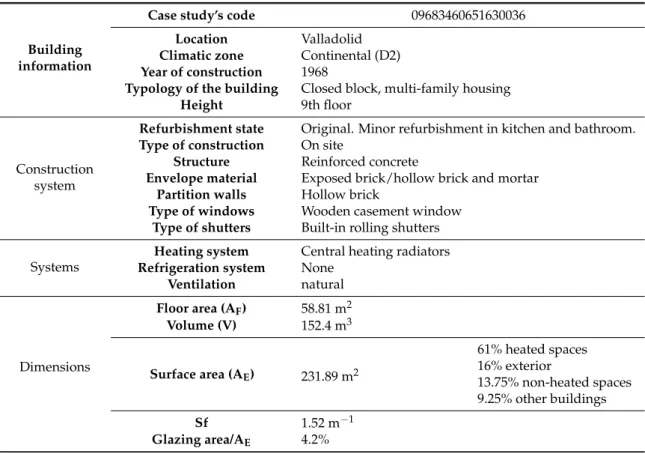
(13) A total of nine universities (Figure 1) participated in the characterization and testing of the required cases. To this end, testing campaigns have been organized throughout 2016 and 2017, taking into account the number of cases assigned to each site and paying special attention to the expected climatic conditions, given that the EN 13829 standard [45] determines limitations with respect to the wind during the test. Each site consisted of a coordinator and one or two teams of technicians, with a total of 11 teams to cover the field work. These teams were trained before the campaigns to ensure proper compliance with the developed protocol. A common cloud server was created to allow Energies 2018, 11, 704 constant data transfer and supervision from the coordinating University (VLL). In order to obtain access to the dwellings required in the sampling, dissemination campaigns and search for volunteers through leaflets, posters and advertisements on the websites of 3. Case Study participating universities and social networks were designed. Agreements with public administrations were established, which allowed access to a number of cases for the study.. 13 of 20. A case study is presented in order to show the implementation of the designed methodology. 3. Case Study An apartment located in the city centre of Valladolid (Figure 8) has been chosen due to its A case study is presented in order to show the implementation of the designed methodology. representativeness of the residential in Spain (case 09683460651630036). An apartment located in thebuilding city centrestock of Valladolid (Figure 8) has been chosen due to its The climate of representativeness of the residentialarea building stockcountry in Spain (case Valladolid belongs to the “Continental” of the and09683460651630036). it is classifiedThe by climate CTE as D2 area. of Valladolid belongs to the “Continental” area of the country and it is classified by CTE as D2 area.. Figure 8. Exterior image of the case study 09683460651630036.. Figure 8. Exterior image of the case study 09683460651630036.. The building was constructed in 1968, before regulations in Spain considering energy losses were implemented. The building consists of 9 floors and an attic. The apartment is on the ninth floor and was has a constructed south orientationin in 1968, its mainbefore façade to Padilla Street and a secondary façade to a wide building regulations in Spain considering energy internal courtyard with east orientation (Figure 9). All the specifics are detailed in Table 7.. The losses were implemented. The building consists of 9 floors and an attic. The apartment is on the ninth floor and Table 7. Case study 09683460651630036 has a south orientation in its main façade to Padilla Street characteristics. and a secondary façade to a wide internal Case study’s courtyard with east orientation (Figure 9). Allcode the specifics are09683460651630036 detailed in Table 7. Location. Valladolid. Climatic zone Continental (D2) Table 7. Case study 09683460651630036 characteristics. Building information Year of construction. Typology of the building. Case study’s code Height Building information. Location Climatic zone Year of construction Typology of the building Height. 1968. Closed block, multi-family housing 9th floor. 09683460651630036. Valladolid Continental (D2) 1968 Closed block, multi-family housing 9th floor. Construction system. Refurbishment state Type of construction Structure Envelope material Partition walls Type of windows Type of shutters. Original. Minor refurbishment in kitchen and bathroom. On site Reinforced concrete Exposed brick/hollow brick and mortar Hollow brick Wooden casement window Built-in rolling shutters. Systems. Heating system Refrigeration system Ventilation. Central heating radiators None natural. Floor area (AF ) Volume (V) Dimensions. 58.81 m2 152.4 m3. Surface area (AE ). 231.89 m2. Sf Glazing area/AE. 1.52 m−1 4.2%. 61% heated spaces 16% exterior 13.75% non-heated spaces 9.25% other buildings.
(14) Dimensions. Surface area (AE). 231.89 m2. 16% exterior 13.75% non-heated spaces 9.25% other buildings. Sf Energies 2018, 11, 704. 1.52 m. −1. Glazing area/AE. 4.2%. 14 of 20. Figure 9. Floor plan of the dwelling.. 3.1. Results Results and and Discussion Discussion 3.1. In order order to to measure measure the the airtightness airtightness of of the the dwelling, dwelling, blower blower door door tests tests are are carried carried out out with with an an In automated performance testing system and following the project protocols (Figure 10). Tests were automated performance testing system and following the project protocols (Figure 10). Tests were carried out out in in February February 2017 2017 with with the 8. Test results are are carried the environmental environmental conditions conditions described described in in Table Table 8. Test results Energies 2018, 11, x FOR PEER REVIEW 15 of 20 detailed in in Table Table 9. 9. detailed. (a) Figure 10. Cont..
(15) Energies 2018, 11, 704. 15 of 20. (a). (b) Figure 10. 10. Automated Automated test test graph. graph. (a) (a) graph graph for for Method Method A; A; (b) (b) graph graph for for Method Method B. B. Figure Table 8. Meteorological conditions during the test. Table 8. Meteorological conditions during the test.. Test Method T i (°C) To◦(°C) ΔT◦(°C) Wa (m/s) Wg (m/s) Wmax (m/s) ◦. Test Method. A A B B. Ti ( C). 20.1 20.1 20 20. To ( C). 7 7 11.2 11.2. ∆T ( C). 14.1 14.1 8.8 8.8. Wa (m/s). Wg (m/s). 0.55 0.55 0.55 0.55. 2.5 2.5 2.5 2.5. Wmax (m/s). 3 3 33. Ti (°C): indoor air temperature. To (°C): outdoor air temperature. ΔT (°C): indoor/outdoor air. Ti (◦ C): indoor air temperature. To (◦ C): outdoor air temperature. ∆T (◦ C): indoor/outdoor air temperature averageWwind speed. g (m/s): wind speed. Wmax (m/s): temperature Wa (m/s): difference. Wadifference. (m/s): average wind speed. gust W wind speed.gust Wmax (m/s): maximum wind g (m/s): speed allowed. maximum wind speed allowed.. The overall uncertainty in the parameters obtained with the test using standard equipment The overall uncertainty in the parameters obtained with the test using standard equipment remains below 15% in most cases [4,35,45] under calm conditions. remains below 15% in most cases [4,35,45] under calm conditions. The mean air change rate of the dwelling for Method B at 50 Pa (n50) is 4.38 h−−11 and the mean air The mean air change rate of the dwelling for Method B at 50 Pa (n50 ) is 4.38 h and the mean air permeability rate at 50 Pa (q50) is 2.9 m3/m2∙h. permeability rate at 50 Pa (q50 ) is 2.9 m3 /m2 ·h. The exponent n has a typical value close to 0.67. Consequently, the flow is neither fully turbulent The exponent n has a typical value close to 0.67. Consequently, the flow is neither fully turbulent nor dominated by laminar characteristics and the shape of leakage paths cannot be clearly defined. nor dominated by laminar characteristics and the shape of leakage paths cannot be clearly defined. Table 9. Test results for Methods A and B. Test Method. Test Mode. n50 (h−1 ). V50 (m3 /h). q50 (m3 /m2 ·h). W50 (m3 /m2 ·h). n. EqLA (10 Pa) (cm2 ). ELA (4 Pa) (cm2 ). A. depressurization pressurization. 4.422 4.428. 674 674.8. 2.9 2.9. 11.5 11.5. 0.661 0.681. 259.5 251.2. 136.8 130. B. depressurization pressurization. 4.345 4.41. 662.1 672. 2.9 2.9. 11.3 11.4. 0.67 0.664. 251.1 257.5. 131.2 135.3. There is barely any difference between the results obtained for Methods A (test of the building in use) and B (test of the building envelope). This can be explained because there are no mechanical supply or exhaust systems nor adjustable openings. There is only one natural ventilation grid in the kitchen, which was left open for the purposes of Method A and sealed for Method B..
(16) Energies 2018, 11, 704. 16 of 20. 3.2. Comparison of the Results The case study results are compared to preliminary results of 343 buildings tested in the database (Table 10). Building airtightness is expressed by either the air change rate (n50 ) or the air permeability rate (q50 ). As a preliminary analysis of the results, the control variables used to design the sample were studied: climate zone, year of construction, and typology. Figure 11 represents graphically the comparison between the case study results and the database results for Method B concerning dwellings from the same climate zone (Continental), built within the same period (1960–1979) and dwellings with the same typology (multi-family housing). Although there is a wide spread of the values obtained from the database, the mean values according to the chosen parameters do not differ in a meaningful way. It seems clear the fact that significantly better results have been obtained for the case study dwelling than the general trend of the database. According to ISO 13790 [14] the case-study dwelling has a “medium airtightness level”, having a value within the range of 2–5 h−1 . However, the mean n50 value for multifamily dwellings of the database is 7.26 h−1 , which, according to ISO 13790 [14], corresponds to a “low airtightness level”. Table 10. Comparison of results of the case study and the database. Database Cases. Case Study. Chosen Cases. n. Mean n50 (h−1 ). St. dev.. Mean q50 (m3 /m2 ·h). St. dev.. n50 (h−1 ). q50 (m3 /m2 ·h). Complete database Dwellings in the Continental area Dwellings built 1960–1979 Multi-family dwellings. 334 127 121 267. 7.12 6.77 7.18 7.26. 3.29 3.18 3.23 3.28. 5.63 5.50 5.54 5.44. 2.72 2.76 2.63 2.42. 4.38. 2.9. Energies 2018, 11, x FOR PEER REVIEW. 17 of 20. (a). (b). (c). (d). (e). (f). Figure 11. Boxplot of database results compared to the case study results, indicated by the red line. Figure 11. Boxplot of database results compared to the case study results, indicated by the red (a) n50 for Continental climate zone; (b) n50 for dwellings built within the period 1960–1979; (c) n50 for line. (a) n50 for Continental climate zone; (b) n50 for dwellings built within the period 1960–1979; multi-family dwellings; (d) q50 for Continental climate zone; (e) q50 for dwellings built within the (c) n50 for multi-family dwellings; (d) q50 for Continental climate zone; (e) q50 for dwellings built period 1960–1979; (f) q50 for multi-family dwellings. within the period 1960–1979; (f) q50 for multi-family dwellings.. 3.3. Leakages Location To determine infiltration locations and distribution, thermal imaging was undertaken during the depressurization stage. Since there was a great temperature difference between the inside and the outside of the dwelling leakage points were easily visualized. Most leakages were located in window frames and shutter boxes (Figure 12)..
(17) Energies 2018, 11, 704. 17 of 20. When compared to regulations in other European countries, the case study dwelling would (d) (e) (f) comply with UK (q50 < 10 m3 /m2 ·h) and Ireland (q50 < 7 m3 /m2 ·h) or Czech Republic (n50 < 4.5 h−1 ) 1 Figurebut 11. Boxplot of database compared to the case recommendations study results, indicated the red−line. regulations not with Germanresults regulations nor Polish (nby 50 < 3 h ) for new (a) n 50 for Continental climate zone; (b) n50 for dwellings built within the period 1960–1979; (c) n50 for buildings [49]. The comparison with French regulations has not been made since its indicator is multi-family dwellings; (d) q50 for Continental climate zone; (e) q50 for dwellings built within the measured at 4 Pa and a direct translation of the results would not be accurate. period 1960–1979; (f) q50 for multi-family dwellings.. 3.3. Leakages Location 3.3. Leakages Location To determine infiltration locations and distribution, thermal imaging was undertaken during the To determine infiltration locations and distribution, thermal imaging was undertaken during depressurization stage. Since there was a great temperature difference between the inside and the the depressurization stage. Since there was a great temperature difference between the inside and the outside of the dwelling leakage points were easily visualized. Most leakages were located in window outside of the dwelling leakage points were easily visualized. Most leakages were located in window frames and shutter boxes (Figure 12). frames and shutter boxes (Figure 12).. (a). (b). Figure 12. Leakage paths detected with thermography. (a) Leakage path located in a door frame; (b) Figure 12. Leakage paths detected with thermography. (a) Leakage path located in a door frame; Leakage path located in the tape guide of the rolling shutter. (b) Leakage path located in the tape guide of the rolling shutter.. 4. Conclusions 4. Conclusions A methodology has been developed to investigate the airtightness of the architectural envelope A methodology has been developed to investigate the airtightness the architectural envelope of the existing residential stock in Spain through an experimental study of carried out throughout the of Spanish the existing residential stock inaSpain throughquota an experimental studya carried out throughout geography. Considering proportional sampling scheme, representative number ofthe Spanish geography. Considering a proportional quota sampling scheme, a representative number of 411 cases has been selected. In this way it is possible to extrapolate the results to other Spanish residential buildings. The sample includes different typologies, construction years, and climatic zones. The study will allow the creation of an extensive database and the identification of the factors that have a greater impact on airtightness and the infiltration rates of typical constructive solutions. The methodology has been conceived in such a way that it can be applied to other countries where there is no data regarding the airtightness of the envelope in residential buildings. A case study in Valladolid has been presented in order to show an example of the implementation of the methodology. Airtightness results are compared to mean values obtained from the database, considering the control variables used to design the sample: climate zone, year of construction, and typology. Results obtained indicate that the dwelling has a medium airtightness level, significantly higher than the mean values obtained from the database. Leakages at the case study were located mainly around window joints and frames and shutter boxes. Further work will include a deep analysis of the complete dataset obtained during the test campaigns in order to establish infiltration rates for typical Spanish constructive solutions, the impact of different parameters on the envelope permeability, and the impact of infiltrations on the ventilation and energy performance of dwellings..
(18) Energies 2018, 11, 704. 18 of 20. Acknowledgments: This paper presented the methodology under the research project INFILES: Repercusión energética de la permeabilidad al aire de los edificios residenciales en España: estudio y caracterización de sus infiltraciones, funded by the Spanish Ministry of Economy and Competitiveness (ref. BIA2015-64321-R). The work of one of the researchers has been possible thanks to the Strategy of Entrepreneurship and Youth Employment, Sistema Nacional de Garantía Juvenil, an initiative of the Ministry of Employment and Social Security, Government of Spain, and the European Social Fund of the European Union. Author Contributions: Feijó-Muñoz Jesús directed the study; Padilla-Marcos Miguel Ángel and Meiss Alberto conceived and designed the experiments; Poza-Casado Irene designed the sampling method; González-Lezcano Roberto Alonso, Pardal Cristina, Echarri Víctor, Assiego de Larriva Rafael, Fernández-Agüera Jesica, Dios-Viéitez María Jesús, del Campo-Díaz Víctor José and Montesdeoca Calderín Manuel coordinated the field test campaigns from each university; Padilla-Marcos Miguel Ángel developed the tool “infil-APP”. Conflicts of Interest: The authors declare no conflict of interest.. References 1. 2. 3. 4. 5. 6.. 7.. 8. 9. 10.. 11. 12.. 13.. 14.. 15. 16.. Alev, Ü.; Kalamees, T. Field Study of Airtightness of Traditional Rural Houses in Estonia. Proc. CLIMA 2013, 2013, 6882. Sherman, M.H.; Chan, R. Building Airtightness: Research and Practice; Lawrence Berkeley National Laboratory: Berkeley, CA, USA, 2004. Salehi, A.; Torres, I.; Ramos, A. Experimental analysis of building airtightness in traditional residential Portuguese buildings. Energy Build. 2017, 151, 198–205. [CrossRef] D’Ambrosio Alfano, F.R.; Dell’Isola, M.; Ficco, G.; Tassini, F. Experimental analysis of air tightness in Mediterranean buildings using the fan pressurization method. Build. Environ. 2012, 53, 16–25. [CrossRef] Villi, G.; Peretti, C.; Graci, S.; De Carli, M. Building leakage analysis and infiltration modelling for an Italian multi-family building. J. Build. Perform. Simul. 2013, 6, 98–118. [CrossRef] Sfakianaki, A.; Pavlou, K.; Santamouris, M.; Livada, I.; Assimakopoulos, M.N.; Mantas, P.; Christakopoulos, A. Air tightness measurements of residential houses in Athens, Greece. Build. Environ. 2008, 43, 398–405. [CrossRef] Ramos, N.M.M.; Almeida, R.M.S.F.; Curado, A.; Pereira, P.F.; Manuel, S.; Maia, J. Airtightness and ventilation in a mild climate country rehabilitated social housing buildings—What users want and what they get. Build. Environ. 2015, 92, 97–110. [CrossRef] Krstić, H.; Koški, Ž.; Otković, I.I.; Španić, M. Application of neural networks in predicting airtightness of residential units. Energy Build. 2014, 84, 160–168. [CrossRef] Tanribilir, A.; Oskay, R.; Yener, C. Air Leakage Measurements in Dwellings in Turkey. In Symp on Air Change Rate and Airtightness in Buildings; ASTM International: Atlanta, GA, USA, 1990; pp. 165–179. Jiménez Tiberio, A.; Branchi, P. A study of air leakage in resitential buildings. In Proceedings of the 2013 International Conference on New Concepts in Smart Cities: Fostering Public and Private Alliances (SmartMILE), Gijon, Spain, 11–13 December 2013; pp. 1–4. Meiss, A.; Feijó-Muñoz, J. The energy impact of infiltration: A study on buildings located in north central Spain. Energy Effic. 2014, 8, 51–64. [CrossRef] Fernández-agüera, J.; Sendra, J.J.; Suárez, R.; Oteiza, I. Airtightness and indoor air quality in subsidised housing in Spain. In Proceedings of the 36th AIVC Conference ‘Effective Ventilation in High Performance Buildings’, Madrid, Spain, 23–24 September 2015. Fernández-Agüera, J.; Domínguez-Amarillo, S.; Sendra, J.J.; Suárez, R. An approach to modelling envelope airtightness in multi-family social housing in Mediterranean Europe based on the situation in Spain. Energy Build. 2016, 128, 236–253. [CrossRef] ISO 13790:2008. Energy Performance of Buildings—Calculation of Energy Use for Space Heating and Cooling; superseded by ISO 52016-1:2017; International Organization for Standardization: Geneva, Switzerland, 2008; Available online: https://www.iso.org/standard/41974.html (accessed on 1 February 2018). Krstic, H.; Otkovic, I.I.; Todorovic, G. Validation of a Model for Predicting Airtightness of Residential Units. Energy Procedia 2015, 78, 1525–1530. [CrossRef] Krstic, H.; Otkovic, I.I.; Kosinski, P.; Wójcik, R. Validation of neural network model for predicting airtightness of residential and non-residential units in Poland. Energy Build. 2016, 133, 423–432. [CrossRef].
(19) Energies 2018, 11, 704. 17. 18.. 19.. 20.. 21.. 22.. 23.. 24. 25. 26. 27.. 28. 29. 30. 31. 32. 33. 34. 35. 36. 37. 38.. 19 of 20. Ministerio de Fomento del Gobierno de España Código técnico de la Edificación (CTE). Spain, 2017. Available online: https://www.codigotecnico.org/ (accessed on 10 March 2018). (In Spanish) DIRECTIVE 2012/27/EU of the European Parliament and of the Council on energy efficiency; 2012; pp. 1–56. Available online: https://eur-lex.europa.eu/legal-content/EN/TXT/?uri=celex:32012L0027 (accessed on 1 February 2018). Leprince, V.; Moujalled, B.; Litvak, A. Durability of building airtightness, review and analysis of existing studies. In Proceedings of the 38th AIVC Conference Ventilating Healthy Low-Energy Buildings, Nottingham, UK, 13–14 September 2017; pp. 1–14. Ministerio de Fomento del Gobierno de España. Norma Básica de Edificación NBE-CT-79. Condiciones térmicas en los edificios; Spain, 1979. Available online: https://www.codigotecnico.org/ (accessed on 10 March 2018). (In Spanish) Ministerio de Fomento del Gobierno de España. Código técnico de la Edificación (CTE). Documento básico HS 3: Calidad del aire interior. With comments from the Ministry of Development (in Spanish). 2017. Available online: https://www.codigotecnico.org/ (accessed on 10 March 2018). Ministerio de Fomento del Gobierno de España. Código técnico de la Edificación (CTE). Documento básico HE 1: Limitación de la demanda energética (in Spanish). 2017. Available online: https://www.codigotecnico.org/ (accessed on 10 March 2018). EN 12207:2016. Windows and doors. Air Permeability. Classification. 2016. Available online: http://www.en. aenor.es/aenor/normas/normas/fichanorma.asp?tipo=N&codigo=N0058081#.WrDfMNvwa71 (accessed on 1 February 2018). Price, P.N.; Shehabi, A.; Chan, R. Indoor-Outdoor Air Leakage of Apartments and Commercial Buildings; California Energy Commission: Sacramento, CA, USA, 2006. Alaminos Chica, A.; Castejón, J.L. Elaboración, Análisis e Interpretación de Encuestas, Cuestionarios de Escalas de Opinión; Universidad de Alicante Editorial Marfil: Alicante, Spain, 2006; ISBN 8426812678. Bramiana, C.N.; Entrop, A.G.; Halman, J.I.M. Relationships between Building Characteristics and Airtightness of Dutch Dwellings. Energy Procedia 2016, 96, 580–591. [CrossRef] Alev, Ü.; Eskola, L.; Arumägi, E.; Jokisalo, J.; Donarelli, A.; Siren, K.; Broström, T.; Kalamees, T. Renovation alternatives to improve energy performance of historic rural houses in the Baltic Sea region. Energy Build. 2014, 77, 58–66. [CrossRef] Chan, W.R.; Joh, J.; Sherman, M.H. Analysis of air leakage measurements of US houses. Energy Build. 2013, 66, 616–625. [CrossRef] Sinnott, D.; Dyer, M. Air-tightness field data for dwellings in Ireland. Build. Environ. 2012, 51, 269–275. [CrossRef] Montoya, M.I.; Pastor, E.; Carrié, F.R.; Guyot, G.; Planas, E. Air leakage in Catalan dwellings: Developing an airtightness model and leakage airflow predictions. Build. Environ. 2010, 45, 1458–1469. [CrossRef] Pan, W. Relationships between air-tightness and its influencing factors of post-2006 new-build dwellings in the UK. Build. Environ. 2010, 45, 2387–2399. [CrossRef] Zou, Y. Classification of Buildings with Regard to Airtightness; Chalmers University of Technology: Gothenburg, Sweden, 2010. Kalamees, T. Air tightness and air leakages of new lightweight single-family detached houses in Estonia. Build. Environ. 2007, 42, 2369–2377. [CrossRef] Orme, M.; Liddament, M.; Wilson, A. Numerical Data for Air Infiltration and Natural Ventilation Calculations; Air Infiltration and Ventilation Centre: London, UK, 1994; p. 108. Pinto, M.; Viegas, J.; de Freitas, V.P. Air permeability measurements of dwellings and building components in Portugal. Build. Environ. 2011, 46, 2480–2489. [CrossRef] Van Den Bossche, N.; Huyghe, W.; Moens, J.; Janssens, A.; Depaepe, M. Airtightness of the window-wall interface in cavity brick walls. Energy Build. 2012, 45, 32–42. [CrossRef] Relander, T.O.; Bauwens, G.; Roels, S.; Thue, J.V.; Uvsløkk, S. The influence of structural floors on the airtightness of wood-frame houses. Energy Build. 2011, 43, 639–652. [CrossRef] Erinjeri, J.J.; Katz, M.; Witriol, N.M. Empirical Modeling of Air Tightness in Residential Homes in North Louisiana; Case Studies, Statistics, Countries & Datasets; Bentley University: Waltham, MA, USA, 2009; pp. 37–47..
(20) Energies 2018, 11, 704. 39.. 40. 41. 42. 43. 44. 45.. 46. 47. 48.. 49.. 20 of 20. Ylmén, P.; Hansén, M.; Romild, J. Durability of airtightness solutions for buildings. In Proceedings of the 35th AIVC Conference ‘Ventilation and Airtightness in Transforming the Building Stock to High Performance’, Poznan, Poland, 24–25 September 2014. Mcwilliams, J.; Jung, M. Development of a Mathematical Air-Leakage Model from Measured Data; Lawrence Berkeley National Laboratory: Berkeley, CA, USA, 2006. Chan, W.R.; Walker, I.S.; Sherman, M.H. Durable Airtightness in Single-Family Dwellings: Field Measurements and Analysis. Int. J. Vent. 2015, 14, 27–38. [CrossRef] Instituto Nacional de Estadística INEbase. Available online: http://www.ine.es/ (accessed on 19 May 2016). Morales-Vallejo, P. Tamaño necesario de la muestra: Cuántos sujetos necesitamos? Estad. Apl. Cienc. Soccapl. Cienc. Soc. 2012, 24, 20. D’Ambrosio Alfano, F.R.; Dell’Isola, M.; Ficco, G.; Palella, B.I.; Riccio, G. Experimental air-tightness analysis in mediterranean buildings after windows retrofit. Sustainability 2016, 8, 991. [CrossRef] EN 13829:2000. Thermal Performance of Buildings—Determination of Air Permeability of Buildings. Fan Pressurization Method; (ISO 9972:1996, modified); International Organization for Standardization: Geneva, Switzerland, 2000; Available online: https://www.en.aenor.es/aenor/normas/normas/fichanorma.asp? tipo=N&codigo=N0026148&PDF=Si#.WrDgUNvwa70 (accessed on 1 February 2018). DePani, S. A Study in Single BlowerDoor Methods for Multifamily Buildings in Montreal; Concordia University: Montreai, QC, Canada, 1999. Humphreys, M.; Nicol, F. Guide A: Environmental Design; Chartered Institution of Building Services Engineers: London, UK, 2006; ISBN 9780240812243. The Energy Conservatory TECTITE 4.0 (Building Airtightness Test Analyses Program). Software User’s Guide 2012. Available online: https://support.energyconservatory.com/hc/en-us/articles/202778350TECTITE-4-0. (accessed on 1 February 2018). Leprince, V.; Carrié, F.R.; Kapsalaki, M. Building and ductwork airtightness requirements in Europe—Comparison of 10 European countries. In Proceedings of the 38th AIVC Conference Ventilating healthy Low-Energy Buildings, Nottingham, UK, 13–14 September 2017; pp. 192–201. © 2018 by the authors. Licensee MDPI, Basel, Switzerland. This article is an open access article distributed under the terms and conditions of the Creative Commons Attribution (CC BY) license (http://creativecommons.org/licenses/by/4.0/)..
(21)
Figure
+7
Documento similar
So, the engineering data enabled the team to establish that there was interfer- ence in the science data (SQUID output voltage signal) at the spin frequency of the gyros and that
"Fouling Out the American Pastoral: Rereading Philip Roth's The Great American Novel." Upon Further Review: Sports in American Literature.. Michael Cocchiarale and
As regards to the influence of reuse activities within the company, those companies analyzed in this field consider that this activity has supposed the opening and maintaining
Application of learning styles for automatic grouping The results of the case study presented in section 3 seem to indicate that there exist a relationship between the way in
In a similar light to Chapter 1, Chapter 5 begins by highlighting the shortcomings of mainstream accounts concerning the origins and development of Catalan nationalism, and
To verify my second hypothesis, I will again use the hermeneutic approach, to elaborate on ontological, epistemological, and practical considerations regarding the
In the previous sections we have shown how astronomical alignments and solar hierophanies – with a common interest in the solstices − were substantiated in the
We advance the hypothesis that fraudulent behaviours by finan- cial institutions are associated with substantial physical and mental health problems in the affected populations.
