TítuloiTRAQ based analysis of progerin expression reveals mitochondrial dysfunction, reactive oxygen species accumulation and altered proteostasis
17
0
0
Texto completo
(2) Mateos et al. Stem Cell Research & Therapy (2015)6:9. Introduction Mutations in the LMNA gene are the causal agent for a subset of genetic diseases affecting mesoderm tissues called laminopathies [1]. Among these, HutchinsonGilford Progeria Syndrome (HGPS) or progeria [2–4] is a fatal disease with a very low incidence characterized by a typical clinical picture of older pathologies [5]. HGPS-affected patients begin to show symptoms of accelerated aging at the age of 2, and typically die at an average age of 13 years, usually due to cardiovascular deficiencies. HGPS is due, in most cases, to the point mutation G608G in the LMNA gene encoding Lamins A and C, major structural components of the nuclear lamina [6, 7]. Although historically thought to be involved only in nuclear structure, roles in replication, chromatin organization and stem cell differentiation have been demonstrated recently for Lamin A [8, 9]. It is also proposed that Lamin A has a role in reorganization of replication and chromatin [10]. Lamin A is initially produced as a precursor, preLamin A, farnesylated at its C-terminus, and processed by the protease Zmpste24/FACE-1 that removes the farnesylated part. In HGPS, the mutation causes the occurrence of a cryptic alternative processing site, generating a truncated isoform, progerin (PG), lacking the recognition site for Zmpste24/FACE-1. Farnesylated PG does not properly process, accumulates in the nuclear envelope, causes structural defects in the nuclear lamina and may be interfering with regulation of the signalling pathway mediated by p16/Rb necessary to maintain the balance between differentiation and proliferation of stem cells in the tissue regeneration process [8]. Finally, several studies showed the importance of accumulation of the farnesylated precursor in the development of the disease [11–13]. The main function of adipose tissue is to store and manage excess energy in the form of triglycerides and to facilitate the liberation and lipolysis in periods of nutritional deficiency or energy demand [14]. The balance between lipid storage and lipolysis is controlled by neuroendocrine signals [15, 16] in response to the nutritional status of the organism. The hypothalamus has been proposed as the central coordinator of this process, integrating the action of circulating hormones and nutrients [17]. In human lipodystrophies, insulin resistance and loss of regenerative potential in the adipose tissue are the main landmarks [18] leading to complications in normal aging and disease. Also, an extremely accelerated lipodystrophia occurs in progeroid syndromes, such as HGPS and other laminopathies [19, 20]. Our purpose for this study was to unravel the underlying mechanism of PG-driven lipodystrophy using quantitative shotgun proteomics (isobaric tags for relative quantification (iTRAQ)) and to determine the molecular pathways. Page 2 of 17. modulated by the lentiviral expression of this aberrant form of Lamin A in the 3T3L1 pre-adipocyte cell line, one of the most studied models of adipogenic differentiation [21, 22].. Methods Culture of mouse 3T3L1 pre-adipocytes. 3T3L1 cells were kindly donated by María Pardo and Luisa M Seoane (University of Santiago, Spain). Cells were maintained as pre-adipocytes in Dulbecco’s modified Eagle’s medium (DMEM) supplemented with 10 % foetal bovine serum (FBS) and expanded when they reached 70 % confluence. Cloning procedure. Full-length human PG and green fluorescent protein (GFP) cDNAs were amplified by PCR from pBABEpuroGFP-PG and pBABE-puroGFP-Lamin A plasmids (Addgene, donated by Tom Misteli), using the oligonucleotides: EcoRI-LMNA-forward, CCGGAATTCATGG AGACCCCGTCCCAGCGG; BamHI-LMNA-reverse, CG CGGATCCTTACATGATGCTGCAGTTCTG; EcoRI-GF P-forward, CCGGAATTCATGGTGAGCAAGGGCGAG; and BamHI-GFP-reverse, CGCGGATCCTTACTTGTAC ACCTCGTC. GFP, LMNA and PG were cloned into pLVX-puro (Clontech Laboratories Inc., Mountain View, CA, USA) between the EcoRI/BamHI sites following standard cloning procedures. Lentiviral production. The Lenti-X™ Lentiviral expression System (Clontech Laboratories Inc.) was used following the manufacturer’s protocol. One day before transfection, 4 × 10⁶ 293 T producer cells were plate on 100 mm plates in penicillin/streptomycin-free DMEM supplemented with 5 % FBS. The following day, two different calcium-phosphate based transfections were performed in duplicate using LVX-GFP-puro and LVX-PG-puro. The cells were incubated overnight with the transfection mixture, then washed with phosphate-buffered saline (PBS) and incubated with 8 ml fresh complete growth medium. Viral supernatants were collected at 48, 60 and 72 hours following transfection, centrifuged, filtered to remove cell debris and stored at 4 °C until transduction. Transduction of 3T3L1 cells. Target cells were plated in 100 mm plates at 6 × 10⁶ cells per plate. After 1 day, the cells were 70 % confluent. The cells were incubated sequentially with the 48-hour, 60-hour and 72-hour viral supernatants for 12 hours. Following the last transduction, the cells were washed and incubated with fresh growth medium to allow puromycin-resistance expression. Two days later, puromycin selection was performed by incubating the cells in growth media supplemented with 1 μg/ml.
(3) Mateos et al. Stem Cell Research & Therapy (2015)6:9. puromycin (Clontech Laboraties Inc.) for 5 days. After selection, transduced cells were washed and allowed to recover in complete media for 2 days. Proliferation assay. To calculate the proliferation curve, different numbers of cells (0, 1000, 2000, 4000, 8000 and 16,000) were plated in triplicate in 96-well plates and allowed to adhere for 8 hours. The CellTiter 96® AQueous NonRadioactive Cell Proliferation Assay (Promega, Madison, WI, USA) was used to measure absorbance at 490 due to the formation of MTS formazan. For the assay, 2000 cells were plated in triplicate in 96-well plates, and the total cell number was calculated at different time points (2, 4, 6 and 10 days) by extrapolating the correspondent absorbance in the proliferation curve. Adipogenic differentiation. Untransduced and PG-transduced and GFP-transduced 3T3L1 pre-adipocytes were differentiated in DMEM supplemented with 10 % FBS in chamber slides (Millipore, Billerica, MA, USA). Two days after reaching confluence, the medium was supplemented with 10 μg/ ml insulin, 0.5 mM of 3-isobutyl-1-methylxantine and 1 am dexamethasone for 3 days and with 5 μg/ml insulin for a further 6 days. Adipogenic cultures were stained with Oil red O to determine their adipogenic capacity. For staining, the culture plates were fixed in 10 mM sodium periodate, 2 % paraformaldehyde, 75 mM L-lysine dihydrochloride and 37.5 mM dibasic sodium phosphate (Sigma-Aldrich, St. Louis, MO, USA) at pH 7.4 for 15 minutes at room temperature, then air dried and treated with a filtered solution of 0.3 % Oil red O to stain lipid droplets. Protein extraction and preparation procedures. Cells monolayers were grown until a confluence of 70 % in 100 mm plates, and then washed three times with PBS and harvested with a scraper in SDS lysis buffer (20 % glycerol, 500 mM Tris–HCl, pH 6.8 and 10 % sodium dodecyl sulphate). After incubation at 100 °C for 10 minutes and two consecutive cycles of vortexing and sonication, samples were centrifuged at 4 °C for 10 minutes at 11000 × g. Supernatants were then subjected to protein quantification (total protein A 280) in a nanodrop™ 1000 instrument (Thermo Scientific, Waltham, MA, USA). Protein extracts were aliquoted and stored at −80 °C until further analysis. iTRAQ labelling. Equal amounts of proteins from PG-3T3L1 and GFP3T3L1 cells (50 μg) were precipitated with overnight incubation with six volumes of cold acetone at −20 °C, and denatured with 2 % sodium dodecyl sulphate in 1 M. Page 3 of 17. triethylammonium bicarbonate (ABSciex, Foster City, CA, USA). The samples were then reduced for 1 hour at 60 °C using 50 mM tris-(2-carboxyethy) phosphine (ABSciex), and cysteine-blocked with 84 mM iodoacetamide (Sigma-Aldrich) at room temperature in the dark for 30 minutes. The injection volumeThe proteins were digested with spectrometry-grade trypsin (Gold Mass, Promega, Madison, WI, USA) at a concentration of 1:50 trypsin/protein for 16 hours at 37 °C. Each peptide solution was labelled for 1.5 hours at room temperature using the iTRAQ reagents (ABSciex) previously reconstituted in 70 μl ethanol, following the manufacturer’s protocol. The samples were labelled with iTRAQ reagents as follows: control GFP, 115; PG: 117. The reaction was stopped by adding deionized water, and the labelled samples were combined. The mixture was desalted using homemade stage tips. iTRAQ relative quantification by two-dimensional LCMALDI-TOF/TOF analysis. In a first step, the desalted peptides (starting amount of digested peptides: 100 μg) were fractionated by basic reversed-phase extraction in a 1200 HPLC system (Agilent, Wilmington, DE, USA). Sixty fractions, each representing a 90-second elution, were collected along a 110-minute gradient. The fractions were combined in 16 different final fractions depending on their peptide complexity (as revealed by lecture absorbance at 214 nm during the basic reversed-phase separation). The combined fractions were subjected to further acidic reversed-phase extraction in a nanoHPLC system (Tempo; ABSciex) into a C18 silica-based column (New Objective, Woburn, MA, USA) with an internal diameter of 300 Ả. The injection volume was 5 μl, and peptides were eluted during a 90-minute gradient at a constant flow rate of 0.35 μl/minute. Eluting peptides were automatically mixed with alpha-cyano at 4 mg/ml in 70 % acetonitrile, 0.1 % trifluoroacetic acid and deposited on a MALDI LC-plate using a SunCollect (SunChrom, Friedrichsdorf,GE) spotter. The 16 different chromatograms, each composed of 350 spots (15 seconds deposition per spot), were then analysed in a 4800 MALDI-TOF/TOF platform (ABSciex). The 4000 series Explorer v.4.2 software was used to generate the spectra and peak list. After manual deposition of mass calibrants, plate model and default calibration of the MALDI plate was carried out with a laser voltage of 3200 kV and 1000 shots/spectrum. Samples were automatically analysed in MS mode with a laser voltage of 3400 kV and 1500 shots/spectrum. Automated precursor selection was performed using a Job-wide interpretation method (up to 12 precursors/fraction, signal-to-noise lower threshold = 50) excluding trypsin autolytic peptides and other background ions, with a laser voltage of 4200 and.
(4) Mateos et al. Stem Cell Research & Therapy (2015)6:9. 2000 shots/spectrum. The collision induced dissociation (CID) energy range was medium. Liquid chromatography coupled offline to matrixassisted laser desorption ionization–time of flight (LCMALDI-TOF/TOF) data were analysed using ProteinPilot 4.0 software (ABSciex). ProteinPilot search parameters were as follows: sample type, iTRAQ 4-plex; cys-alkylation, iodoacetamide; digestion, trypsin; ID focus, biological modifications; database, NCBI RefSeq-release60 (September 2013) with 41,958,567 entries; species filtering, none; search effort, thorough ID and Detection Protein Threshold Unused ProtScore (Conf ) > 1.3 (95.0 %). The scoring model was defined by the Paragon algorithm. In the case of the high-complexity samples, the false discovery rate was estimated in less than 1 % by doing the searching in parallel against a decoy database using the ‘PSPEP on’ mode (data not shown). Bioinformatics. Biological functional analysis of the different modulated proteins detected by iTRAQ quantification was categorized according to their function, biological process and cellular component, using the String 9.0 software [23]. Measurement of the production of mitochondrial reactive oxygen species. Cells were cultivated in six-well plates in DMEM with 10 % FBS until reaching 70 % confluence, and then washed and incubated for 1 hour with serum-free DMEM. Incubation with 5 μM MitoSox™ (Invitrogen) was done for 10 minutes at 37 °C following the manufacturer’s instructions. Mitochondrial reactive oxygen species (ROS) production was estimated by flow cytometry in a FACSAria instrument (Benton Dickinson, Oxford, UK). The percentage of positive cells was measured for each condition by fluorescent emission at 580 nm. Measurement of the mitochondrial reespiratory chain complex activities. For each condition 10 × 106 cells were collected by trypsinization, washed with PBS, and precipitated at 150 × g for 5 minutes at 4 °C. Digitonin-permeabilized preadipocyte homogenates (10–50 μl/ml test volume) were used to measure the activities of the respiratory chain enzymes and citrate synthase in a DU-650 spectrophotometer (Beckman Instruments, Palo Alto, CA, USA) as described previously [24, 25]. Determination of basal mitochondrial respiration. The rate of oxygen consumption (OCR) was determined by direct measurement in a SeaHorse XFp Extracellular Flux Analyzer instrument (Seahorse Bioscience Inc., Billerica, MA, USA). Then 104 cells per well were seeded. Page 4 of 17. 24 hours prior to the assay in XF cell culture microplates and incubated at 37 °C with 5 % CO2. The next day, the cells were pre-incubated without CO2 for 1 hour and the basal OCR was determined following the manufacturer’s instructions. Immunoblotting procedures. Western blot analysis was performed on 20 μg total protein extracted from cells in culture, as described previously [26]. The antibodies used were mouse Lamin A + C (Acris Antibodies, Acris Antibodies, Barcelone,ES), rabbit calnexin (Santa Cruz Biotech., Santa Cruz, CA, USA), rabbit nucleolin (NCL; Santa Cruz Biotech.), rabbit cytochrome c oxidase (Amersham, Buckinghamshire, UK), rabbit microtubule-associated protein 1 light chain 3 (LC3; MBL, Nagoya, Japan) and mouse tubulin (Sigma). Ideal concentrations for each antibody were determined empirically. Working concentrations were 1:1000 of the stock solutions. Secondary anti-mouse and anti-rabbit antibodies (Amersham) were used to visualize proteins by the ECL™ Western Blotting Analysis System (GE Healthcare, Amersham Biotechnology, Buckinghamshire, UK). Optimal concentrations for each antibody were determined empirically. Blots were digitized using the LAS 3000 image analyser (GE Healthcare). Densitometry analysis of the band intensities was performed using ImageQuant 5.2 software (GE Healthcare). RNA extraction and cDNA synthesis. Total RNA was extracted from cultured cells seeded in six-well plates at a confluence of 70 % using the Trizol L.S. reagent method (Invitrogen). Reverse transcription was done using the Superscript II system (Invitrogen). Then 2 μg total RNA was reverse transcribed in a 20 μl reaction volume containing Superscript II (200 Units), random primers (25 μM) and dNTP (0.5 mM each) at 42 °C for 50 minutes. Real-time RT-PCR analysis. The reported sequences of genes for mouse Lmna (forward, TGAGTACAACCTGCGCTCAC; reverse, CTGT GACACTGGAGGGCAGAA), mouse Ncl (forward, AA GGAGTGAAGCCAGCAAAA; reverse, TCCTCCTCAG CCACACTCTT), mouse Canx (forward, GCCCTAGAG ACTGCTCCAT; reverse, AAAAAGCCTTGTGCTCCA CA), mouse Cox5a (forward, GGAATTGCGTAAAGGG ATGA; reverse, CCAAGATGCGAAGACCACTA) and mouse Hprt (forward, TCCCAGCGTCGTGATTAGCG A; reverse, TGGCCTCCCATCTCCTTCATGAC), as housekeeping, were used for primer design. The amplification program consisted of an initial denaturation at 92 °C for 2 minutes followed by 40 cycles at 92 °C for 15 seconds, annealing at 61 °C for 30 seconds and an.
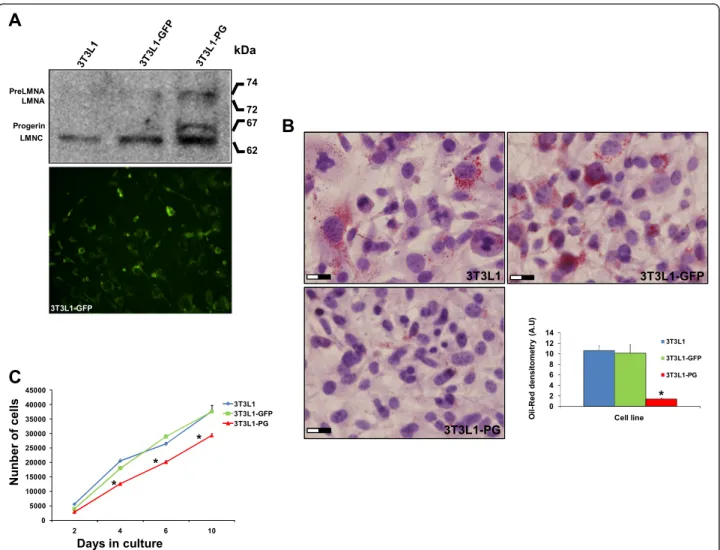
(5) Mateos et al. Stem Cell Research & Therapy (2015)6:9. extension at 72 °C for 15 seconds. Each PCR analysis was done in duplicate, with each set of assays repeated three times. To minimize effects of unequal quantities of starting RNA and to eliminate potential sources of inconsistency, relative expression levels of each gene were normalized to Hprt using the 2–ΔΔCt method [27]. Control experiments contained no reverse transcriptase.. Statistical analysis. All of the experimental data, with the exception of the iTRAQ relative quantification, are presented as the mean, and error bars represent the standard deviation of the mean. Statistical analysis was carried out with R 3.0 (Project for Statistical Computing) using non-parametric methods.. Page 5 of 17. Results Gene delivery by lentiviral transduction and characterization of cell lines. Efficient gene delivery of PG was checked by immunoblotting using an anti-LMNA/C antibody. As shown in Fig. 1a, PG-lentiviral transduction of 3T3L1 pre-adipocytes drives the production of an intermediate molecular weight isoform with a similar size as human PG, as well as an abnormal accumulation of wild-type Lamin A as described previously [28, 29]. The efficiency of the transduction was estimated in more than 80 % by fluorescence microscopy. Proliferation capacity was checked in the three cell lines, showing a significant decrease (p <0.05) in the proliferation rate of PG3T3L1 cells when compared with non-transduced and control GFP-3T3L1 cells. Adipogenic capacity of the. Fig. 1 Characterization of green fluorescent protein (GFP)-expressing and progerin (PG)-expressing 3T3L1 cells. a Efficient gene delivery of PG and GFP was corroborated by immunoblot and fluorescence microscopy, respectively. b Decrease in the proliferation rate of PG-3T3L1 cells when compared with GFP-3T3L1 and non-transduced cells. c Defective adipogenic potential of PG-3T3L1 cells when compared with GFP-3T3L1 and non-transduced cells, as revealed by Oil-red staining. *Significance (p <0.05) using the Kruskal–Wallis non-parametric test. Scale bar = 20 μm.
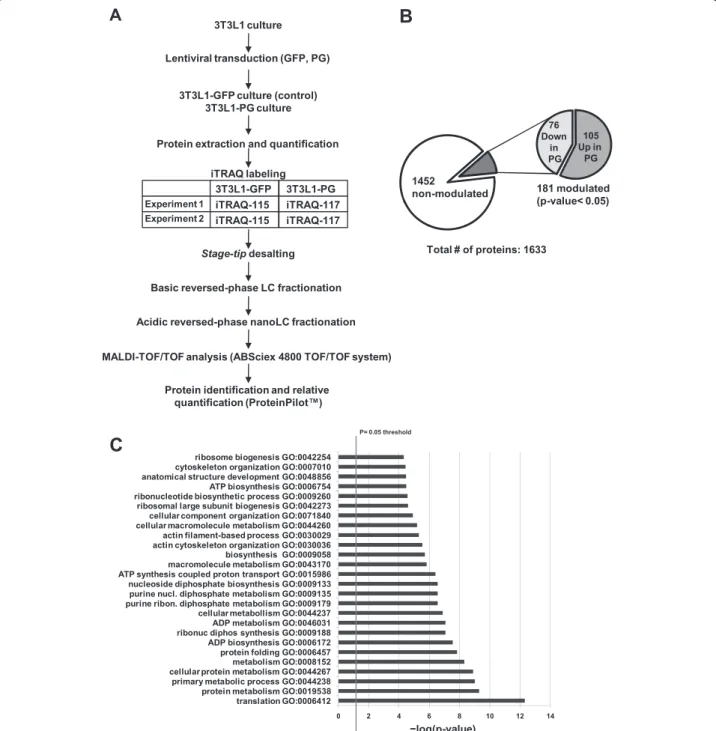
(6) Mateos et al. Stem Cell Research & Therapy (2015)6:9. cell lines was tested by directed differentiation in adipogenic medium for 7 days followed by Oil red staining and haematoxylin and eosin counterstaining (Fig. 1c). PG-3T3L1 cells show a defective adipogenic capacity when compared with non-transduced and control GFP-3T3L1 cells. Oil red densitometry demonstrates a significant (p <0.05) decrease in the total area of the lipid droplets (Fig. 1c).. Page 6 of 17. iTRAQ relative quantification. A summary of the workflow followed for iTRAQ relative quantification of modulated proteins in PG-3T3L1 cells versus GFP-3T3L1 cells is shown in Fig. 2a. A total of 1633 proteins were identified after grouping; 76 of them were significantly decreased whereas 105 were increased in PG-3T3L1 versus control (Fig. 2b). Proteins were considered significantly modulated if the 117/115 ratio was. Fig. 2 Isobaric tags for relative quantification (iTRAQ) of modulated proteins in 3T3L1-PG cells. a Workflow followed for the relative quantification of modulated proteins in PG-3T3L1 cells. b Summary of the protein identification and relative quantification. c Significantly modulated biological processes after String 9.0 analysis of the modulated individual proteins. GFP green fluorescent protein, GO gene ontology, LC-MALDI-TOF liquid chromatography coupled offline to matrix-assisted laser desorption ionization–time of flight, PG progerin.
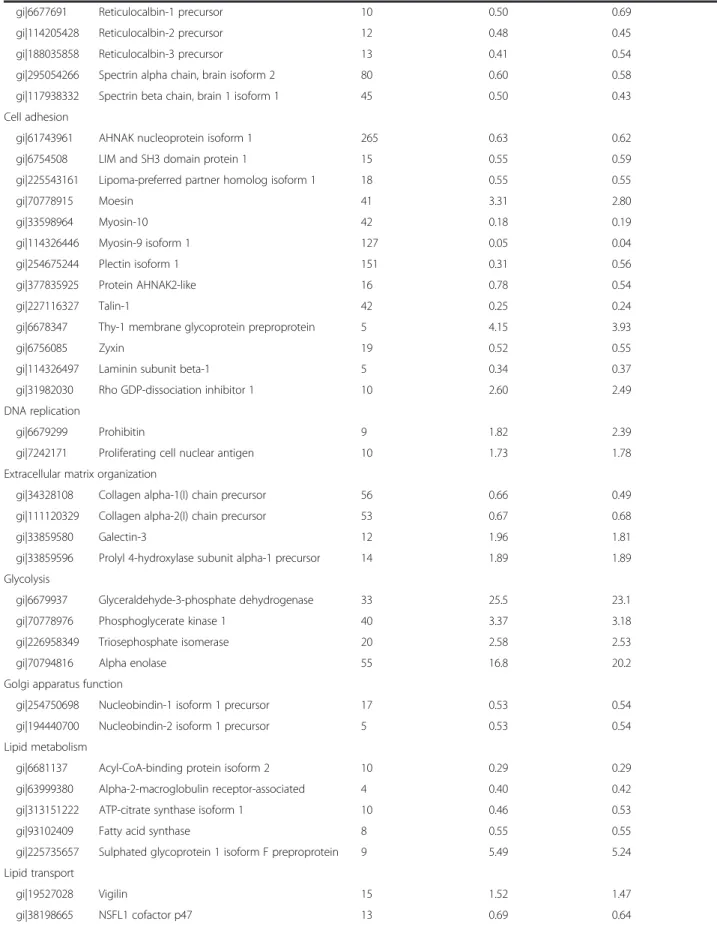
(7) Mateos et al. Stem Cell Research & Therapy (2015)6:9. Page 7 of 17. Table 1 Modulated proteins (p <0.05) in PG-3T3L1 cells classified according to their principal biological process Accession number. Name. Total number of peptides. iTRAQ 1 ratio PG/ control. iTRAQ 2 ratio PG/ control. Actin cytoskeleton organization gi|157951604. Adenylyl cyclase-associated protein 1. 9. 1.80. 1.81. gi|6680924. cofilin-1. 22. 2.63. 2.63. gi|6681069. Cysteine and glycine-rich protein 1. 9. 0.41. 0.44. gi|62526118. Cytoskeleton-associated protein 4. 22. 6.02. 5.81. gi|125347376. Filamin-A. 123. 0.06. 0.06. gi|145966915. Filamin-B. 89. 0.18. 0.22. gi|124487139. Filamin-C. 51. 0.42. 0.44. gi|130488506. Four and a half LIM domains protein 3. 8. 0.39. 0.34. gi|61657921. Kinesin-1 heavy chain. 14. 0.49. 0.44. gi|6755040. Profilin-1. 19. 2.90. 2.94. gi|10946578. Thymosin beta-4. 15. 0.42. 0.44. gi|47894398. Tropomyosin alpha-4 chain. 51. 0.57. 0.60. gi|31982755. Vimentin. 101. 27.8. 29.5. Alternative splicing gi|85060507. Heterogeneous nuclear ribonucleoprotein A1. 27. 6.94. 8.24. gi|21313308. Heterogeneous nuclear ribonucleoprotein M. 17. 2.70. 2.85. gi|283436178. Heterogeneous nuclear ribonucleoproteins C1/C2. 10. 1.82. 1.85. gi|6678143. Lupus La protein homolog. 9. 1.57. 1.89. gi|31560656. Polyadenylate-binding protein 1. 24. 1.55. 1.88. gi|126157504. Serine/arginine repetitive matrix protein 2. 12. 0.33. 0.35. gi|34328400. Serine/arginine-rich splicing factor 1 isoform 1. 12. 0.58. 0.63. gi|153791358. Splicing factor 3B subunit 1. 7. 0.50. 0.52. gi|268837785. Splicing factor 3b, subunit 2. 16. 1.59. 1.62. gi|23956214. Splicing factor, proline- and glutamine-rich. 22. 1.48. 1.45. gi|6680748. ATP synthase subunit alpha. 21. 2.53. 2.48. gi|31980648. ATP synthase subunit beta. 32. 5.89. 5,84. gi|7949005. ATP synthase-coupling factor 6. 8. 0.35. 0.38. gi|150456419. ATP-dependent RNA helicase A. 10. 0.52. 0.45. gi|134288917. Cytoplasmic dynein 1 heavy chain 1. 16. 0.48. 0.53. ATP metabolism. Calcium-mediated signalling gi|6996913. Annexin A2. 28. 1.89. 1.72. gi|6753060. Annexin A5. 26. 6.01. 6.47. gi|21704156. Caldesmon 1. 31. 2.17. 2.49. gi|6753244. Calmodulin. 22. 0.31. 0.31. gi|6671664. Calnexin. 14. 1.62. 2.44. gi|21312564. Calponin-3. 15. 2.01. 1.79. gi|6680836. Calreticulin precursor. 31. 3.37. 3,98. gi|31981086. EF-hand domain-containing protein D2. 6. 0.39. 0.40. gi|6679465. Glucosidase 2 subunit beta precursor. 9. 0.59. 0.69. gi|33620739. Myosin light polypeptide 6. 24. 0.69. 0.39. gi|6677833. Protein S100-A10. 11. 0.28. 0.31.
(8) Mateos et al. Stem Cell Research & Therapy (2015)6:9. Page 8 of 17. Table 1 Modulated proteins (p <0.05) in PG-3T3L1 cells classified according to their principal biological process (Continued) gi|6677691. Reticulocalbin-1 precursor. 10. 0.50. 0.69. gi|114205428. Reticulocalbin-2 precursor. 12. 0.48. 0.45. gi|188035858. Reticulocalbin-3 precursor. 13. 0.41. 0.54. gi|295054266. Spectrin alpha chain, brain isoform 2. 80. 0.60. 0.58. gi|117938332. Spectrin beta chain, brain 1 isoform 1. 45. 0.50. 0.43. gi|61743961. AHNAK nucleoprotein isoform 1. 265. 0.63. 0.62. gi|6754508. LIM and SH3 domain protein 1. 15. 0.55. 0.59. gi|225543161. Lipoma-preferred partner homolog isoform 1. 18. 0.55. 0.55. gi|70778915. Moesin. 41. 3.31. 2.80. gi|33598964. Myosin-10. 42. 0.18. 0.19. gi|114326446. Myosin-9 isoform 1. 127. 0.05. 0.04. gi|254675244. Plectin isoform 1. 151. 0.31. 0.56. gi|377835925. Protein AHNAK2-like. 16. 0.78. 0.54. gi|227116327. Talin-1. 42. 0.25. 0.24. gi|6678347. Thy-1 membrane glycoprotein preproprotein. 5. 4.15. 3.93. gi|6756085. Zyxin. 19. 0.52. 0.55. gi|114326497. Laminin subunit beta-1. 5. 0.34. 0.37. gi|31982030. Rho GDP-dissociation inhibitor 1. 10. 2.60. 2.49. Cell adhesion. DNA replication gi|6679299. Prohibitin. 9. 1.82. 2.39. gi|7242171. Proliferating cell nuclear antigen. 10. 1.73. 1.78. 56. 0.66. 0.49. Extracellular matrix organization gi|34328108. Collagen alpha-1(I) chain precursor. gi|111120329. Collagen alpha-2(I) chain precursor. 53. 0.67. 0.68. gi|33859580. Galectin-3. 12. 1.96. 1.81. gi|33859596. Prolyl 4-hydroxylase subunit alpha-1 precursor. 14. 1.89. 1.89. gi|6679937. Glyceraldehyde-3-phosphate dehydrogenase. 33. 25.5. 23.1. gi|70778976. Phosphoglycerate kinase 1. 40. 3.37. 3.18. gi|226958349. Triosephosphate isomerase. 20. 2.58. 2.53. gi|70794816. Alpha enolase. 55. 16.8. 20.2. Glycolysis. Golgi apparatus function gi|254750698. Nucleobindin-1 isoform 1 precursor. 17. 0.53. 0.54. gi|194440700. Nucleobindin-2 isoform 1 precursor. 5. 0.53. 0.54. Lipid metabolism gi|6681137. Acyl-CoA-binding protein isoform 2. 10. 0.29. 0.29. gi|63999380. Alpha-2-macroglobulin receptor-associated. 4. 0.40. 0.42. gi|313151222. ATP-citrate synthase isoform 1. 10. 0.46. 0.53. gi|93102409. Fatty acid synthase. 8. 0.55. 0.55. gi|225735657. Sulphated glycoprotein 1 isoform F preproprotein. 9. 5.49. 5.24. gi|19527028. Vigilin. 15. 1.52. 1.47. gi|38198665. NSFL1 cofactor p47. 13. 0.69. 0.64. Lipid transport. Nuclear structure.
(9) Mateos et al. Stem Cell Research & Therapy (2015)6:9. Page 9 of 17. Table 1 Modulated proteins (p <0.05) in PG-3T3L1 cells classified according to their principal biological process (Continued) gi|162287370. Prelamin-A/C isoform A. 47. 4.62. 4.79. gi|7110705. Prothymosin alpha. 7. 0.42. 0.43. Nucleosome assembly gi|7949045. Histone H2A.Z. 6. 1.73. 1.49. gi|13591862. Protein SET isoform 1. 21. 0.22. 0.27. Nucleotide biosynthesis gi|209862992. Dihydropyrimidinase-related protein 3 isoform 1. 18. 1.95. 1.75. gi|377835587. inosine-5′-monophosphate dehydrogenase 2-like. 9. 1.47. 1.68. 6. 3.05. 3.20. Oxidation–reduction process gi|31542438. Cytochrome b5 type B precursor. gi|112181182. Cytochrome c oxidase subunit 5A. 12. 0.35. 0.28. gi|6681095. Cytochrome c, somatic. 9. 0.44. 0.41. gi|112293264. Protein disulphide-isomerase A3 precursor. 49. 6.03. 5.80. gi|86198316. Protein disulphide-isomerase A4 precursor. 27. 1.55. 1.61. gi|42415475. Protein disulphide-isomerase precursor. 44. 1.86. 1.87. gi|6755911. Thioredoxin. 10. 0.47. 0.47. Protein catabolic process gi|6679501. 26S protease regulatory subunit 4. 15. 2.21. 2.59. gi|228008337. 26S protease regulatory subunit 6A. 16. 1.97. 1.93. gi|124248577. 26S protease regulatory subunit 6B. 12. 2.27. 2.37. gi|19882201. 26S proteasome non-ATPase regulatory subunit. 9. 0.54. 0.52. gi|6755212. Proteasome activator complex subunit 1. 12. 0.60. 0.58. Protein folding and stress response gi|6680309. 10 kDa heat shock protein, mitochondrial. 8. 0.34. 0.34. gi|183396771. 60 kDa heat shock protein, mitochondrial. 46. 23.9. 13.9. gi|115270960. BAG family molecular chaperone regulator 3. 9. 0.57. 0.59. gi|6755863. Endoplasmin precursor. 42. 6.42. 7.51. gi|31981690. Heat shock cognate 71 kDa protein. 68. 14.4. 19.9. gi|6754254. Heat shock protein HSP 90-alpha. 44. 2.22. 2.26. gi|40556608. Heat shock protein HSP 90-beta. 48. 2.55. 2.46. gi|27229055. Huntingtin-interacting protein K. 5. 0.40. 0.42. gi|161353506. Serpin H1 precursor. 22. 2.44. 2.39. gi|162461907. Stress-70 protein, mitochondrial. 52. 2.05. 2.04. gi|126521835. T-complex protein 1 subunit beta. 18. 1.71. 1.68. gi|6671702. T-complex protein 1 subunit epsilon. 16. 1.59. 1.51. gi|6753324. T-complex protein 1 subunit zeta. 11. 1.66. 1.75. gi|28077049. Charged multivesicular body protein 4b. 9. 0.51. 0.51. gi|51491845. Clathrin heavy chain 1. 18. 0.52. 0.48. gi|122939198. Clathrin light chain A isoform c. 7. 0.44. 0.45. gi|88014720. Importin subunit beta-1. 9. 0.41. 0.42. gi|124486712. Ribosome-binding protein 1 isoform a. 20. 0.60. 0.65. Protein transport. Regulation of apoptosis and cell death gi|226874906. 14-3-3 protein epsilon. 13. 2.01. 1.62. gi|6756041. 14-3-3 protein zeta/delta isoform 1. 15. 2.55. 2.61.
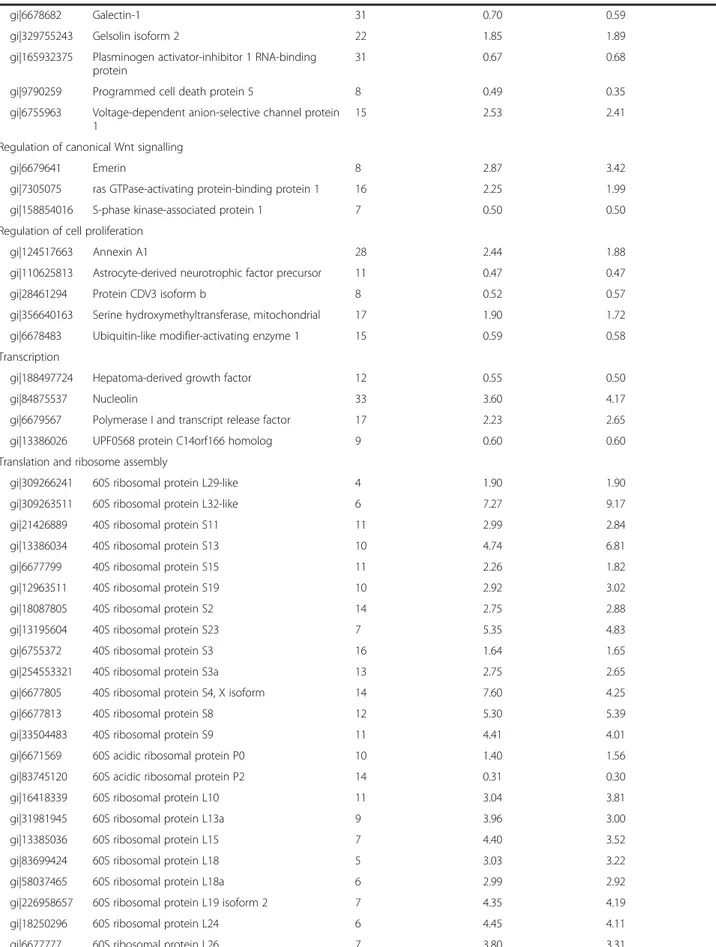
(10) Mateos et al. Stem Cell Research & Therapy (2015)6:9. Page 10 of 17. Table 1 Modulated proteins (p <0.05) in PG-3T3L1 cells classified according to their principal biological process (Continued) gi|6678682. Galectin-1. 31. 0.70. 0.59. gi|329755243. Gelsolin isoform 2. 22. 1.85. 1.89. gi|165932375. Plasminogen activator-inhibitor 1 RNA-binding protein. 31. 0.67. 0.68. gi|9790259. Programmed cell death protein 5. 8. 0.49. 0.35. gi|6755963. Voltage-dependent anion-selective channel protein 1. 15. 2.53. 2.41. 8. 2.87. 3.42. Regulation of canonical Wnt signalling gi|6679641. Emerin. gi|7305075. ras GTPase-activating protein-binding protein 1. 16. 2.25. 1.99. gi|158854016. S-phase kinase-associated protein 1. 7. 0.50. 0.50. 28. 2.44. 1.88. Regulation of cell proliferation gi|124517663. Annexin A1. gi|110625813. Astrocyte-derived neurotrophic factor precursor. 11. 0.47. 0.47. gi|28461294. Protein CDV3 isoform b. 8. 0.52. 0.57. gi|356640163. Serine hydroxymethyltransferase, mitochondrial. 17. 1.90. 1.72. gi|6678483. Ubiquitin-like modifier-activating enzyme 1. 15. 0.59. 0.58. gi|188497724. Hepatoma-derived growth factor. 12. 0.55. 0.50. gi|84875537. Nucleolin. 33. 3.60. 4.17. gi|6679567. Polymerase I and transcript release factor. 17. 2.23. 2.65. gi|13386026. UPF0568 protein C14orf166 homolog. 9. 0.60. 0.60. Transcription. Translation and ribosome assembly gi|309266241. 60S ribosomal protein L29-like. 4. 1.90. 1.90. gi|309263511. 60S ribosomal protein L32-like. 6. 7.27. 9.17. gi|21426889. 40S ribosomal protein S11. 11. 2.99. 2.84. gi|13386034. 40S ribosomal protein S13. 10. 4.74. 6.81. gi|6677799. 40S ribosomal protein S15. 11. 2.26. 1.82. gi|12963511. 40S ribosomal protein S19. 10. 2.92. 3.02. gi|18087805. 40S ribosomal protein S2. 14. 2.75. 2.88. gi|13195604. 40S ribosomal protein S23. 7. 5.35. 4.83. gi|6755372. 40S ribosomal protein S3. 16. 1.64. 1.65. gi|254553321. 40S ribosomal protein S3a. 13. 2.75. 2.65. gi|6677805. 40S ribosomal protein S4, X isoform. 14. 7.60. 4.25. gi|6677813. 40S ribosomal protein S8. 12. 5.30. 5.39. gi|33504483. 40S ribosomal protein S9. 11. 4.41. 4.01. gi|6671569. 60S acidic ribosomal protein P0. 10. 1.40. 1.56. gi|83745120. 60S acidic ribosomal protein P2. 14. 0.31. 0.30. gi|16418339. 60S ribosomal protein L10. 11. 3.04. 3.81. gi|31981945. 60S ribosomal protein L13a. 9. 3.96. 3.00. gi|13385036. 60S ribosomal protein L15. 7. 4.40. 3.52. gi|83699424. 60S ribosomal protein L18. 5. 3.03. 3.22. gi|58037465. 60S ribosomal protein L18a. 6. 2.99. 2.92. gi|226958657. 60S ribosomal protein L19 isoform 2. 7. 4.35. 4.19. gi|18250296. 60S ribosomal protein L24. 6. 4.45. 4.11. gi|6677777. 60S ribosomal protein L26. 7. 3.80. 3.31.
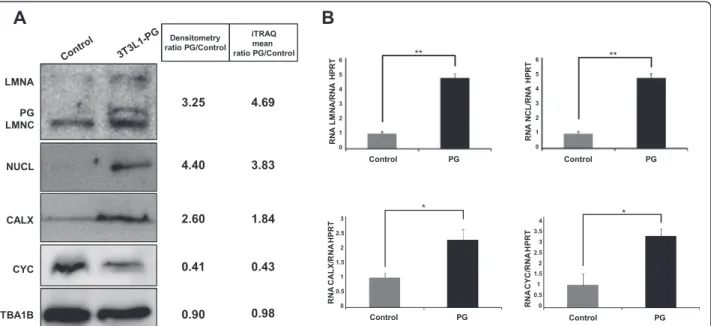
(11) Mateos et al. Stem Cell Research & Therapy (2015)6:9. Page 11 of 17. Table 1 Modulated proteins (p <0.05) in PG-3T3L1 cells classified according to their principal biological process (Continued) gi|8567400. 60S ribosomal protein L27. 9. 5.65. 5.99. gi|255308899. 60S ribosomal protein L3. 20. 3.47. 3.23. gi|94386224. 60S ribosomal protein L36-like. 4. 9.03. 8.15. gi|30794450. 60S ribosomal protein L4. 20. 5.75. 5.20. gi|23956082. 60S ribosomal protein L5. 10. 2.04. 1.32. gi|84662736. 60S ribosomal protein L6. 11. 7.24. 8.24. gi|31981515. 60S ribosomal protein L7. 9. 5.65. 6.23. gi|7305443. 60S ribosomal protein L7a. 9. 6.30. 6.42. gi|6755358. 60S ribosomal protein L8. 7. 8.87. 6.51. gi|14149647. 60S ribosomal protein L9. 9. 1.81. 2.29. gi|254540168. 78 kDa glucose-regulated protein precursor. 49. 5.20. 4.12. gi|82617575. Bifunctional glutamate/proline–tRNA ligase. 6. 0.43. 0.44. gi|126032329. Elongation factor 1-alpha 1. 33. 2.48. 2.63. gi|31980922. Elongation factor 1-beta. 16. 0.39. 0.30. gi|33859482. Elongation factor 2. 44. 0.32. 0.50. gi|21450625. Eukaryotic initiation factor 4A-I isoform 1. 23. 2.29. 1.96. gi|146219837. Eukaryotic translation initiation factor 3. 19. 0.50. 0.63. gi|365906249. Eukaryotic translation initiation factor 3. 8. 0.49. 0.32. gi|167234372. Eukaryotic translation initiation factor 4B. 23. 0.59. 0.60. gi|31712036. Eukaryotic translation initiation factor 5A-1. 26. 0.53. 0.54. gi|94367038. 40S ribosomal protein S6-like isoform 2. 6. 5.49. 5.50. gi|309264022. 40S ribosomal protein SA-like. 16. 3.02. 4.32. gi|149251177. 60S ribosomal protein L13-like. 8. 4.11. 3.18. gi|377837258. 60S ribosomal protein L23-like. 8. 3.83. 3.84. gi|63572172. 60S ribosomal protein L27a-like. 4. 6.99. 5.21. gi|37497112. Putative RNA-binding protein 3 isoform 1. 8. 0.59. 0.55. gi|31982373. rRNA 2′-O-methyltransferase fibrillarin. 8. 2.15. 2.07. iTRAQ isobaric tags for relative quantification, PG progerin. higher than 1.4 or lower than 0.7, always with p <0.05. Only proteins presenting similar significant ratios in both iTRAQ experiments 1 and 2 were considered modulated. The detailed list of modulated proteins classified by principal biological process is presented in Table 1. The list of modulated proteins was used to unravel, by String 9.0 analysis, the molecular pathways altered in PG3T3L1 cells (Fig. 2c). Among the most important processes determined are those related to translation (gene ontology (GO) process: 0006412), ribosome biogenesis (GO process: 0042273) and protein folding (GO process: 0006457), but also metabolism (GO process: 0008152), energy generation by the mitochondria (GO process: 0006754) and structure of the actin cytoskeleton (GO process: 0030036). Immunoblotting and real-time PCR validation of selected modulated proteins. Orthogonal validation of iTRAQ results by western blotting (Fig. 3) demonstrated in the first place that Lamin. A (ratio PG/control = 4.69) is actually accumulated in PG-3T3L1. Besides, immunoblotting of NCL and calnexin, both accumulated in PG-3T3L1, show similar densitometry ratios (4.40 and 2.60) to those obtained by iTRAQ quantification (3.83 and 1.84, respectively). Finally, cytochrome c is decreased in PG-3T3L1 cells with a similar densitometry ratio (0.41) to that obtained by iTRAQ quantification (0.43). Real-time PCR data are in concordance with the proteomics data, with the exception of cytochrome c. This gene is overexpressed in PG-3T3L1 cells when compared with control. Study of the mitochondrial function in PG-3T3L1 cells. Since iTRAQ data suggest a dysfunction of the mitochondrial activity and a disorganization of the nuclear– mitochondrial cytoskeleton network we decided to determine the integrity of the mitochondrial network in PG-3T3L1 cells. First spectrophotometric analysis of the mitochondrial respiratory chain demonstrates significant.
(12) Mateos et al. Stem Cell Research & Therapy (2015)6:9. Page 12 of 17. Fig. 3 Immunoblotting and RT-PCR verification of selected proteins. a Western blotting analysis confirms the modulation of Lamin A, calnexin (CALX), nucleolin (NCL), and cytochrome c (CYC). Loading of equal amount of total protein was tested by Ponceau red staining (not shown) and α-tubulin immunoblotting. b Real-time PCR analysis of the selected proteins normalized against Hprt gene levels. *Significance (p <0.05) using the Kruskal–Wallis non-parametric test. **Significance (p <0.01) using the Kruskal–Wallis non-parametric test. iTRAQ isobaric tags for relative quantification, PG progerin. differences in the activity of electron carrier complex I, IV and V (Fig. 4a). The mitochondrial superoxide anion was determined by flow-cytometry measurement of MitoSox™treated cells, revealing that PG-expressing cells show a significant (p <0.05) increase in superoxide anion production (Fig. 4b). Furthermore, the OCR, a parameter that is proportional to mitochondrial basal activity, is also significantly (p <0.001) increased in PG-3T3L1 cells (Fig. 4c). Reduction of ROS levels with ROS scavengers and the effect of autophagy. Incubation of PG-3T3L1 with a general ROS scavenger (N-acetyl-cysteine (NAC) 10 mM for 1 hour; Fig. 5a, b) or a superoxide-specific quencher (MitoTempo 10 μM for 1 hour; Fig. 5c, d) results in a significant (p <0.05) reduction of the autophagic marker LC3-II/LC3-I ratio, indicating a decrease in autophagic proteolysis.. Discussion Aging is defined as the accumulation of diverse deleterious changes occurring in cells and tissues with advancing age that are responsible for the increased risk of disease and death [30]. Aging is now considered to be a very complex, multi-factorial process [31]. Several aging theories have been proposed, but to date no single theory explains all of the major age-related physiological changes. Among those theories, the role of mitochondrial dysfunction and free radical accumulation in aging and disease has gained strength in recent years [32–35], in part owing to the. satisfactory effects exerted by antioxidant compounds in in-vitro studies [36] and therapy [37–39]. Premature aging syndromes are used as models to understand molecular causes of aging-related changes. Among these diseases, HGPS is one of the most studied, although to date few proteomics studies have tried to deep into the mechanisms triggered by the accumulation of the causal agent (PG). Peinado et al. [40] demonstrated using a differential in gel electrophoresis (DIGE) approach that mitochondrial dysfunction and disorganization of the cytoskeleton were characteristic of the adipose tissue in ZMPSTE24 null mice, which mimic some but not all of the symptoms associated with HGPS-derived cells. Recently, similar results have been found in HGPS cells [41] following a stable isotopic labeling approach. To examine by quantitative proteomics (iTRAQ) the effect of the impairment of the expression of Lamin A, we used a lentiviral system to efficiently deliver PG expression in 3T3L1 preadipocytes. The efficient expression of PG in PG-transduced 3T3L1 cells was corroborated by immunoblotting (Fig. 1a). These cells present a decrease in both proliferative capacity and adipogenic potential (Fig. 1b, c), which is in agreement with previous results [29]. Since GFP-3T3L1 cells are similar to non-transduced 3T3L1 in terms of lamin expression, adipogenic capacity and proliferative rate, we decided to use that cell line as a control for the iTRAQ labelling and subsequent validations. A total of 1633 different proteins were quantified, and 181 of them were significantly modulated in PG-expressing cells versus control. To our knowledge, our.
(13) Mateos et al. Stem Cell Research & Therapy (2015)6:9. Page 13 of 17. Fig. 4 Mitochondrial dysfunction and ROS overproduction in 3T3L1-PG cells. a Measurement of the mitochondrial complex activity in digitoninpermeabilized cells demonstrates significant changes in complexes I, IV and V. b PG-3T3L1 cells show a significant increase in the mitochondrial ROS production, as revealed by MitoSox™ analysis. c Measurement of the rate of oxygen consumption (OCR) indicates that PG-3T3L1 cells have an increased mitochondrial basal activity. *Significance (p <0.05) using the Kruskal–Wallis non-parametric test. ***Significance (p <0.001) using the Kruskal–Wallis non-parametric test. Scale bar = 10 μm. CS citrate synthase, PG progerin. study represents the first iTRAQ-based proteomic analysis on the effect of PG expression to date.. Quantitative proteomics data suggest massive modulation of cytoskeleton organization, cell proliferation and protein synthesis processes. String 9.0 analysis demonstrate that expression of PG in 3T3L1 cells promotes changes in protein translation, energy generation by mitochondria, protein folding, response to stress, lipid metabolism and cytoskeleton organization. Expression of PG in 3T3L1 cells promotes modulation of a large set of regulators and structural components of the cytoskeleton, mainly those involved in the proper maintenance of the filamentous network connecting nucleus, endoplasmic reticulum and mitochondria. Of special interest we have detected upregulation of vimentin (ratio PG/control = 27.28) and cytoskeleton-associated protein 4 (ratio PG/control = 5.9), and downregulation of filamins A (ratio PG/control = 0.06), B (ratio PG/control = 0.18) and C (ratio PG/control = 0.43). Modulation of vimentin has. been described previously in Zmpste24−/− mice [40] and HGPS-derived cell lines [41]. Calcium ions are signalling molecules in living cells and play essential roles in cellular processes such as cell proliferation, enzyme activity, muscle contraction, cellular motility, maintenance of the structural integrity of the cytoskeleton and membrane transport, among others [42]. Our proteomics data show modulation of a set of proteins involved in calcium-mediated signalling, including calmodulin (ratio PG/control = 0.31), caldesmon 1 (ratio PG/control = 2.29), calnexin (ratio PG/control = 1.83) and calreticulin ratio (PG/control = 3.73). Of special interest, calnexin is part of the quality control machinery that holds back improperly folded proteins in the endoplasmic reticulum [43]. Western blot and real-time PCR validation (Fig. 3) confirms the increase of calnexin in PG-3T3L1 cells, suggesting that protein misfolding is enhanced by PG expression, a phenomenon described previously in biological [44, 45] and PG-related [46] aging. It is now widely accepted that PG accumulation modulates molecular pathways such as mTOR, pRB and Wnt signalling cascades, driving alterations in the.
(14) Mateos et al. Stem Cell Research & Therapy (2015)6:9. Page 14 of 17. A. B. C. D. Fig. 5 Effect of ROS scavengers on the autophagic proteolysis in PG-3T3L1 cells. a, b Western blot analysis of LC3 demonstrates a significant reduction in the LC3-II/LC3-I ratio in PG-3T3L1 cells incubated with 10 mM N-acetyl-cysteine (NAC) for 1 hour when compared with basal conditions. c, d Western-blot analysis of LC3 demonstrates a significant reduction in the LC3-II/LC3-I ratio in PG-3T3L1 cells incubated with 10 μM MitoTempo for 1 hour when compared with basal conditions. LC3 light chain 3, PG progerin. balance between apoptosis, cell differentiation and cell proliferation [8, 9, 47]. In our model we have detected modulation of proteins belonging to those three processes. For instance, voltage-dependent anion-selective channel protein 1, involved in the formation of apoptotic pores in the mitochondria [48], is upregulated in PG-3T3L1 cells (ratio PG/control = 2.53), as well as emerin (ratio PG/control = 3.31). This protein interacts with LAP2α and links nuclear Lamin A and actin cytoskeleton, negatively modulating accumulation of beta-catenin in the nucleus [49, 50]. Proteomic data strongly suggest a massive modulation of all molecular processes that culminate in protein synthesis and function. Of special interest is the modulation detected on NCL, the major component of the nucleolus and a repressor of the transcription [51]. This protein is upregulated in PG-expressing 3T3L1 cells (ratio PG/ control = 3.84). Western blot validation confirms the quantitative proteomics result, as well as real-time PCR analysis. Interestingly, NCL associates with chromatin and is a nucleolar marker of several pathological conditions, ranging from cancer to autoimmune diseases [52]. Protein SET, which mediates histone acetylation and nucleosome assembly, appears dramatically decreased in PG-expressing cells (ratio PG/control = 0.24). Also, a large set of structural ribosomal proteins and translation initiation factors appear to be modulated in our. proteomic screening, in agreement with previous data from Rivera-Torres et al. [41], indicating that PG expression exerts a dramatic alteration in protein synthesis and function. Quantitative proteomic data suggest that PG delivery induces defects on de-novo lipid synthesis and energy storage. Three main proteins are decreased in PG-3T3L1 cells. ATP-citrate synthase (ratio PG/control =0.49), fatty acid synthase (ratio PG/control = 0.55) and acyl-CoAbinding protein (ratio PG/control =0.29). All of them are part of the cellular machinery responsible for the condensation of acetyl CoA and malonyl CoA and the formation of medium and long-chain fatty acids and triacylglycerides that are the main energy repository in the cells [53]. Furthermore, inhibition of ATP-citrate synthase has been recently linked to a decrease in proliferation rate [54], which has been detected in our model (Fig. 1) and is a typical characteristic of PG-expressing cells. Our data agree with previous results from other PG-expression models [28, 40].. Mitochondrial dysfunction and imbalance in stress response are linked to loss of proteostasis and increase of autophagy in progerin-expressing cells. Since energy storage and lipogenesis are modulated in our model of PG overexpression, it is plausible, a priori, to.
(15) Mateos et al. Stem Cell Research & Therapy (2015)6:9. assume that ATP generation by the mitochondria and oxidation–reduction processes could be also affected. iTRAQ analysis demonstrated modulation of several components of the mitochondrial respiratory chain, especially complex IV and complex V. The complex III–complex IV electron carrier cytochrome c (ratio PG/control = 0.43) and the complex IV component cytochrome c oxidase (ratio PG/ control = 0.32) are significantly decreased in PG-3T3L1 cells. Cytochrome c decrease has been validated by immunoblotting (Fig. 3) and is in agreement with previous results [41]. However, real-time PCR analysis of cytochrome c shows an increase in the expression of this gene in PG3T3L1 cells. We asked whether this modulation of several components of the mitochondrial respiratory chain detected in PG-3T3L1 cells by quantitative proteomics drives uncoupling of the electron transport chain. Measurement of the MRC complex activities demonstrates significant differences in the activity of complex IV and V, which agrees with previous results [41], but also complex I (Fig. 5a). The activity of this complex is twice as high in PG-3T3L1 when compared with control. Complex I is the main contributor for the generation of mitochondrial ROS and specifically the superoxide anion [55, 56], which has been proposed as one of the factors responsible for several mitochondrial pathologies [57] and plays a central role in the free radical theory of aging [31]. We have found a significantly. Page 15 of 17. overproduction of mitochondrial superoxide production in PG-3T3L1 cells, as revealed by MitoSox measurement (Fig. 4b). Heat shock proteins (hsp) and chaperones are responsible for monitoring the quality of the proteins, to maintain the homeostasis of the proteome (proteostasis) and to derive incorrect isoforms for ATP-dependent degradation by the proteasome, and are upregulated in living cells in response to environmental stress conditions. We have found a dramatic increase of this group of proteins in PG-3T3L1 cells, indicating an activation of chaperone-mediated autophagy (CMA), a process recently described in age-related pathologies [58, 59]. The most obvious examples are hsp60 (ratio PG/control = 18.53), heat shock cognate 71 kDa protein (ratio PG/control =16.59) and endoplasmin or GRP94 (ratio PG/control =6.91). Hsp60 is one of the central components that regulate proteostasis during redox imbalance [60], and is upregulated in stress and disease. Heat shock cognate 71 kDa protein acts as a repressor at the transcriptional level [61]. Finally, GRP94 is a marker of endoplasmic reticulum-mediated degradation of proteins and has been recently involved in regulation of the canonical Wnt signalling pathway [62]. The loss of proteostasis could explain the apparent discordance between the proteomics and genomics data for cytochrome c. The elevated levels of mitochondrial ROS could promote an increase in the misfolding of the components of the respiratory chain, driving an. Fig. 6 Model representing the main cellular events triggered by lentiviral-driven PG nuclear accumulation and their contribution to the premature aging. PG accumulation leads to modulation of mTOR and WnT pathways, alteration in the protein synthesis machinery and mitochondrial dysfunction and reactive oxygen species (ROS) overproduction, ultimately contributing to the premature aging phenotype.
(16) Mateos et al. Stem Cell Research & Therapy (2015)6:9. abnormal rate of protein degradation. In any case, further investigation is necessary to demonstrate this hypothesis. Previously, an increase in autophagic proteolysis has been reported in the progeroid phenotype [63, 64], suggesting that chronic activation of an, a priori, pro-survival cellular mechanism can turn into a harmful and detrimental process. We therefore asked whether a reduction of ROS cellular levels could promote a modulation of this process. Incubation of the PG-3T3L1 cells with a general ROS scavenger (NAC 10 mM) or a superoxide anion-specific scavenger (MitoTempo 10 μM) exerts a significant (p <0.05) reduction of the LC3-II/LC3-I ratio (Fig. 5), pointing to a reduction in the autophagic proteolysis in accordance with the growing evidence supporting the key role of ROS in the aging process.. Conclusions Our study represents one further step in the achievement of understanding the aging process. With our results, but also taking into account the results of excellent studies made by other research groups in recent years, we have tried to build a global scheme with a compilation of the main cellular events that leads to premature aging in HGPS driven by PG accumulation (Fig. 6). In the present work, we have demonstrated that PG expression promotes mitochondrial dysfunction and ROS overproduction. These events are, at least in part, the cause of an increase in protein misfolding and autophagic proteolysis leading, ultimately, to a global loss of proteostasis that partially contributes to the premature aging process. We have also demonstrated that treatment of the cells with antioxidant compounds reduces the autophagic phenotype, thus supporting the growing evidence indicating the importance of this kind of compound as candidates for therapeutics in aging-related diseases. Abbreviations CMA: Chaperone-mediated autophagy; DIGE: Differential in gel electrophoresis; DMEM: Dulbecco’s modified Eagle’s medium; FBS: Foetal bovine serum; GFP: Green fluorescent protein; GO: Gene ontology; HGPS: Hutchinson-Gilford Progeroid Syndrome; hsp: Heat shock protein; iTRAQ: Isobaric tags for relative quantification; LC3: Light chain 3; LC-MALDI-TOF/TOF: liquid chromatography coupled offline to matrix-assisted laser desorption ionization–time of flight; LMNA: Lamin A; NAC: N-acetyl-cysteine; NCL: Nucleolin; OCR: Rate of oxygen consumption; PBS: Phosphate-buffered saline; PG: Progerin; ROS: Reactive oxygen species. Competing interest The authors declare that they have no competing interests. Authors’ contributions JM, AL-A, JAF-L, PF-Pe, IL-R, PF-Pu, MF-M and AD made substantial contributions to acquisition of data and their analysis and interpretation. MAM, JM, FJB and MCA made substantial contributions to designing the experiments and were involved in drafting the manuscript and revising it critically for important intellectual content. FJB and MCA gave final approval of the version to be published and agree to be accountable for all aspects of the work in ensuring that questions related to the accuracy or integrity of any part of the work were appropriately investigated and were resolved. All authors read and approved the final manuscript.. Page 16 of 17. Acknowledgements The authors wish to thank Mª José Sánchez-Dopico, Purificación Filgueira-Fernández and Noa Goyanes for technical assistance, Susana Sangiao-Alvarellos, Noa Valcárcel, Carlos Vaamonde and Beatriz Caramés for helpful suggestions, Sonia Pértega for help with R analysis, María Pardo and Luisa M. Seoane for kind donation of the 3T3L1 cell line and helpful suggestions, and Tom Misteli and Eva Hernando for plasmid donations. This study was supported by grants from the Servizo Galego de Saúde, Xunta de Galicia (PS07/86), Cátedra Bioibérica de la Universidade da Coruña and Instituto de Salud Carlos III—Ministerio Economía y Competitividad N° Expediente PI11/02799 Unión Europea—Fondo Europeo de Desarrollo Regional (FEDER) ‘Una manera de hacer Europa’. Author details Grupo de Proteómica-ProteoRed/Plataforma PBR2-ISCIII, Servicio de Reumatología, Instituto de Investigación Biomédica de A Coruña (INIBIC), Complexo Hospitalario Universitario de A Coruña (CHUAC), Sergas, Universidade da Coruña, As Xubias, 15006 A Coruña, Spain. 2Cellular Therapy and Medicine Regenerative Group, Department of Medicine, Instituto de Investigación Biomédica de A Coruña (INIBIC), Complexo Hospitalario Universitario de A Coruña (CHUAC), Sergas, Universidade da Coruña, As Xubias, 15006 A Coruña, Spain. 3Rheumatology Division, CIBER-BBN/ISCII, Instituto de Investigación Biomédica de A Coruña INIBIC-Hospital Universitario A Coruña, 15006 A Coruña, Spain. 4Grupo de Genómica, Instituto de Investigación Biomédica de A Coruña (INIBIC), Complexo Hospitalario Universitario de A Coruña (CHUAC), Sergas, Universidade da Coruña, As Xubias, 15006 A Coruña, Spain. 5Laboratorio de Enfermedades Mitocondriales, Instituto de Investigación Hospital 12 de Octubre (i + 12), Centro de Investigación Biomédica en Red de Enfermedades Raras (CIBERER), U723, Madrid E-28041, Spain. 1. Received: 10 October 2014 Revised: 14 October 2014 Accepted: 4 June 2015. References 1. Worman HJ, Ostlund C, Wang Y. Diseases of the nuclear envelope. Cold Spring Harb Perspect Biol. 2010;2:a000760. 2. Agarwal US, Sitaraman S, Mehta S, et al. Hutchinson-Gilford progeria syndrome. Indian J Dermatol Venereol Leprol. 2010;76:591. 3. Ershler WB, Ferrucci L, Longo DL. Hutchinson-Gilford progeria syndrome. N Engl J Med. 2008;358:2409–10. author reply 2410–1. 4. Hennekam RC. Hutchinson-Gilford progeria syndrome: review of the phenotype. Am J Med Genet A. 2006;140:2603–24. 5. Merideth MA, Gordon LB, Clauss S, et al. Phenotype and course of Hutchinson-Gilford progeria syndrome. N Engl J Med. 2008;358:592–604. 6. Eriksson M, Brown WT, Gordon LB, et al. Recurrent de novo point mutations in lamin A cause Hutchinson-Gilford progeria syndrome. Nature. 2003;423:293–8. 7. Worman HJ. Components of the nuclear envelope and their role in human disease. Novartis Found Symp. 2005;264:35–42. discussion 42–50, 227–30. 8. Scaffidi P, Misteli T. Lamin A-dependent misregulation of adult stem cells associated with accelerated ageing. Nat Cell Biol. 2008;10:452–9. 9. Espada J, Varela I, Flores I, et al. Nuclear envelope defects cause stem cell dysfunction in premature-aging mice. J Cell Biol. 2008;181:27–35. 10. Misteli T, Soutoglou E. The emerging role of nuclear architecture in DNA repair and genome maintenance. Nat Rev Mol Cell Biol. 2009;10:243–54. 11. Davies BS, Barnes 2nd RH, Tu Y, et al. An accumulation of non-farnesylated prelamin A causes cardiomyopathy but not progeria. Hum Mol Genet. 2010;19:2682–94. 12. Yang SH, Chang SY, Ren S, et al. Absence of progeria-like disease phenotypes in knock-in mice expressing a non-farnesylated version of progerin. Hum Mol Genet. 2011;20:436–44. 13. Reddy S, Comai L. Lamin A, farnesylation and aging. Exp Cell Res. 2012;318:1–7. 14. Guilherme A, Virbasius JV, Puri V, et al. Adipocyte dysfunctions linking obesity to insulin resistance and type 2 diabetes. Nat Rev Mol Cell Biol. 2008;9:367–77. 15. Kreier F, Fliers E, Voshol PJ, et al. Selective parasympathetic innervation of subcutaneous and intra-abdominal fat—functional implications. J Clin Invest. 2002;110:1243–50..
(17) Mateos et al. Stem Cell Research & Therapy (2015)6:9. 16. Schwartz MW, Woods SC, Porte D, et al. Central nervous system control of food intake. Nature. 2000;404:661–71. 17. Lenard NR, Berthoud HR. Central and peripheral regulation of food intake and physical activity: pathways and genes. Obesity (Silver Spring). 2008;16:S11–22. 18. Vatier C, Bidault G, Briand N, et al. What the genetics of lipodystrophy can teach us about insulin resistance and diabetes. Curr Diab Rep. 2013;13:757–67. 19. Guénantin AC, Briand N, Bidault G, et al. Nuclear envelope-related lipodystrophies. Semin Cell Dev Biol. 2013;29:148–57. 20. Capeau J, Magre J, Caron-Debarle M, et al. Human lipodystrophies: genetic and acquired diseases of adipose tissue. Endocr Dev. 2010;19:1–20. 21. Poulos SP, Dodson MV, Hausman GJ. Cell line models for differentiation: preadipocytes and adipocytes. Exp Biol Med (Maywood). 2010;235:1185–93. 22. Student AK, Hsu RY, Lane MD. Induction of fatty acid synthetase synthesis in differentiating 3T3-L1 preadipocytes. J Biol Chem. 1980;255:4745–50. 23. Szklarczyk D, Franceschini A, Kuhn M, et al. The STRING database in 2011: functional interaction networks of proteins, globally integrated and scored. Nucleic Acids Res. 2011;39:D561–8. 24. Maneiro E, Martín MA, de Andres MC, et al. Mitochondrial respiratory activity is altered in osteoarthritic human articular chondrocytes. Arthritis Rheum. 2003;48:700–8. 25. Medja F, Allouche S, Frachon P, et al. Development and implementation of standardized respiratory chain spectrophotometric assays for clinical diagnosis. Mitochondrion. 2009;9:331–9. 26. Matsushime H, Quelle DE, Shurtleff SA, et al. D-type cyclin-dependent kinase activity in mammalian cells. Mol Cell Biol. 1994;14:2066–76. 27. Livak KJ, Schmittgen TD.Analysis of relative gene expression data using realtime quantitative PCR and the 2(-Delta Delta C(T)) Method. Methods. 2001 Dec;25(4):402-8. 28. Young SG, Meta M, Yang SH, et al. Prelamin A farnesylation and progeroid syndromes. J Biol Chem. 2006;281:39741–5. 29. Mateos J, De la Fuente A, Lesende-Rodriguez I, et al. Lamin A deregulation in human mesenchymal stem cells promotes an impairment in their chondrogenic potential and imbalance in their response to oxidative stress. Stem Cell Res. 2013;11:1137–48. 30. Tosato M, Zamboni V, Ferrini A, et al. The aging process and potential interventions to extend life expectancy. Clin Interv Aging. 2007;2:401–12. 31. López-Otín C, Blasco MA, Partridge L, et al. The hallmarks of aging. Cell. 2013;153:1194–217. 32. Harman D. The free radical theory of aging. Antioxid Redox Signal. 2003;5:557–61. 33. Brand MD, Orr AL, Perevoshchikova IV, et al. The role of mitochondrial function and cellular bioenergetics in ageing and disease. Br J Dermatol. 2013;169:1–8. 34. Kregel KC, Zhang HJ. An integrated view of oxidative stress in aging: basic mechanisms, functional effects, and pathological considerations. Am J Physiol Regul Integr Comp Physiol. 2007;292:R18–36. 35. López-Armada MJ, Riveiro-Naveira RR, Vaamonde-García C, et al. Mitochondrial dysfunction and the inflammatory response. Mitochondrion. 2013;13:106–18. 36. Vaamonde-García C, Riveiro-Naveira RR, Valcárcel-Ares MN, et al. Mitochondrial dysfunction increases inflammatory responsiveness to cytokines in normal human chondrocytes. Arthritis Rheum. 2012;64:2927–36. 37. Favero G, Rodella LF, Reiter RJ, et al. Melatonin and its atheroprotective effects: A review. Mol Cell Endocrinol. 2014;382:926–37. 38. Khassaf M, McArdle A, Esanu C, et al. Effect of vitamin C supplements on antioxidant defence and stress proteins in human lymphocytes and skeletal muscle. J Physiol. 2003;549:645–52. 39. Ribas GS, Vargas CR, Wajner M. L-carnitine supplementation as a potential antioxidant therapy for inherited neurometabolic disorders. Gene. 2014;533:469–76. 40. Peinado JR, Quirós PM, Pulido MR, et al. Proteomic profiling of adipose tissue from Zmpste24−/− mice, a model of lipodystrophy and premature aging, reveals major changes in mitochondrial function and vimentin processing. Mol Cell Proteomics. 2011;10:M111.008094. 41. Rivera-Torres J, Acín-Perez R, Cabezas-Sánchez P, et al. Identification of mitochondrial dysfunction in Hutchinson-Gilford progeria syndrome through use of stable isotope labeling with amino acids in cell culture. J Proteomics. 2013;91:466–77. 42. Clapham DE. Calcium signaling. Cell. 2007;131:1047–58.. Page 17 of 17. 43. Lakkaraju AK, Abrami L, Lemmin T, et al. Palmitoylated calnexin is a key component of the ribosome-translocon complex. EMBO J. 2012;31:1823–35. 44. Schoneich C. Protein modification in aging: an update. Exp Gerontol. 2006;41:807–12. 45. Squier TC. Oxidative stress and protein aggregation during biological aging. Exp Gerontol. 2001;36:1539–50. 46. Barascu A, Le Chalony C, Pennarun G, et al. Oxydative stress alters nuclear shape through lamins dysregulation: a route to senescence. Nucleus. 2012;3:411–7. 47. Osorio FG, Varela I, Lara E, et al. Nuclear envelope alterations generate an aging-like epigenetic pattern in mice deficient in Zmpste24 metalloprotease. Aging Cell. 2010;9:947–57. 48. Shoshan-Barmatz V, Mizrachi D, Keinan N. Oligomerization of the mitochondrial protein VDAC1: from structure to function and cancer therapy. Prog Mol Biol Transl Sci. 2013;117:303–34. 49. Markiewicz E, Tilgner K, Barker N, et al. The inner nuclear membrane protein emerin regulates beta-catenin activity by restricting its accumulation in the nucleus. EMBO J. 2006;25:3275–85. 50. Ho CY, Jaalouk DE, Vartiainen MK, et al. Lamin A/C and emerin regulate MKL1-SRF activity by modulating actin dynamics. Nature. 2013;497:507–11. 51. Roger B, Moisand A, Amalric F, et al. Repression of RNA polymerase I transcription by nucleolin is independent of the RNA sequence that is transcribed. J Biol Chem. 2002;277:10209–19. 52. Storck S, Shukla M, Dimitrov S, et al. Functions of the histone chaperone nucleolin in diseases. Subcell Biochem. 2007;41:125–44. 53. Chirala SS, Wakil SJ. Structure and function of animal fatty acid synthase. Lipids. 2004;39:1045–53. 54. Lin R, Tao R, Gao X, et al. Acetylation stabilizes ATP-citrate lyase to promote lipid biosynthesis and tumor growth. Mol Cell. 2013;51:506–18. 55. Liu Y, Fiskum G, Schubert D. Generation of reactive oxygen species by the mitochondrial electron transport chain. J Neurochem. 2002;80:780–7. 56. McLennan HR, Esposti MD. The contribution of mitochondrial respiratory complexes to the production of reactive oxygen species. J Bioenerg Biomembr. 2000;32:153–62. 57. Hirst J, King MS, Pryde KR. The production of reactive oxygen species by complex I. Biochem Soc Trans. 2008;36:976–80. 58. Rodríguez-Muela N, Koga H, García-Ledo L, et al. Balance between autophagic pathways preserves retinal homeostasis. Aging Cell. 2013;12:478–88. 59. Caramés B, Hasegawa A, Taniguchi N, et al. Autophagy activation by rapamycin reduces severity of experimental osteoarthritis. Ann Rheum Dis. 2012;71:575–81. 60. Niforou K, Cheimonidou C, Trougakos IP. Molecular chaperones and proteostasis regulation during redox imbalance. Redox Biol. 2014;2:323–32. 61. Yamagishi N, Ishihara K, Hatayama T. Hsp105alpha suppresses Hsc70 chaperone activity by inhibiting Hsc70 ATPase activity. J Biol Chem. 2004;279:41727–33. 62. Liu B, Staron M, Hong F, et al. Essential roles of grp94 in gut homeostasis via chaperoning canonical Wnt pathway. Proc Natl Acad Sci U S A. 2013;110:6877–82. 63. Marino G, Ugalde AP, Salvador-Montoliu N, et al. Premature aging in mice activates a systemic metabolic response involving autophagy induction. Hum Mol Genet. 2008;17:2196–211. 64. Marino G, Lopez-Otin C. Autophagy and aging: new lessons from progeroid mice. Autophagy. 2008;4:807–9.. Submit your next manuscript to BioMed Central and take full advantage of: • Convenient online submission • Thorough peer review • No space constraints or color figure charges • Immediate publication on acceptance • Inclusion in PubMed, CAS, Scopus and Google Scholar • Research which is freely available for redistribution Submit your manuscript at www.biomedcentral.com/submit.
(18)
Figure

+7


Documento similar