Ancient Photosynthetic Eukaryote Biofilms in an Atacama Desert Coastal Cave
12
0
0
Texto completo
(2) 486. autospores in the form of tetrads inside the mother cells [16]. Both the 16S ribosomal RNA (rRNA) [47, 53] and the rbcL and psbA genes codified in the chloroplast [10], as well as the 18S rRNA in the chromosomal DNA [45], have been previously used for identification and phylogenetic classification of environmental samples. These phylogenetic studies suggest that the Cyanidiales are one of the most ancient groups of algae, having diverged about 1.3 billion years ago at the base of the Rhodophyta [19, 42, 54]. Nevertheless, it has been reported that species of the Cyanidium genera have also been found growing inside caves [9, 17]. These aerophytic epilithic “cave Cyanidium” are the mesophilic members of the clade, and current phylogenetic analyses support the existence of four distinct Cyanidiales lineages: the Galdieria spp. lineage, the C. caldarium lineage, the Cyanidioschyzon merolae plus Galdieria maxima lineage, and the novel monophyletic lineage of mesophilic cave Cyanidium spp. [9]. Previous analyses suggest that there is a high level of sequence divergence among Cyanidiales species based on environmental conditions, and, although they have a long evolutionary history, only a few recognized morphological species are known [9]. Based on morphological characteristics alone, Schwabe [41] reported in 1936 a species which he assigned to the Cyanidium genera in two caves on the central coast of Chile, which are located about 1,200 and 1,500 km south of our study site. On the other hand, the Atacama Desert is located between 17° and 27° S latitude in northern Chile. It is constrained on the east by the front ranges of the Andes Mountains and on the west by the Coastal Range. The Atacama is one of the driest and probably the oldest extant desert on Earth [25], having experienced hyperaridity for at least three million years and probably 150 million years [24]. To survive in these hyperarid conditions, life forms have adapted to very low air humidity levels, an almost complete absence of rain events, highly saline soils, and high solar radiation [4, 12, 29]. These harsh environmental factors may explain why parts of the Atacama Desert are almost devoid of microbial life [12, 18, 33]. Interestingly, the Atacama Desert has been established as a prime analog model for the planet Mars, and many research teams have conducted research on a diversity of astrobiological-oriented topics [43, 48]. Although much has been published about the hyperarid areas of the Atacama Desert [10, 28, 29, 50], fewer reports exist on the microbial life present in areas of the Atacama with a little more water availability. These areas could give valuable information to be compared with that of other sites located elsewhere in the hyperarid regions of the desert. The arid Coastal Range that separates the hyperarid Atacama Desert plateau from the Pacific Ocean, acts as a topographic barrier to clouds and moisture-rich marine air moving eastwards from the ocean. Consequently, the dry. A. Azúa-Bustos et al.. hills of the Pacific Coastal Range have more benign sites for the development of microbial life, differing from the typical desert conditions associated to the Atacama. Only recently, caves in the arid areas of the Atacama have begun to be explored, and to date no microorganisms of any type have been described living inside them [51]. Here, we describe the presence of biofilms growing at mesophilic conditions at the dimmest lighted zone of a coastal cave of the Atacama Desert. Our microscopy and molecular biology data suggest that the photosynthetic member of these biofilms is represented mainly, if not solely, by a new species of the Cyanidium genus, Cyanidium sp. Atacama, closely related to the only two other known cave Cyanidium previously described.. Methods Biofilm Sampling Biofilm samples were taken in situ by scraping the walls of the cave with a sterile scalpel and depositing the material obtained into sterile 50-ml Falcon tubes. When working at the dimmest lighted areas of the cave, care was taken in not disturbing the light conditions of the site by using strong sources of artificial lights. Temperature, RH, and pH Measurements Temperatures of rocks inside the cave were measured with a Raytek infrared thermometer (Raytek Corporation, Santa Cruz, CA, USA). Three readings per measurement were made by placing the thermometer about 5 cm from the rock being analyzed. Measurements were taken every 2 m from the cave bottom in both the western and eastern walls. The pH of the cave walls where biofilms develop was measured in situ by collecting water droplets from the rocks and using pH strips papers. Relative humidity (RH) and air temperature inside the cave were measured with a DO 9406 thermometer–hygrometer data logger (Delta Ohm, Padua, Italy). Measurements were taken at the bottom of the cave, near the entrances, and close to the eastern and western walls. Measurements were taken in March and June of 2008. Transmission Electron Microscopy Biofilm samples were centrifuged at 3,000 rpm on a tabletop centrifuge. The resulting pellet was fixed with 3% glutaraldehyde in sodium cacodylate buffer 0.1 M pH 7.2 during 18 h at room temperature. After three consecutive 20-min washes with sodium cacodylate buffer 0.1 M pH 7.2, the samples were treated with 1% aqueous.
(3) Atacama Cave Cyanidium. osmium tetroxide during 60 min. The samples were then dehydrated with a graded acetone series (50% to 100%), 15 min for each concentration used. The samples were preembedded overnight with epon–acetone 1:1 and then embedded in pure epon. The polymerization process was done at 60°C during 24 h. Sixty-nanometer-thin sections were obtained with a Sorvall MT-5000 ultramicrotome, and stained with 4% uranyl acetate in methanol and lead citrate. Observations were made with a Philips Tecnai 12 transmission electron microscope operated at 80 kV. Scanning Electron Microscopy A small rock sample covered with biofilm was fixed with 2% glutaraldehyde in cacodylate buffer overnight and then washed with the same buffer three times, 20 min each. After critical point drying and gold coating, the samples were observed with a scanning electron microscope Jeol JSM 25S-II at 30 kV. Confocal Laser Scanning Microscopy Biofilm samples of the dimmest lighted areas of the cave were suspended in water and immediately observed using an Olympus FV 1000 confocal laser scanning microscope equipped with a ×100 oil immersion objective (Olympus, Hamburg, Germany). The images were analyzed with the Fluoview 5.0 software. Bright Field Microscopy Biofilms samples were suspended in water, placed in a Neubauer cell counting chamber, and immediately observed with a Nikon Optiphot-2 microscope equipped with a Qimaging Micropublisher 3.3 RTV digital camera. Photosynthetic Photon Flux Density Measurements For photosynthetic photon flux density (PPFD) measurements, an Apogee Quantum Meter QMSW-SS calibrated for sunlight was used as instructed by the manufacturer. For the wall biofilms inside the cave, the sensor was placed parallel to the biofilms and then pointed to the entrances to measure the amount of light reaching each sector. Each reading was recorded when the sensor showed a stable value for at least 30 s. Isolation and Sequencing of 16S rRNA, rbcL, and psbA Gene Sequences Approximately 100 mg of biofilm material were aseptically collected and total genomic DNA was extracted using a Soil DNA Isolation Kit (MoBio Laboratories, Solano Beach,. 487. CA, USA) according to the manufacturer’s instructions. The 16S rRNA plastid gene present in the extracted DNA was amplified using the Cyanidium-specific oligonucleotide forward primer Cyan100F (5′-TATAATGGAGAGTTT GATCCTGGCT-3′) and the reverse primer Cyan1450R (5′-TCCAGTACGGCTACCTTGTTACG-3′). The ribulosel,5-bisphosphate carboxylase/oxygenase (RuBisCO) rbcL plastid gene present in the extracted DNA was amplified using the rbcL-specific oligonucleotide forward primers fwrub530 (5′-GTGACTGCTGCTACAATGGAGGA-3′) and the reverse primer rvrub1063 (5′-GCCTCTAAAGC TACCCTATTAGC-3′). These primers were designed on the basis of sequence comparisons of known 16S rRNA and rbcL Cyanidium genes. The psbA gene was amplified as previously reported [9]. For amplification of the DNA templates, the Go Taq green and colorless Master Mix (Promega Corporation, Madison, WI, USA) were used according to the manufacturer’s instructions, using a 1:100 dilution of the extracted DNA. Polymerase chain reaction (PCR) conditions consisted on an initial denaturing step at 94°C for 2 min followed by four sequential cycles of 94°C for 1 min, n°C for 1 min, and 72°C for 1 min, in which n=46–47–48–49°C. This was then followed by 31 cycles of 94°C for 1 min, 50°C for 1 min, 72°C for 1 min, and a final extension step at 72°C for 15 min, thus totaling 35 cycles of amplification. The PCR products were ligated to the pGEM-T Easy Vector System (Promega Corporation, Madison, WI, USA) and cloned in Escherichia coli XL1-Blue cells. The resulting plasmid vectors were isolated and purified using the Invisorb Spin Plasmid Mini Two (Invitek GmbH, Berlin, Germany) according to the manufacturer’s instructions. The automated sequencing of the clones and three PCR products was done by Macrogen DNA Sequencing Inc. (Seoul, Korea) using the M13 forward primer site of the pGEM-T Easy Vector. Phylogenetic Analysis The nucleotide sequence of the Cyanidium sp. Atacama 16S rRNA, rbcL, and psbA genes was analyzed using the Megablast option for highly similar sequences of the BLASTN algorithm against the National Center for Biotechnology Information non-rebundant database (www. ncbi.nlm.nih.gov). A multiple alignment of the orthologous 16S rRNA, psbA, and rbcL genes sequences of related Cyanidiales species was then performed using CLUSTALW [27]. Accession numbers for the plastid genes of previously sequenced rhodophytes used for phylogenetic comparisons were: 16S rRNA: AB002583, AY882672, AY391361, AY391359, AY391360, AF170718, X52985, EU586032, and X81840, rbcL: AB002583, AY119765,.
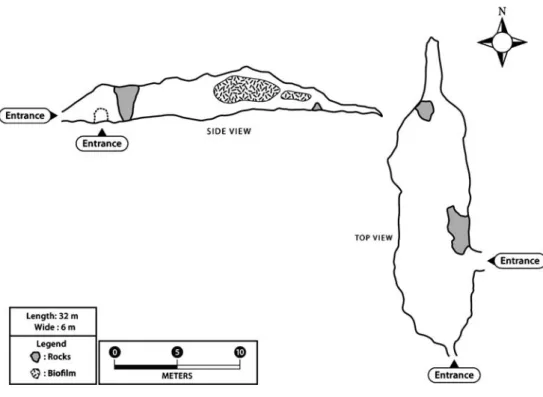
(4) 488. AY391370, AY541297, AY541298, X53045, AF022186, AY391368, and AY391369, psbA: AY391365, AY391366, AB002583, AY391367, AF022186, and X14667. Accession numbers for the 16S rRNA, rbcL, and psbA genes of Cyanidium sp. Atacama are FJ390400, FJ402842, and FJ447339, respectively. Phylogenetic reconstructions were performed through maximum parsimony using PAUP* 4.0b8. All characters were analyzed as unordered with four possible states (A, C, G, and T), excluding phylogenetically uninformative characters. The most parsimonious trees were found through an exhaustive search. Phylogenetic analyses were also accomplished using the neighbor-joining and maximum-likelihood algorithms available in PAUP. For the latter analysis, we first obtained the best fitting model of sequence evolution, using the Akaike Information Criterion in Modeltest 3.06. For the 16S rRNA genes, the AIC indicated that the GTR+G model (gamma: 0.2328) was the best model to describe the evolutionary process. Values were: −ln L=4,847.07952 (base frequencies: A 0.2713, C 0.2176, G 0.2957). In the case of the psbA genes, the AIC indicated that the GTR+G+I model (alpha 3.3312) was the best model to describe the evolutionary process. Values were: −ln L=3,887.80561 (base frequencies: A 0.25730, C 0.18620, G 0.21670). Consistency on the nodes was evaluated via bootstrap, performing 1,000 replicates for each of the optimality criterion analysis. Trees were rooted with the out-group criterion using the published sequence of the Cyanophora paradoxa 16S rRNA gene [9].. Figure 1 Map and profile view of the Atacama Desert cave. A. Azúa-Bustos et al.. Results Site Description The cave is located in the coastal range of the Atacama Desert, about 20 km north of the city of Antofagasta, Chile. It is placed at the base of a 50-m-high cliff, facing south towards the Pacific Ocean. The cave is approximately 35 m in depth and 6 m wide, with an average height of 3 to 4 m, although in parts its height exceeds 6 m (Fig. 1). It has two entrances; the one facing east is about 3 m wide and 3.5 m tall (Fig. 2a). The other entrance point south, confronts the Pacific Ocean, and is about 4 m wide and 3 m tall. The sea enters the cave through this entrance covering no more than one third of the ground during high tides. The walls of the cave are formed by Jurassic breccias of basaltic andesite, and the ceiling is formed by an overlaying conglomerate bed of fossilized marine sandstone and fossil shells dating 35 to two million years ago (Fig. 2b) [20]. The cave has a high RH that varies dynamically in time and is relatively homogenous along its interior (Table 1). The temperature of the rock walls inside the cave is around 15°C during most part of the day and is the same at similar distances from the entrance of the cave in both the eastern and western walls (Table 2). Water droplets collected from the walls where biofilm is located have a pH of 4.5. These water droplets seem to be evenly distributed along the cave and appear to be periodic since they were observed during March of 2008 but not in June, when the walls of the cave were drier..
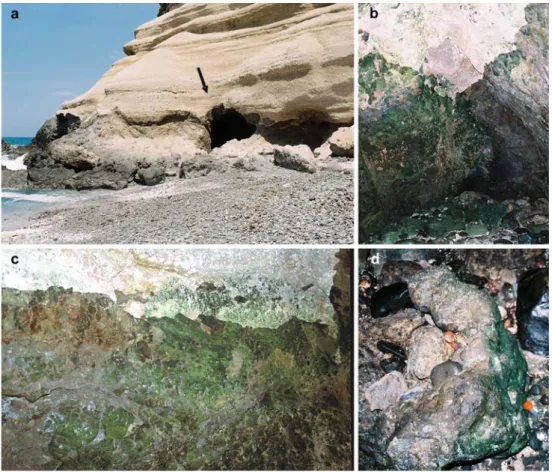
(5) Atacama Cave Cyanidium. 489. Figure 2 Atacama cave description. a East entrance. b View towards the bottom (north) of the cave. The biofilm area studied is located on the left side wall. c Detail of Cyanidium biofilm. d Biofilm on rocks at the bottom of the cave. Note the biofilm development only on the rock face oriented towards the east entrance. In both a, b, and c, the different geological origin of the walls and ceiling of the cave can be observed. although it is placed closer to the ground and on adjacent ground rocks (Fig. 2d). The eastern wall shows no development of biofilms (Fig. 2b).. Biofilm Distribution The studied biofilms have an intense green–emerald color and are dispersed throughout the cave, always away from direct light coming from the two entrances. The zone showing most biofilm development is located on the north– western wall, facing the east entrance but not directly confronting it. This zone is located about 13 m from the east entrance, and the biofilm is located about 1.5 m from the cave floor, extending 1.5 m towards the cave ceiling. Part of the ceiling above the main development zone also shows biofilm but to a lesser extent (Fig. 2c). On this same wall, about 23 m from the east entrance and towards the bottom of the cave, there is also biofilm development, Table 1 Variations in time of air temperature and RH and infrared temperature of walls of the cave interior (March 2008). Time. 14:00. 14:20 14:50 15:00 15:40. Photosynthetic Photon Flux Density Measurements The PPFD measured outside the southeast entrance of the cave on a clear summer day was of 1,668 μmol m−2 s−1. Two different measurements were made, namely, at 11 AM on a summer day (March) and at 14:30 PM on a winter day (June) of 2008, showing similar trends in the light profile inside the cave at the dimmest lighted zones. Five meters inside this entrance, the PPFD values on the western wall were of 25 μmol m−2 s−1. The main biofilm development. Air temperature (°C). At main biofilm Cave entrance Cave bottom. 21.7 22 22 25.5 19.1 – 18.8. Air RH (%). 77 80 80 59 85 77 89. IR t° (C) Eastern wall. Western wall. – – – 14 15 – 15. – – – 14 15 – –.
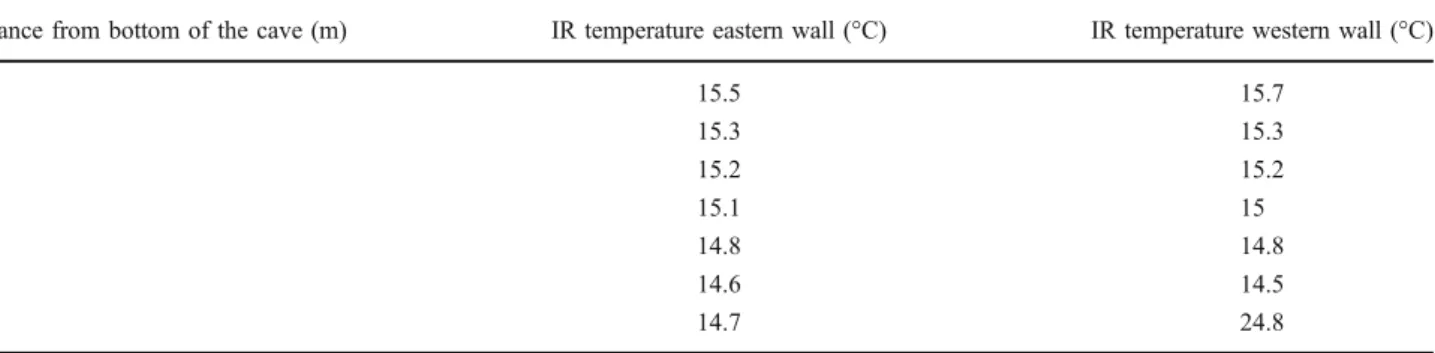
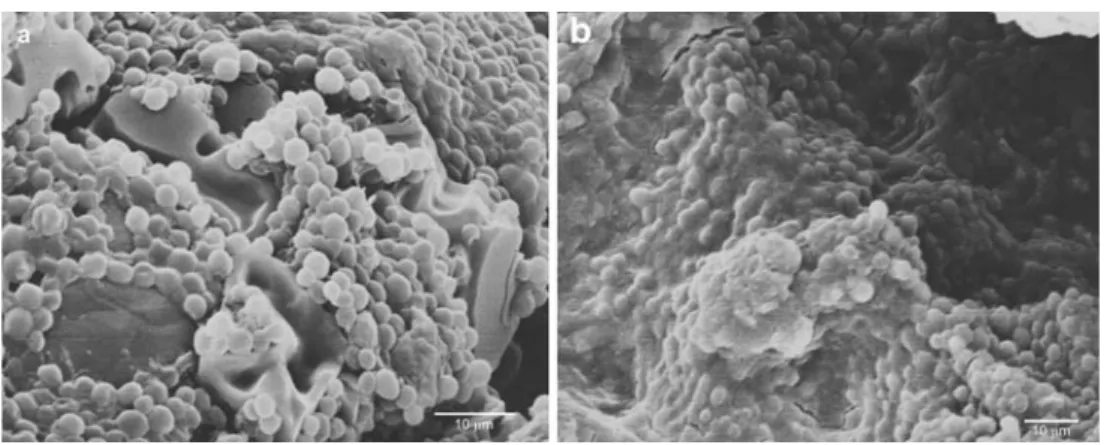
(6) 490. A. Azúa-Bustos et al.. Table 2 Infrared temperatures of cave interior walls (June 2008) Distance from bottom of the cave (m). IR temperature eastern wall (°C). IR temperature western wall (°C). 15.5 15.3 15.2 15.1 14.8 14.6 14.7. 15.7 15.3 15.2 15 14.8 14.5 24.8. 1 3 5 7 9 11 13. zone showed values of 1 to 3 μmol m−2 s−1, that is, 0.06% to 0.17% of the outside incident light. The bottom of the farthermost zone of the cave, where a thin biofilm could still be found, had values of 1 μmol m−2 s−1 (Table 3). The eastern wall had much lower or received no light, as measured by the used PPFD sensors. Thus, the areas of the cave where the biofilm develops are subject to extremely low light intensities, close to measuring sensitivity of the PPFD equipment. Microscopy Light microscopy examination of aqueous resuspended samples of biofilm scraped from the cave walls revealed a homogeneous and possibly monospecific population of photosynthetic primary producers. The spherical cells are 3–6 μm in diameter (Fig. 3a). Some autospore-containing cells are also seen (Figs. 3a and 4b). The cell’s single chloroplasts emit an intense chlorophyll autofluorescence red signal under the confocal microscope, as observed in Fig. 3b. Transmission electron microscopy (TEM) micrographs unveiled the typical ultrastructural elements previously described for these unicellular red algae (Fig. 4a). The chloroplast, nucleus, and mitochondria are clearly distinguished, as well as their corresponding membranes.. The thylakoid concentric membranes show the embedded phycobillisomes that have been described for this species. Several electron-dense bodies are also observed associated to the cell membrane (Fig. 4a), which in some cells appear to form two different chains at the opposite poles of the cell. On the other hand, scanning electron microscopy (SEM) micrographs show the Cyanidium biofilm attached to its parent rock. Two different aggregates can be observed: one in which the cells are close together with no supporting matrix (Fig. 5a) and another aggregate type where the cells are well embedded in matrix of (probably) exo-polysaccharides (EPS; Fig. 5b). Phylogenetic Analysis of 16S rRNA, psbA, and rbcL Chloroplast Genes Using 16S rRNA, psbA, and rbcL Cyanidium-specific primers, we amplified the 16S rRNA, psbA, and rbcL genes consisting of 1,461-, 920-, and 548-bp products, respectively. Automated sequencing of eight of the 16S rRNA clones and three PCR products showed that all where identical and matched (97% identity) with a partial sequence of the 16S ribosomal RNA gene of Cyanidium sp. Monte Rotaro, isolated from a cave in Italy. The next most similar sequence match (93% identity) corresponded. Table 3 Lighting profile along the length of the cave. The light available for photosynthesis was determined with a photosynthetic photon flux density measuring device outside and inside the cave at different places in both the western an eastern walls of the cave March 2008. June 2008. PPFD (μmol m−2 s−1). Percentage of outside light. PPFD (μmol m−2 s−1). Percentage of outside light. Western wall. Eastern wall. Western wall. Eastern wall. Western wall. Western wall. 0 5 10. 1,668 25 6. 1,668 12 3. 100 1.50 0.36. 100 0.72 0.18. 15 20 25 30. 6 3 2 1. 0 0 0 0. 0.36 0.18 0.12 0.06. Distance from cave entrance (m). 0 0 0 0. 1,250 158 54. 100 12.64 4.32. 21 7 2 1. 1.68 0.56 0.16 0.08.
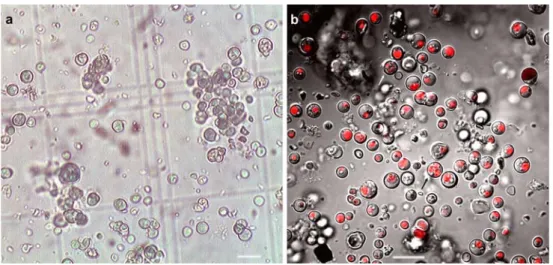
(7) Atacama Cave Cyanidium. 491. Figure 3 Micrographs of Cyanidium sp. cells found in biofilms of the Atacama cave. a Bright field micrograph of Cyanidium sp. composed of single photosynthetic cells and small fragmented colonies. Scale bar = 10 μm. b Merged CLSM micrograph of aqueous suspension of Cyanidium cells extracted from the cave biofilm. The differential. interference contrast image was merged with the red fluorescence (excitation/emission 543 nm/long pass filter <570 nm) due to the autofluorescence emitted by the cell chloroplast containing chlorophyll. Scale bar=10 μm. The arrows in b indicate endosporecontaining cells. to the 16S rRNA gene of Cyanidium sp. Sybil cave, also located in Italy. For the 16S rRNA gene, a single maximum-likelihood tree was obtained through the heuristic search option of PAUP, and the Modeltest software suggested that the best fitting model of sequence evolution to reconstruct the likelihood tree was as observed in Fig. 6. The analysis of the 16S rRNA gene show that “cave Cyanidium” species were recovered as a monophyletic group that included Cyanidium sp. Atacama and Cyanidium sp. Monte Rotaro as sister species with 100% of bootstrap support, whereas Cyanidium sp. Sybil cave was basal to this relationship with a bootstrap support of 91%. Similar results were obtained when using the psbA gene, and automated sequencing of three of the psbA clones showed that they matched (91% identity) with a partial sequence of the psbA gene of Cyanidium sp. Monte Rotaro. The next most similar sequence match (86% identity) corresponded to the psbA gene of Cyanidium sp. Sybil cave. In the case of the psbA gene, the cave Cyanidium species also were. recovered as a monophyletic group that included Cyanidium sp. Atacama and Cyanidium sp. Monte Rotaro as sister species with 99% of bootstrap support, whereas Cyanidium sp. Sybil cave was basal to this relationship with a bootstrap support of 92% (Fig. 7). In the case of the rbcL gene, the most similar sequence match (89% identity) corresponded to the rbcL gene of Cyanidium sp. Monte Rotaro. The maximum-likelihood tree obtained for the rbcL gene did not provide sufficient resolution, as Long Branch attraction persisted for the rbcL gene of Cyanidium sp. Atacama (data not shown).. Figure 4 TEM micrograph of an ultrathin section of Cyanidium cells showing cells in different developmental states within the same aggregate. a Note the characteristic organelles and the multilayered envelopes surrounding the cells. Scale bar = 1.4 μm. b Cell in a dividing state. Scale bar = 1.7 μm. C: chloroplast, V: vacuole, N: nucleus, M: mitochondria, cw: cell wall, nm: nuclear membrane, eps: exopolysaccharide layer, edb: electron-dense bodies. Discussion Being in an ancient desert and a recognized Mars analog, caves of the Atacama Desert represent a prime target for the search of its associated microorganisms. As for photosynthetic microorganisms, to date, mainly cyanobacteria have.
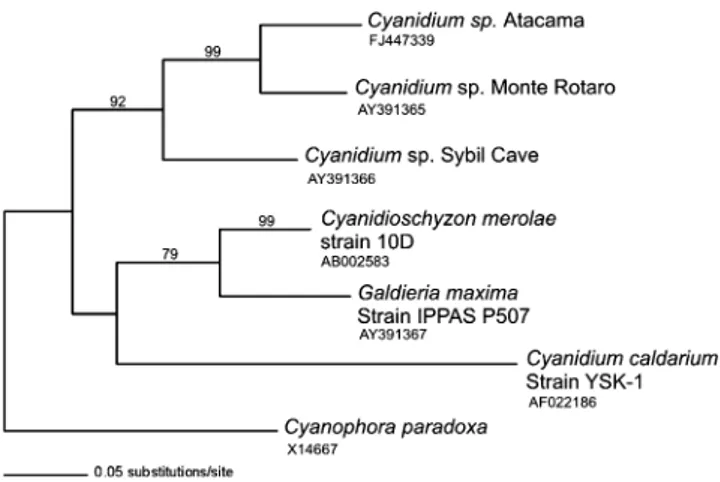
(8) 492. A. Azúa-Bustos et al.. Figure 5 SEM micrographs of Atacama cave Cyanidium. a Biofilm where individual cells are forming loose well-defined aggregates can be observed. Scale bar = 10 μm. b Biofilm conformation where the. cells are well embedded in matrix of exo-polysaccharides covering the parental rock. Scale bar = 10 μm. been described elsewhere in the Atacama [48, 50]. On the other hand, the Cyanidiales, an order of the Rhodophyta algae, are an ancient group of microorganisms dating as far as 2,000 million years ago [52]. The finding of a member of the Cyanidiales living in a cave in this area was unexpected, considering that most known species of this order inhabit acidic thermal springs. In our case, it was determined that the biofilms remain cool during most part of the day (15°C measured around noon), and that water droplets associated to it have a slightly acidic pH (4.5). The internal ultrastructure of cells scraped from the cave biofilm and observed under TEM shows the typical type and amount of organelles (one spherical chloroplast and one mitochondrion, in addition to the nucleus) already described for Cyanidium species [16, 30]. As for the SEM micrographs, two modes of cell. aggregations in the biofilm could be observed: one in which the cells appear to be loosely associated with each other, with low or no presence of extracellular materials, and another form of aggregation in which the cells are embedded in a well-developed extracellular matrix. Subaerial biofilm species often secrete EPS that facilitate further adhesion onto the substrate and, in the case of desert environments, the retention for longer periods of the scarce water available [22]. In our case, the reasons for the observed variations on biofilm conformation in an apparently isotropic humid microhabitat are still unclear. It has been suggested that downregulating EPS production at high cell densities could allow cells to redirect energy from EPS production into growth and cell division prior to a dispersal event [32]. Aside from the presence of EPS for cell adhesion to the wall matrix, another interesting possibility. Figure 6 Maximum-likelihood tree obtained from the aligned sequences of the 16S rRNA chloroplast gene for Cyanidiales species. Numbers above the node represent 1,000 replicate bootstrap values.
(9) Atacama Cave Cyanidium. Figure 7 Maximum-likelihood tree obtained from the aligned sequences of the psbA chloroplast gene for Cyanidiales species. Numbers above the node represent 1,000 replicate bootstrap values. is that EPS could be used as a medium for soluble molecules involved in intercellular communication and quorum sensing as previously suggested [26]. Being this the case, intercellular communication would no longer be needed previous to a dispersal event, which could explain the observed lack of an EPS matrix in some cases. One last possibility was proposed by Bellezza et al. (2006) [7] in which EPS, being rich in negative charges, may allow the adsorption of constituent cations from the mineral substrata. Irrespective of these possibilities, in both cases of biofilm conformation, a seemingly monospecific Cyanidium biofilm is morphologically observed. This observation is supported by the 16S rRNA analysis, which unambiguously shows only one type of photosynthetic species related to 16S rRNA gene sequence present in the dimmest lighted areas of the cave. When using cyanobacteria 16S-rRNAspecific primers [35], no species of this phylum were detected at this part of the cave after repeated attempts (data not shown). This is remarkable since photosynthetic microorganisms on rock surfaces rarely grow as colonies comprising a single species, and epilithic biofilms are commonly composed of several species of cyanobacteria and algae [22]. Nevertheless, an initial molecular characterization of the non-photosynthetic components of the biofilm shows that other species of heterotrophic bacteria can be detected as forming part of the biofilm which cannot be seen by the microscopy methods used, species of gammaproteobacteria related to the genera Salinisphaera (98% identity by 16S rRNA sequencing) and another bacteria morphologically similar to Saccharomonospora actinobacteria (data not shown). In the latter case, this bacterium can only be detected on collected rock samples in ex situ conditions, in which the water, temperature, and light conditions have been greatly altered for extended periods of time.. 493. The maximum-likelihood trees obtained for the 16S rRNA and psbA genes observed in Figs. 6 and 7 show the Cyanidium sp. Atacama forming part of the proposed “Cyanidium cave” monophyletic group that includes the other two known Cyanidium cave species, Cyanidium sp. Monte Rotaro being its closest relative. Only two of the proposed 17 known species of Cyanidiales, namely Cyanidium sp. Sybil and Cyanidium sp. Monte Rotaro, appear to inhabit caves, both located near the Vesuvius volcano [9]. These two species are considered to be the “mesophilic” members of the group. Thus, the 16S rRNA and psbA genes data support that the Atacama cave Cyanidium is part of the cave Cyanidium group, which as previously proposed [9] may be a novel monophyletic lineage of mesophilic Cyanidium spp., distinct from the remaining three other known lineages. In the case of the rbcL gene, although a much lower identity percentage is observed, its closest reported relative still is Cyanidium sp. Monte Rotaro [9]. A maximum-likelihood tree obtained for the rbcL gene did not provide sufficient resolution, as Long Branch attraction persisted for the rbcL gene Cyanidium sp. Atacama (data not shown). It has been previously reported that, in the Cyanidiales, ribosomal sequences are more conserved than that of the rbcL gene sequences [9, 45, 46] and that rbcL gene sequences are known to be subjected to higher rates of sequence evolution, leading to saturation events precluding sufficient resolution in single-gene and even combined-genes approaches [21, 22, 45, 46]. This discrepancy may be explained by the lateral transfer of the rbcL gene [45]. Nevertheless, both the transmission electron microscopy and molecular data presented in this paper support the contention that a species of Cyanidium inhabits this Atacama cave. Although Schwabe [41] reported a species which he, based on morphology, proposed as belonging to the Cyanidium genera, it was found in two caves on the central coast of Chile located over 1,300 km south of the Atacama cave. It is known that, under the microscope, species of red algae are difficult to identify based on morphology alone [38]. In particular, species of the genera Cyanidium and Galdieria are indistinguishable [15, 37]. On the other hand, a high level of sequence divergence is systematically observed among Cyanidiales species with the partitioning of taxa, allopatric divergence, and speciation based on environmental conditions, suggesting that new species diverge after longterm geographic isolation [9, 45, 49]. Thus, considering the distant latitudes, it is likely that the species described in this work and that reported by Schwabe are not the same. This is consistent with the discrepancies found for the rbcL gene molecular data reported in this work. Schwabe did not provide more specific coordinates of the exact location of the caves he studied, but efforts are now being made to locate them, allowing future comparisons..
(10) 494. As for the general water environment internal and external to the cave, water relations are critical and probably the most limiting factor for life in the hyperarid Atacama desert. The coastal area where the cave is located is exposed to fogs that usually arrive at late afternoon and night. Although their influence as a source of water for the cave Cyanidium biofilms cannot be dismissed, the more direct and constant influence of the nearby ocean spray and mist probably accounts for the long-term most stable humid environment inside the cave. The presence of the seawater at the cave entrance does not seem to create a differential bottom to entrance water gradient inside the cave since RH is homogenously high along the cave interior (Table 1). Since high humidity values (89%) were measured inside the cave after midday of clear days, it may be assumed that these are the minimum humidity values encountered at this location. Thus, the possible condensation of periodical fogs inside the cave at night should not have an appreciable impact on biofilm development in its interior. Interestingly, the habitat description of the caves further south made by Schwabe [41] on this matter is almost identical to the reported site in this work: “The air at the observed locations exhibit continuously high moisture. The site however show only moderate damp to dry areas and apparently does not seem to be under continuing water coverage.” Also, the habitat description on terms of the light conditions made by Schwabe [41] is again identical to the one described in this work: “the best development was found several meters from the cave entrance, at the walls and ceilings. However, areas exposed to the light (cave entrance) show no growth”. This may be understood if the relatively low temperatures and high light conditions of the areas close to the entrances of the cave are taken into consideration. It is well known that the concurrence of these two conditions determine an important stress upon the photosynthetic machinery [31], causing the production of highly deleterious reactive oxygen species and photoinhibition. In our case, we observe a sharp transition in the presence of Cyanidium biofilms in relation to the availability of light. As seen in Fig. 2d, only the entrancefacing side of a rock located on the ground shows biofilm development. A similar transition is also observed from the western to the eastern wall. Even at places where PPFD values reach 1 μmol m−2 s−1, Cyanidium biofilms can still be observed. However, as soon as no light is measured at the eastern wall, Cyanidium biofilms are no longer detected. To find areas with only one photosynthetic species inhabiting a cave where water availability seems not to be the limiting factor could be explained by the very low light levels found towards the bottom, which could be preventing the sustained growth of other species of phototrophs. Thus, at the bottom of the cave, only Cyanidium. A. Azúa-Bustos et al.. biofilms can be found due to their highly efficient photosynthetic machinery, which in turn may not be able to cope with the higher levels of light found closer to the entrance. It would be interesting to understand the mechanisms of photosynthetic quantum efficiency of this type of cave Cyanidium. Near the cave entrances, the higher light levels may allow the colonization of the walls by other phototrophic microorganisms which may outcompete the growth of the Cyanidium biofilms. In fact, we do observe the appearance of cyanobacteria on the walls directly in front of the entrances but not at the bottom of the cave where the Cyanidium biofilm are located. Finally, our findings could be placed in an astrobiological context of a Martian cave [8, 13, 23], where a hypothetical phototrophic microorganism like the reported cave Cyanidium could be found inside a cave well protected from the harsh outside conditions using minimum photon flux levels coming from a nearby entrance, but high enough for enabling the photosynthetic processes critical for survival. Acknowledgments This work was supported by the Millennium Institute of Fundamental and Applied Biology (Chile). We also thank the members of Rafael Vicuña’s Laboratory for critical comments and insights which helped to improve this manuscript. Disclosure Statement No competing financial interests exist in connection with the submitted manuscript. This applies to all authors of this paper.. References 1. Albertano P, Ciniglia C, Pinto G, Pollio A (2000) The taxonomic position of Cyanidium, Cyanidioschyzon and Galdieria: an update. Hydrobiologia 433:137–143 2. Antonopoulou S, Oikonomou A, Karantonis HC, Fragopoulou E, Pantazidou A (2002) Isolation and structural elucidation of biologically active phospholipids from Scytonema julianum (Cyanobacteria). Biochem J 367(Pt 1):287–293 3. Antonopoulou S, Karantonis HC, Nomikos T, Oikonomou A, Fragopoulou E, Pantazidou A (2005) Bioactive polar lipids from Chroococcidiopsis sp. (Cyanobacteria). Comp Biochem Physiol Part B Biochem Mol Biol 142:269–282 4. Bao H, Gu B (2004) Natural perchlorate has a unique oxygen isotope signature. Environ Sci Technol 38:5073–5077 5. Barr TC Jr (1968) Cave ecology and the evolution of troglobites. Evol Biol 2:35–102 6. Barton H, Northup D (2007) Geomicrobiology in cave environments: past, current and future perspectives. J Caves Karst Stud 69:163–178 7. Bellezza S, Albertano P, de Philippis R, Paradossi G (2006) Exopolysaccharides of two cyanobacterial strains from Roman Hypogea. Geomicrobiol. J 23(5):301–310 8. Boston PJ (1999) The search for extremophiles on Earth and “beyond”: what is extreme here may be just business-as-usual elsewhere. Ad Astra 11(1):40–44 9. Ciniglia C, Yoon HS, Pollio A, Pinto G, Bhattacharya D (2004) Hidden biodiversity of the extremophilic Cyanidiales red algae. Mol Ecol 13(7):1827–1838.
(11) Atacama Cave Cyanidium 10. Cockell CS, McKay CP, Warren-Rhodes K, Horneck G (2008) Ultraviolet radiation-induced limitation to epilithic microbial growth in arid deserts-dosimetric experiments in the hyperarid core of the Atacama Desert. J Photochem Photobiol B 90(2):79–87 11. Doemel WN, Brock TD (1970) The upper temperature limit of Cyanidium caldarium. Arch Mikrobiol 72(4):326–332 12. Dose K, Bieger-Dose A, Ernst B, Feister U, Gómez-Silva B, Klein A, Risi S, Stridde C (2001) Survival of microorganisms under the extreme conditions of the Atacama Desert. Orig Life Evol Biosph 31(3):287–303 13. Ellery A, Kolb C, Lammer H, Parnell J, Edwards H, Richter L, Patel M, Romstedt J, Dickensheets D, Steele A, Cockell C (2003) Astrobiological instrumentation for Mars—the only way is down. Int J Audiol 1:365–380 14. Faimon J, Telcla J, Kubeováb S, Zimákc J (2003) Environmentally acceptable effect of hydrogen peroxide on cave “lamp-flora”, calcite speleothems and limestones. Environ Pollut 122(3):417–422 15. Ferris MJ, Sheehan KB, Kühl M, Cooksey K, WigglesworthCooksey B, Harvey R, Henson JM (2005) Algal species and light microenvironment in a low-pH, geothermal microbial mat community. Appl Environ Microbiol 71(11):7164–7171 16. Ford T (1984) A comparative ultrastructural study of Cyanidium caldarium and the unicellular red algae Rhodosorus marinus. Ann Bot 53:285–294 17. Friedmann I (1964) Progress in the biological exploration of caves and subterranean waters in Israel. Int J Speleol 1:29–33 18. Glavin DP, Cleaves HJ, Schubert M, Aubrey A, Bada JL (2004) New method for estimating bacterial cell abundances in natural samples by use of sublimation. Appl Environ Microbiol 70 (10):5923–5928 19. Glöckner G, Rosenthal A, Valentin K (2000) The structure and gene repertoire of an ancient red algal plastid genome. J Mol Evol 51(4):382–390 20. Goguitchaichvili AT, Alva-Valdivia L, Urrutia-Fucugauchi J (2003) Paleomagnetism and Rock-Magnetism of the Jurassic La Negra Formation, Northern Chile: implications for tectonics and volcanic stratigraphy. Int Geol Rev 45(6):563–573 21. Gontcharov AA, Marin B, Melkonian M (2004) Are combined analyses better than single gene phylogenies? A case study using SSU rDNA and rbcL sequence comparisons in the Zygnematophyceae (Streptophyta). Mol Biol Evol 21(3):612–624 22. Gorbushina AA (2007) Life on the rocks. Environ Microbiol 9 (7):1613–1631 23. Grin EA, Cabrol NA, Mckay CP (1998) Caves in the Martian Regolith and their significance for exobiology exploration. Abstract. 29th Annual NASA Lunar and Planetary Science Conference, Houston, Texas 24. Hartley A, Chong G, Houston J, Mather A (2005) 150 million years of climatic stability: evidence from the Atacama Desert, northern Chile. J Geol Soc 162:421–424 25. Houston J, Hartley AJ (2003) The central Andean west-slope rain shadow and its potential contribution to the origin of hyper-aridity in the Atacama Desert. Int J Climatol 23:1453–1464 26. Kiessling P, Senchenkova SN, Ramm M, Knirel YA (2005) Structural studies on the exopolysaccharide from Erwinia persicina. Carbohydr Res 340(11):1761–1765 27. Larkin MA, Blackshields G, Brown NP, Chenna R, McGettigan PA, McWilliam H, Valentin F, Wallace IM, Wilm A, Lopez R, Thompson JD, Gibson TJ, Higgins DG (2007) Clustal W and Clustal X version 2.0. Bioinformatics 23(21):2947–2948 28. Maier RM, Drees KP, Neilson JW, Henderson DA, Quade J, Betancourt JL (2004) Microbial life in the Atacama Desert. Science 306(5700):1289–1290 29. McKay CP, Friedmann EI, Gómez-Silva B, Cáceres-Villanueva L, Andersen DT, Landheim R (2003) Temperature and moisture conditions for life in the extreme arid region of the Atacama. 495. 30.. 31.. 32. 33.. 34. 35.. 36.. 37.. 38.. 39. 40.. 41.. 42. 43.. 44.. 45.. 46.. 47.. 48.. 49.. desert: four years of observations including the El Niño of 1997– 1998. Astrobiology 3(2):393–406 Mercer FV, Bogorad L, Mullens R (1962) Studies with Cyanidium caldarium. I. The fine structure and systematic position of the organism. J Cell Biol 13:393–403 Murata N, Takahashi S, Nishiyama Y, Allakhverdiev SI (2007) Photoinhibition of photosystem II under environmental stress. Biochim Biophys Acta 1767(6):414–421 Nadell CD, Xavier JB, Levin SA, Foster KR (2008) The evolution of quorum sensing in bacterial biofilms. PLoS Biol 6(1):e14 Navarro-González R, Rainey FA, Molina P, Bagaley DR, Hollen BJ, de la Rosa J, Small AM, Quinn RC, Grunthaner FJ, Cáceres L, Gomez-Silva B, McKay CP (2003) Mars-like soils in the Atacama Desert, Chile, and the dry limit of microbial life. Science 302:1018–1021 Northup D, Lavoie H (2001) Geomicrobiology of caves: a review. Geomicrobiol J 18:199–222 Nübel U, Garcia-Pichel F, Muyzer G (1997) PCR primers to amplify 16S rRNA genes from cyanobacteria. Appl Environ Microbiol 63(8):3327–3332 Ott FD, Seckbach J (1994) New classification for the genus Cyanidium Geitler 1933. In: Seckbach J (eds) Evolutionary pathways and enigmatic algae: Cyanidium caldarium (Rhodophyta) and related cells. Kluwer Academic, London, pp 145–152 Pinto G (2007) Cyanidiophyceae: looking back–looking forward. In: Seckbach J (ed) Algae and Cyanobacteria in extreme environments. Springer, Heidelberg, pp 387–397 Robba L, Russell SJ, Barker G, Brodie J (2006) Assessing the use of the mitochondrial cox1 marker for use in DNA barcoding of red algae (Rhodophyta). Am J Bot 93:1101–1108 Sarbu SM, Kane TC, Kinkle B (1996) A chemoautotrophically based cave ecosystem. Science 272:1953–1955 Saunders GW, Hommersand M (2004) Assessing red algal supraordinal diversity and taxonomy in the context of contemporary systematic data. Am J Bot 91:1494–1507 Schwabe GH (1936) Über einige Blaualgen aus dem mittleren und südlichen Chile. Verhn Deutsch Wiss Ver Santiago de Chile NF (Valparaiso) 3:113–174 Seckbach J (1994) The first eukaryotic cells—acid hot-spring algae. J Biol Physics 20:335–345 Skelley AM, Scherer JR, Aubrey AD, Grover WH, Ivester RH, Ehrenfreund P, Grunthaner FJ, Bada JL, Mathies RA (2005) Development and evaluation of a microdevice for amino acid biomarker detection and analysis on Mars. Proc Natl Acad Sci U S A 102(4):1041–1046 Smith T, Olson R (2007) A taxonomic survey of lamp flora (Algae and Cyanobacteria) in electrically lit passages within Mammoth Cave National Park, Kentucky. Int J Speleol 36 (2):105–114 Toplin JA, Norris TB, Lehr CR, McDermott TR, Castenholz RW (2008) Biogeographic and phylogenetic diversity of thermoacidophilic Cyanidiales in Yellowstone National Park, Japan, and New Zealand. Appl Environ Microbiol 74(9):2822–2833 Vogl C, Badger J, Kearney P, Li M, Clegg M, Jiang T (2003) Probabilistic analysis indicates discordant gene trees in chloroplast evolution. J Mol Evol 56(3):330–340 Walker JJ, Spear JR, Pace NR (2005) Geobiology of a microbial endolithic community in the Yellowstone geothermal environment. Nature 434(7036):1011–1014 Warren-Rhodes KA, Rhodes KL, Pointing SB, Ewing SA, Lacap DC, Gómez-Silva B, Amundson R, Friedmann EI, McKay CP (2006) Hypolithic cyanobacteria, dry limit of photosynthesis, and microbial ecology in the hyperarid Atacama Desert. Microb Ecol 52(3):389–398 Whitaker RJ (2006) Allopatric origins of microbial species. Philos Trans R Soc Lond B Biol Sci 361(1475):1975–1984.
(12) 496 50. Wierzchos J, Ascaso C, McKay CP (2006) Endolithic cyanobacteria in halite rocks from the hyperarid core of the Atacama Desert. Astrobiology 6(3):415–422 51. Wynne JJ, Titus TN, Chong G (2008) On developing thermal cave detection techniques for Earth, the Moon and Mars. Earth Planet Sci Lett 272:240–250 52. Xiao S, Knoll AH, Yuan X, Pueschel CM (2004) Phosphatized multicellular algae in the Neoproterozoic Doushantuo Formation, China, and the early evolution of florideophyte red algae. Am J Bot 91(2):214–227. A. Azúa-Bustos et al. 53. Yin H, Cao L, Xie M, Chen Q, Qiu G, Zhou J, Wu L, Wang D, Liu X (2008) Bacterial diversity based on 16S rRNA and gyrB genes at Yinshan mine, China. Syst Appl Microbiol 31:302–311 54. Yoon HS, Hackett JD, Pinto G, Bhattacharya D (2002) The single, ancient origin of chromist plastids. Proc Natl Acad Sci USA 99:15507–15512 55. Yoon HS, Müller KM, Sheath RG, Ott FD, Bhattacharya D (2006) Defining the major lineages of red algae (Rhodophyta). J Phycol 42:482–492.
(13)
Figure
+3
Documento similar
Astrometric and photometric star cata- logues derived from the ESA HIPPARCOS Space Astrometry Mission.
Therefore, considering that the distribution of compact and large H II regions does not seem to depend on the galactocentric radius, that the observed scatter in metallicity is due
Evaluation should not only be an act leading to giving the student a final grade but also a process to motivate and guide the learning of both teachers and students (evaluation
% in terms not only of anatase support properties but also by the degree of (geometrical) interaction of the alien species and titania and thus in terms of geometrical
If certification of devices under the MDR has not been finalised before expiry of the Directive’s certificate, and where the device does not present an unacceptable risk to health
As seen previously on subsection 3.3.1 the storms were characterized and classified based on the storm energy content, which was acquired using a combination of wave height
They also do not seem to have the necessary support from health- care professionals in light of the low number of behavioral change interventions prescribed in the clinical records
Government policy varies between nations and this guidance sets out the need for balanced decision-making about ways of working, and the ongoing safety considerations
