Hierarchical multiple output gaussian processes for human motion data
Texto completo
Figure


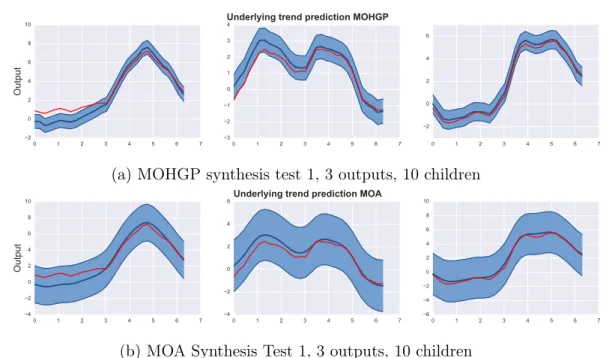
![Figure 3: Ilustration of a Multiple Output Hierarchical GP based on [1]. Top: The vector valued funcion g n (t) is the underlying trend(parent) followed by the f nr (t) replicate (children) sample versions deviating with a small variance and some noise](https://thumb-us.123doks.com/thumbv2/123dok_es/2736921.540225/23.918.197.735.167.758/ilustration-multiple-hierarchical-underlying-followed-replicate-children-deviating.webp)

Documento similar
For this evaluation process, a preliminary vertical scaling system for this Monitoring platform is proposed, based on the results obtained in the previous tests as training data,
The expansionary monetary policy measures have had a negative impact on net interest margins both via the reduction in interest rates and –less powerfully- the flattening of the
Jointly estimate this entry game with several outcome equations (fees/rates, credit limits) for bank accounts, credit cards and lines of credit. Use simulation methods to
In our sample, 2890 deals were issued by less reputable underwriters (i.e. a weighted syndication underwriting reputation share below the share of the 7 th largest underwriter
The RT system includes the following components: the steady state detector used for model updating, the steady state process model and its associated performance model, the solver
In Figure 72, we show a simple model of an escalation process in response operations based on data form both case studies, Elbe Flood and Schiphol Fire.. The model is an
In this paper we estimate a demand for private medical services equation based on the tradition of the Grossman´s model of demand for health using data for a panel of
A comparison between the averaged experimental data obtained with the predicted results from numerical simulation is done for the validation of the model. In table 2, data from


