Impaired intestinal sugar transport in cirrhotic rats correction by low doses of insulin like growth factor I
8
0
0
Texto completo
(2) October 1997. IGF–I AND ABSORPTION IN CIRRHOSIS 1181. Liver cirrhosis was induced by CCl4 inhalation25 over 11 weeks in male Wistar rats weighing Ç160–170 g. Phenobarbital (Luminal; Bayer, Leverkusen, Germany) was added to drinking water (400 mg/L) beginning 1 week before the first CCl4 exposure.25,26 Four groups of age-matched rats were included in this study. In two groups, liver cirrhosis was induced as mentioned; 1 week after stopping CCl4 administration (day 0 of the experimental period), animals were treated with either saline (group CI) or IGF-I subcutaneously (2 mgr100 g body wt01rday01) (group CI / IGF) for 2 weeks. Two other groups were used as healthy controls; one of them (CO group) received saline, and the other was treated with IGF-I (CO / IGF) at the same doses as CI / IGF over the 2 weeks. On day 0 of the experimental period, blood (6 mL) from retroocular plexus was collected from 10 controls (CO) and 20 cirrhotic rats. At the end of the experimental period (day 15), animals were killed, blood samples were taken, and jejunum, liver, and spleen were dissected and weighed. Liver samples were taken for histological examination, and samples of jejunum were collected for functional and histological studies. In 32 rats (8 from each group), intestinal absorption of Dgalactose was assessed by using everted jejunal rings. In addition, kinetic analysis of the sugar transport was performed in 36 rats (12 of each group CO, CI, and CI / IGF) using purified brush border membrane vesicles (BBMVs).. Biochemical Determinations Serum levels of albumin, total proteins, glucose, cholesterol, bilirubin, alkaline phosphatase, and aspartate and alanine transaminases (AST and ALT) were determined by routine laboratory methods using a Hitachi 747 autoanalyzer (Boehringer-Mannheim, Germany). Insulin was measured by radioimmunoassay using a commercial kit (Insik-5; Sorin Biomedica, Saluggia, Italy).. Uptake of D-Galactose by Everted Jejunal Rings The incorporation of labeled D-galactose into everted jejunal rings was determined as described by Crane and Mandelstan.27 Briefly, the procedure involved the following steps. After animals were killed, a portion (20 cm) of the jejunum was quickly excised and rinsed with an ice-cold saline solution containing 140 mmol/L NaCl, 10 mmol/L KHCO3 , 0.4 mmol/ L KH2PO4 , 2.4 mmol/L K2HPO4 , 1.2 mmol/L CaCl2 , and 1.2 mmol/L MgCl2 (pH 7.4). Three pieces of intestine, forming closed and everted intestinal rings and weighing Ç50 mg each, were incubated for 30 minutes at 377C and gassed continuously (95%O2 /5%CO2 ) in the mentioned buffer containing 2.0 mmol/L D-galactose, 0.1 m Ci/10 mL of radioactive D-galactose (sp act, 50–60 mCi/mmol; Amersham Radiochemical Center, London, England), and 1 mCi/10 mL of tritium-labeled polyethylene glycol ([3H]PEG-4000; Merck, Darmstadt, Germany). [3H]PEG-4000 was used as a marker for extracellular water.28 At the end of the incubation, tissues were washed in ice-cold saline solution, blotted carefully to remove excess. / 5E21$$0011. 09-16-97 18:35:16. gasa. moisture, weighed wet, and extracted by shaking for 24 hours in 100 mmol/L HNO3 (0–47C). The tissue was then dried at 1107C for at least 48 hours and weighed. Radioactivity was determined by a liquid scintillation counting in a Wallac 1409 (Pharmacia, Turku, Finland). Values are expressed in micromoles of D-galactose per milliliter of intracellular water.. Preparation of BBMVs and Uptake Kinetics of D-Galactose BBMVs were prepared using an Mg2/-precipitation method with some modifications.29 The procedure was performed at 0–47C. The everted jejunum was placed in 2 mmol/ L Tris-HCl (pH 7.4) containing 100 mmol/L mannitol and stirred for 3 minutes (Vibro-mixer, E-1; Sorvall, Dupont, Wilmington, DE), and the scraped jejunal mucosa was removed. The mucosal suspension, mixed with 10 mmol/L MgCl2 (final concentration), was centrifuged three times at 10,000g (for 15 minutes, obtaining supernatant), 26,000g (for 30 minutes, taking the pellet), and 26,000g (for 30 minutes). This final pellet was resuspended in the desired volume of 300 mmol/L mannitol, 0.1 mmol/L MgSO4 , and 10 mmol/L Tris-HEPES buffer (pH 7.4; load solution) to give a final protein concentration of 8–10 mg/mL. Isolated membranes were circled by using a 27-gauge needle. The specific activity of the brush border marker enzyme sucrase (EC 3.2.1.48) was determined in BBMV suspension,30 and its enrichment was found to be 10.5 { 1–fold greater than that of the initial mucosal suspension. The protein content of the BBMVs was determined according to the method of Bradford.31 Vesicles were stored in liquid nitrogen. The study of the kinetics of D-galactose uptake by BBMVs was performed at 377C by following a rapid filtration technique32 with some modifications. Five microliters of BBMV suspension was added to 45 mL of a medium containing 0.5 mmol/L galactose, 2 mCi/mL [14C]galactose, 100 mmol/L NaSCN or KSCN, 100 mmol/L mannitol, 0.1 mmol/L MgSO4 , and 10 mmol/L HEPES (pH 7.4). At the stated times, the incubation was stopped by the addition of 5 mL of ice-cold stop solution containing 150 mmol/L KSCN, 0.25 mmol/L phlorhizin, and 10 mmol/L Tris-HEPES (pH 7.4). The suspension was inmediately poured onto a prewetted Millipore filter that was washed three times with 3 mL of ice-cold stop solution, dissolved in 5 mL of scintillator Hisafe 3 (LKB Products, Broma, Sweden) and counted in a Counter Wallac 1409 (Pharmacia). Unspecific binding to the filter was previously measured and subtracted from the uptake data. Values are expressed in picomoles of substrate per milligram of protein.. Histology, Electron Microscopy, and Immunohistochemistry Conventional histological techniques for optical and electron microscopy were used to examine samples of liver and jejunum. In both studies, four fields from each animal were evaluated twice by two different observers, and the length of microvilli and villi was recorded. The arithmetical mean of the two scores was taken as the final measurement.. WBS-Gastro.
(3) 1182 CASTILLA–CORTAZAR ET AL.. GASTROENTEROLOGY Vol. 113, No. 4. Immunohistochemical staining of SGLT-1 in paraffin sections (4 mm) was performed with modifications using an avidin-biotin peroxidase technique as described by Shu et al.33 SGLT-1 epitopes masked by fixation were revealed by antigen retrieval by heating the sections in citric buffer (pH 6) in a 700-W microwave oven for 40 minutes. Polyclonal anti– SGLT-1 serum (diluted 1:1000) was kindly donated by Prof. E. M. Wright (Los Angeles, CA).22 Negative controls were performed by omission of any of the layers of the immunohistochemical protocol or omission of antigen retrieval procedure and also by using nonimmune mouse serum as the first layer. The intensity of SGLT-1 staining was measured using a the Visilog 4.1.5 Image Analysis System (Noesis S.A., Vélizy, France). Images were captured with the help of a JVC CCD Camera (TK-970E; Imaging Research, Quebec, Canada) and processed by a Magi/ RGB Matrox digital System (Matrox Electronic System, Quebec, Canada). The computer calculated the gray intensity, assuming 0 arbitrary units of color intensity as white and 255 as black. In each slide, 25 similar brush border fields were randomly measured, and the arithmetical mean was calculated.. Western Blot Analysis of BBMVs BBMVs (50 mg) were solubilized in a buffer containing 5% sodium dodecyl sulfate (SDS) and separated on a 10% SDS-polyacrylamide. Proteins were transferred electrophoretically to nitrocellulose filters for 2 hours at a constant current of 370 mA/cm2, and nonspecific sites were blocked by incubation for 2 hours at room temperature with Tris-buffered saline containing 0.1% Tween 20 (TBS-T) and 5% fat-free milk. The filters were then incubated with polyclonal anti–SGLT1 antibody (1:1000) for 16 hours at 47C. Afterwards, filters were washed (21 15 minutes) with TBS-T, incubated with an ass anti-rabbit IgG biotinylated antibody (1:500) (Amersham International, Buckinghamshire, England) for 2 hours at room temperature, and washed with TBS-T. The filters were treated with an avidin-biotin peroxidase complex diluted 1:50 in TBS-T and then washed again with TBS-T. The filters with horseradish peroxidase conjugates were incubated with 3,3*diaminobenzidine tetrahydrochloride in hydrogen peroxidase. Finally, the filters were washed with water and dried. Photographs from filters were obtained and quantified using a SHARP JX-325 high-resolution color scanner with a computer COMPAR Prolinea 4/66 (Pharmacia).. Statistical Analysis Data are expressed as means { SEM. To assess the homogeneity among groups, the Kruskall–Wallis test was used, followed by multiple post hoc comparisons using Mann– Whitney U tests with Bonferroni adjustment. Any P value of õ0.05 was considered to be statistically significant. Calculations were performed using the SPSSW (SPSS Inc., Chicago, IL) in program version 6.0. The Sigma Plot Program (version 3.02 for PC) was used to process data of the kinetics of Dgalactose uptake by BBMVs.. / 5E21$$0011. 09-16-97 18:35:16. gasa. Table 1. Biochemical Data in Healthy Control Rats and in Rats Exposed to CCl4 Healthy control rats (n Å 10) AST (IU/L) ALT (IU/L) Glycemia (mg/dL) Albumin (g/dL) Total proteins (g/dL) Cholesterol (mg/dL) Alkaline phosphatase (IU/L) Bilirubin (mg/dL). 37 19 192 3.4 6.5 82 283 0.40. { { { { { { { {. 3.3 2 7 0.03 0.08 4.1 17 0.04. Rats exposed to CCl4 (n Å 20) 290 273.5 116 2.9 6.0 115 703 1.21. { { { { { { { {. 40a 49.4a 5a 0.22b 0.17b 4.9a 140b 0.33b. NOTE. In the CCl4 group, values correspond to day 0 of the study (7 days after completion of the 11-week protocol for the induction of cirrhosis). a P õ 0.001, controls vs. CCl4-exposed animals. b P õ 0.05, controls vs. CCl4-exposed animals.. Results One week after completion of the 11 weeks of induction of cirrhosis (day 0 of the experimental period), rats that had received CCl4 showed altered biochemical values indicating the presence of liver damage and diminished hepatic biosynthetic functions (Table 1). Histological examination at the end of the study (day 15 of the experimental period) confirmed the presence of cirrhosis in all animals that had received CCl4 (CI and CI / IGF groups). At that point, glucose levels were significantly reduced in CI rats (161.5 { 6.4 mg/dL) compared with both the CO (199.4 { 7.5 mg/dL) and CI / IGF (189.7 { 10.9 mg/dL) groups (P õ 0.005 for both comparisons). At the end of the study, body weight had decreased and the weight of the spleen was greater in the two groups of cirrhotic animals compared with controls (Table 2). Cirrhotic animals showed mild or absent ascites. Absorption of D-Galactose by Everted Jejunal Rings The study of D-galactose absorption by everted jejunal rings showed a significant decrease in intestinal sugar absorption (1.55 { 0.025 mmol/mL intracellular water) in CI rats compared with CO (2.34 { 0.04; P õ 0.001), whereas CI / IGF-I showed values similar to those in controls and significantly higher values than in CI animals (2.18 { 0.02; P Å NS vs. CO and P õ 0.001 vs. CI). Healthy rats treated with IGF-I (CO / IGF-I) showed values of D-galactose incorporation (2.24 { 0.03) similar to those found in untreated controls (CO). No changes in compartmental water levels were observed among the different groups of animals (CO, 0.76 { 0.01; CO / IGF, 0.76 { 0.01; CI, 0.74 { 0.02; CI / IGF, 0.75 { 0.01 mL intracellular water/g wet WBS-Gastro.
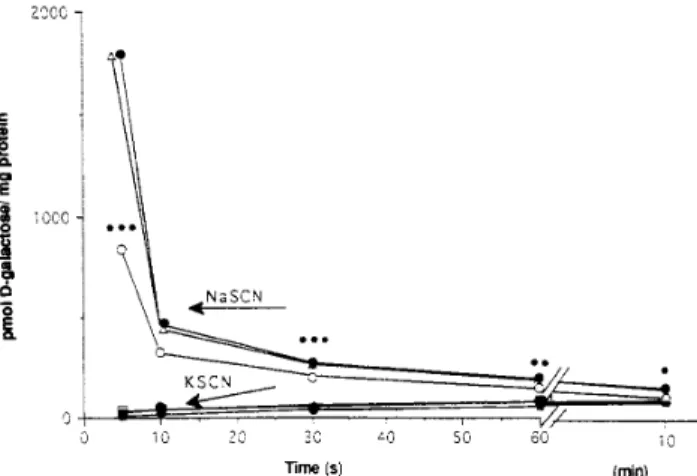
(4) October 1997. IGF–I AND ABSORPTION IN CIRRHOSIS 1183. Table 2. Body Weight and Weight of Liver, Spleen, and Testis in Each Group of Animals CO / IGF (n Å 8). CO (n Å 20) Body wt (g) Jejunum Liver Spleen. 545 0.59 2.99 0.15. { { { {. 14 0.02 0.07 0.01. 539 0.61 2.83 0.15. { { { {. 18 0.03 0.05 0.00. CI (n Å 20) 460 0.61 3.59 0.33. { { { {. 12a 0.02 0.15 0.04a. CI / IGF (n Å 20) 458 0.65 3.50 0.30. { { { {. 9a 0.03 0.18 0.03a. NOTE. Weight of jejunum, liver, and spleen measured per 100 g body weight. a P õ 0.001 vs. both control groups.. tissue; P Å NS). Because IGF-I treatment at these doses did not influence galactose absorption in healthy animals, other studies to analyze sugar transport were performed only in the CO, CI, and CI / IGF groups. D-Galactose Uptake by BBMVs. Figure 1 shows the uptake of galactose by BBMVs in the presence or absence of a sodium gradient. In the absence of a sodium gradient, the incorporation of sugar to BBMVs was negligible, but in the presence of a sodium gradient, sugar uptake was very rapid, reaching 1770 { 51, 1668 { 39, and 756 { 28 pmol/mg protein at 3 seconds in CO, CI / IGF, and CI rats, respectively. Maximal incorporation of galactose to BBMVs was at 5 seconds. At that point, galactose uptake in controls was 18-fold higher than at minute 10 (when an equilibrium was reached between galactose concentrations inside and outside vesicles). In the presence of a sodium gradient, galactose uptake by BBMVs at 5 seconds was significantly reduced in CI animals compared with CO (P õ. Figure 1. Time course of D-galactose uptake into BBMVs with (in the presence of NaSCN) or without (in the presence of KSCN) N/ gradient. Each point represents the mean (SE was õ10%) of three different experiments using a pool of BBMVs from 12 animals from each group. Points corresponding to 5 seconds represent maximal uptake. Values at 3 seconds are not represented. 1770 { 51, 1668 { 39, and 756 { 28 pmol/mg in CO (●), CI / IGF (n), and CI (s) animals, respectively. *P õ 0.05, ** P õ 0.01, ***P õ 0.001, CI vs. CO and CI / IGF groups.. / 5E21$$0011. 09-16-97 18:35:16. gasa. 0.001). In contrast, BBMVs from CI / IGF rats showed values of D-galactose uptake similar to those in CO and significantly higher than in CI (P õ 0.001; Figure 1). To analyze the kinetics of D-galactose uptake by BBMVs, vesicles were incubated in the presence of increasing concentrations of substrate, from 0.05 to 10 mmol/L, for 3 seconds. Data are shown in Figure 2, in which each point represents the mean of three determinations for a given concentration of the substrate, using a pool of BBMVs from the different experimental groups (n Å 12 for each group). The kinetic constants (Kt and Vmax ) of D-galactose uptake by BBMVs showed significant alterations in CI rats compared with CO animals (Kt Å 0.98 { 0.02 mmol/L; Vmax Å 2447 { 40.2 pmolrmg protein01r3 s01 in CI rats; Kt Å 0.66 { 0.01 and Vmax Å 3746 { 26.3 in CO rats; P õ 0.05 and P õ 0.001, respectively). Interestingly, kinetic constants in CI / IGF rats (Kt Å 0.73 { 0.01 and Vmax Å 3664 { 33.6) were not different from those found in CO animals (P Å NS) and were significantly improved compared with CI rats (P õ 0.05, Kt; P õ 0.001, Vmax ). Thus, our results show diminished Vmax and reduced transporter affinity for the substrate in BBMVs from CI animals and a return to normal of these constants in CI / IGF rats.. Figure 2. D-Galactose uptake into BBMVs from CO (●), CI (s), and CI / IGF (n) rats. Each point represents the initial rate of D-galactose uptake obtained from three different experiments for a given substrate concentration using a pool of BBMVs from 12 animals from each group (means; SE was õ10%).. WBS-Gastro.
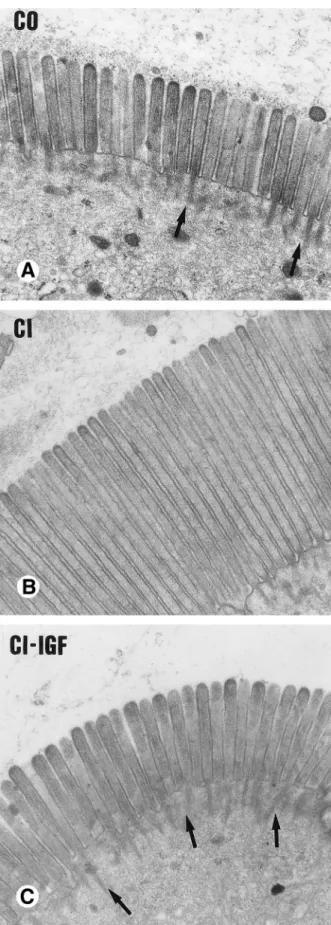
(5) 1184 CASTILLA–CORTAZAR ET AL.. GASTROENTEROLOGY Vol. 113, No. 4. SGLT-1 Expression at the Brush Border To analyze possible changes in the expression of the transporter protein SGTL-1 located at the brush border membrane, we performed immunohistochemical studies in sections of jejunum. Unexpectedly, we found increased immunostaining of SGLT-1 at the brush border of jejunal enterocytes in CI rats (209 { 2 arbitrary units. of color intensity) compared with CO (160 { 2; P õ 0.01) (Figure 3). In CI / IGF rats, the intensity of SGLT-1 staining was intermediate between CO and CI animals (180 { 5 arbitrary units of color intensity; P õ 0.05, labeled CO; P õ 0.01, labeled CI group). To determine the amount of SGLT-1 protein anchored at the membrane of microvilli, we performed Western blot analysis in BBMVs using the same anti–SGLT-1 polyclonal antibody that was used in the immunohistochemical studies. As shown in Figure 4, the amounts of SGLT-1 protein present in BBMVs were similar between the three groups of animals. Morphological Changes in Jejunum Electron-microscopic studies of the jejunal mucosa (Figure 5) showed that the length of microvilli was significantly greater in CI rats than in CO rats (2.87 { 0.33 vs. 1.74 { 0.08 mm; P õ 0.001), whereas in CI / IGF animals the length of microvilli (1.92 { 0.33 mm) was not different from that in controls. Cytoskeletal filaments at the base of microvilli form a more dense framework in CI / IGF and in control animals than in CI rats. A slight, although significant, elongation of villi was also apparent by optic microscopy in CI rats compared with CO rats (1.037 { 0.012 vs. 0.847 { 0.01 mm; P õ 0.001). Villi were of normal length in CI / IGF animals (0.836 { 0.009 mm; P õ 0.001 vs. CI group).. Discussion It has been suggested that, among other factors, altered digestion and absorption of nutrients might play a role in the malnutrition that occurs in liver cirrhosis.5,7 However, malabsorption of a particular nutrient as a result of the failure of a specific intestinal transport system has not been described in cirrhotic patients.. Figure 3. Immunohistochemistry for SGLT-1 in histological sections of jejunum. Increased staining for SGLT-1 can be seen in the untreated cirrhotic rat. (A ) Healthy control, (B ) untreated cirrhotic rat, (C ) IGFI–treated cirrhotic rat.. / 5E21$$0011. 09-16-97 18:35:16. gasa. Figure 4. Western blot for SGLT-1 in BBMVs in the three groups of rats. The apparent molecular masses are indicated at left. Scanning of the bands showed similar optical density values in the three groups of animals (CO, 0.305; CI, 0.343; CI / IGF, 0.297).. WBS-Gastro.
(6) October 1997. IGF–I AND ABSORPTION IN CIRRHOSIS 1185. Figure 5. (A–C) Electron micrographs showing microvilli from jejunal enterocytes in the three experimental groups referred to in Figure 3 (original magnification 16,0001). A marked and significant elongation of microvilli was observed in untreated cirrhotic rats, but microvilli of normal size were found in CI / IGF animals.. / 5E21$$0011. 09-16-97 18:35:16. gasa. The present report shows that sugar absorption is impaired in nonadvanced experimentally induced cirrhosis. This functional defect is accompanied by structural changes in the intestinal mucosa, the most striking of which is the elongation of microvilli. Although a diversity of factors, including portal hypertension and altered liver function, might participate in the genesis of these changes, our results indicate that they may be reversed by IGF-I treatment. IGF-I has been shown to stimulate DNA and protein synthesis in intestinal epithelial cell lines,12 and accumulating evidence indicates that this hormone exerts important trophic activities on the intestine,8,11,34 acting as autocrine and paracrine mediators of gastrointestinal metabolism and growth.10,12,35,36 IGF-I bioavailability, which depends on the levels of both IGF-I and its IGFbinding proteins, has been reported to be reduced in liver cirrhosis.14,15 In the present work, administration of low doses of IGF-I to cirrhotic rats enhanced galactose absorption and reverted the structural changes observed in the intestinal mucosa of cirrhotic rats. As previously noted,18 these low doses do not significantly increase circulating levels of IGF-I in rats with early cirrhosis but induce significant changes in the pattern of IGF binding proteins that are critical modulators of the biological actions of IGF-I.17 In cirrhotic rats, we have shown impaired sugar transport and correction of the defect by IGF-I using both everted jejunal rings and BBMVs. The latter technique revealed decreased Vmax and reduced affinity for the ligand in CI animals. Notably, IGF-I treatment was able to restore these kinetic parameters to normal values. The observation that, despite differences in galactose transport, the amounts of SGLT-1 per milligram of protein in BBMVs were similar in CO, CI, and CI / IGF rats was of interest (Figure 4). On the other hand, hyperexpression of SGLT-1 was found at the brush border of enterocytes in histological sections from CI rats (Figure 3). Although this finding seems paradoxical, comparison of the electron micrographs of the enterocyte brush border (Figure 5) and the immunohistochemistry for SGLT1 (Figure 3) allow the postulation to be made that the strong SGLT-1 immunostaining found in CI animals might be related to increased microvillus length. However, a higher abundance of the transporter at the brush border of cirrhotic animals cannot be excluded. In fact, modifications in the expression of SGLT-1 at the enterocyte brush border have been described in other conditions, such as in hypoglycemia or hyperglycemia.37,39 In our study, microvilli were found to be significantly elongated in CI rats but exhibited normal length in IGF1–treated animals. IGF-I has been shown to induce WBS-Gastro.
(7) 1186 CASTILLA–CORTAZAR ET AL.. GASTROENTEROLOGY Vol. 113, No. 4. marked changes in cell shape and cytoskeletal organization in different cell lines including cardiomyocytes, mesangial cells, adrenal cells, and human epidermoid carcinoma cells.40 – 44 Microvilli consist of fingerlike projections of the cell membrane with a central core formed by a bundle of actin filaments.45 Thus, it seems possible that the effect of IGF-I on microvillus shape and absorptive function is mediated in part by changes in cytoskeletal organization. In fact, the density of actin microfilaments at the base of the microvilli, at the site of connection with the intermediate filaments network, was more prominent in both CI / IGF and controls than in CI rats (arrows in Figure 5). In addition to IGF-I, other hormones, such as glucagon,46 have been shown to stimulate sugar transport at the enterocyte brush border. This effect of glucagon seems to be mediated by adenosine 3*,5*-cyclic monophoshate.46 Future studies are necessary to elucidate the mechanisms through which IGF-I improves sugar absorption in cirrhosis.. 14.. 15.. 16.. 17. 18.. 19. 20. 21. 22.. References 1. Merli M, Riggio O, Romiti A, Ariosto F, Mango L, Pinto G, Savioli M. Basal energy production rate and substrate use in stable cirrhotic patients. Hepatology 1990;12:106–112. 2. McCullough AJ, Tavill AS. Disordered energy and protein metabolism in liver disease. Semin Liver Dis 1991;11:265–277. 3. Romijn JA, Endert E, Sauerwein HP. Glucose and fat metabolism during short term starvation in cirrhosis. Gastroenterology 1991; 100:731–737. 4. Müller MJ, Lautz HU, Plogmann B, Bürger M, Körber J, Schmidt FW. Energy expenditure and substrate oxidation in patients with cirrhosis: the impact of causes, clinical staging and nutritional state. Hepatology 1992;15:782–794. 5. Mezey E. Liver disease and nutrition. Gastroenterology 1978; 74:770–783. 6. Crawford DHG, Ross SW, Halliday JW, Cooksley GWGE, Golding SD, Cheng WSC, Powell LW. Body composition in nonalcoholic cirrhosis: the effect of disease etiology and severity on nutritional compartments. Gastroenterology 1994;106:1611–1617. 7. McCullough AJ. Disorders of nutrition and intermediary metabolism in cirrhosis. In: Rector WG, ed. Complications of chronic liver disease. St. Louis, MO: Mosby, 1992:182–211. 8. Steeb CB, Trahair JF, Read LC. Administration of insulin-like growth factor-I (IGF-I) peptides for three days stimulates proliferation of the small intestinal epithelium in rats. Gut 1995;37:630– 638. 9. Steeb CB, Trahair JF, Tomas FM, Read LC. Prolonged administration of IGF peptides enhances growth of gastrointestinal tissues in rats. Am J Physiol 1994;266:G1090–G1098. 10. Termanini B, Nardi RV, Finan, TM, Parikh I, Korman LY. Insulinlike growth factor I receptors in rabbit gastrointestinal tract. Gastroenterology 1990;99:51–66. 11. MacDonald RS, Park JHY, Thornton WH. Insulin, IGF-1, and IGF2 receptors in rat Small Intestine following massive small bowel resection. Dig Dis Sci 1993;38:1658–1669. 12. Park JHY, Vanderhoof JA, Blackwood, MacDonald RS. Characterization of type I and type II insulin-like growth factor receptors in an intestinal epithelial cell line. Endocrinology 1990;126:2998– 3005. 13. Zhang Y, Wick DA, Seetharam B, Dahms NM. Expression of IGF-. / 5E21$$0011. 09-16-97 18:35:16. gasa. 23. 24.. 25.. 26.. 27.. 28.. 29.. 30.. 31.. 32.. 33.. 34.. 35.. II and IGF binding proteins in differentiating human intestinal Caco-2 cells. Am J Physiol 1995;269:E804–E813. Schimpf RM, Lebrec D, Donadieu M. Somatomedin production in normal adults and cirrhotic patients. Acta Endocrinol 1977; 86:355–362. Hattori N, Kurahachi H, Ikekubo K, Ishihara T, Moridera K, Hino M, Saiki Y, Imura H. Serum growth hormone-binding protein, insulin-like growth factor-I, and growth hormone in patients with liver cirrhosis. Metab Clin Exp 1992;41:377–381. Kiefer MC, Schmid C, Waldvogel M, Schlapfer I, Futo E, Masiarz FR, Green K, Barr PJ, Zapf J. Characterization of recombinant human insulin-like growth factor–binding protein-4, 5, and 6 produced in yeast. J Biol Chem 1993;267:12692–12699. Jones JI, Clemmons DR. Insulin-like growth factors and their binding proteins: biological actions. Endocr Rev 1995;16:3–34. Picardi A, Costa de Oliveira A, Muguerza B, Tosar A, Quiroga J, Castilla-Cortázar I, Santidrián S, Prieto J. Low doses of Insulin-like growth factor–I improve nitrogen retention and food efficiency in rats with early cirrhosis. J Hepatol 1996;24:267–279. Caspary WF. Physiology and pathophysiology of intestinal absorption. Am J Clin Nutr 1992;55:299S–308S. Wright EM. The intestinal Na//glucose cotransporter. Annu Rev Physiol 1993;55:575–589. Hediger MA, Rhoads DB. Molecular physiology of sodium-glucose contransporters. Physiol Rev 1994;74:993–1026. Hirayama BA, Wong Y, Smith, CD, Hagenbuch BA, Hediger MA, Wright EM. Intestinal and renal Na//glucose cotransporters share common structures. Am J Physiol 1991;261:C296–C304. Cheeseman Ch. Role of intestinal basolateral membrane in absorption of nutrients. Am J Physiol 1992;263:R482–R488. National Academy of Sciences. The guiding principles for research involving animals. Washington, DC: National Institutes of Health, 1991. Ariosto F, Riggio O, Cantafora A, Colucci S, Gaudio E, Machelli C, Merli M, Seri S, Capocaccia L. Carbon tetrachloride–induced experimental cirrhosis in the rat. A reappraisal of the model. Eur Surg Res 1989;21:280–286. Chatamra K, Proctor E. Phenobarbitone-induced enlargement of the liver in the rats: its relationship to carbon tetrachloride-induced cirrhosis. Br J Exp Pathol 1981;62:283–288. Crane RJ, Mandelstan P. The active transport of sugars by various preparations of hamster intestine. Biochim Biophys Acta 1960; 45:460–467. Sorribas V, Arruebo MP, Alvarado F, Alcalde AI. Action of robenidine on the intestinal transport and digestion of nutrients in rabbit. Eur J Pharm 1993;248:137–144. Shirazi-Beechey SP, Hirayama BA, Wang Y, Scott D, Smith MW. Ontogenic development of the lamb intestinal Na//glucose cotransporter is regulated by diet. J Physiol 1991;437:699–708. Freeman HJ, Quamme GA. Age-related changes in sodium-dependent glucose transport in rat small intestine. Am J Physiol 1986; 252:208–217. Bradford MM. A rapid and sensitive method for the quantitation of microgram quantities of protein utilizing the principle of proteindye binding. Anal Biochem 1976;72:248–254. Hopfer U, Sigrist-Nelson K, Perrotto J, Isselbacher KJ. Glucose transport in isolated brush border membranes from rat small intestine. J Biol Chem 1973;248:25–32. Shu SY, Ju G, Fan LZ. The glucose oxidase-DAB-nickel method in peroxidase histochemistry of the nervous system. Neurosci Lett 1988;85:169–171. Vanderhoof JA, McCusker RH, Clark R, Mohammadpour H, Blackwood DJ, Harty RF. Truncated and native insulin-like growth factor I enhance mucosal adaptation after jejunoileal resection. Gastroenterology 1992;102:1949–1956. Lund PK, Moast-Staats BM, Hynes MA, Simmons JG, Jansen M, D’Ercole AJ, Van Wyk JJ. Somatomedin-C/insulin-like growth. WBS-Gastro.
(8) October 1997. 36.. 37. 38.. 39.. 40.. 41.. 42.. 43.. 44.. IGF–I AND ABSORPTION IN CIRRHOSIS 1187. factor I and insulin-like growth factor II mRNAs in rat fetal and adult tissues. J Biol Chem 1986; 261:935–939. Laburthe M, Rouyer-Fessard C, Gammeltoft S. Receptors for insulin-like growth factors I and II in rat gastrointestinal epithelium. Am J Physiol 1988; 254:G457–G462. Debnam ES. Rapid adaptation of intestinal sugar transport. News Physiol Sci 1994;9:84–88. Debnam ES, Chowrimootd G. Insulin induced hypoglycaemia and sugar transport across the brush border and basolateral membranes of rat jejunal enterocytes. Eur J Clin Invest 1993;23: 480–489. Burant CF, Flink S, DePaoli AM, Chen J, Lee W-S, Hediger MA, Buse JB, Chang EB. Small intestine hexose transport in experimental diabetes. J Clin Invest 1994;94:578–585. Harder BA, Schaub MC, Eppenberger HM, Eppenberger-Heberhardt M. Influence of fibroblast growth factor (bFGF) and insulin-like growth factor (IGF-I) on cytoskeletal and contractile structures and on atrial natriuretic factor (ANF) expression in adult rat ventricular cardiomyocytes in culture. J Mol Cell Cardiol 1996; 28:19–31. Berfield AK, Raugi GJ, Abras CK. Insulin and IGF-I induce rapid and specific rearrangement of the cytoskeleton of rat mesangial cells in vitro. J Histochem Cytochem 1996;44:91–101. Hornsby PJ, Maghsouldlou SS, Cheng V, Cheng CY. Cyclic AMP– mediated cytoskeletal effects in adrenal cells are modified by serum, insulin, insulin-like growth factor–I, and an antibody against urokinase plasminogen activator. Mol Cell Endocrinol 1989;67:185–193. Kadowaki T, Koyasu S, Nishida E, Sakai H, Takaku F, Yahara I, Kasuga M. Insulin-like growth factors, insulin and epidermal growth factor cause rapid cytoskeletal reorganization in KB cells. J Biol Chem 1986;261:16141–16147. Nishida E, Tobe K, Kadowaki T, Kasuga M, Sato C, Sakai H. Stimulation of the phosphorylation of cytoskeletal 350-kDa and. / 5E21$$0011. 09-16-97 18:35:16. gasa. 300-kDa protein by insulin-like growth factor–I, platelet-derived growth factor and phorbol ester in rat 3Y1 cells. Cell Struct Funct 1988;13:417–423. 45. Lodysh H. Microfilaments: Cell motility and control of cell shape. In: Lodish H, Baltimore D, Berk A, Zipursky SL, Matsudaira P, Darnell J, eds. Molecular cell biology. 3rd ed. New York: Scientific American, 1995:1002–1003. 46. Debnam ES, Sharp PA. Acute and chronic effects of pancreatic glucagon in sugar transport across the brush border and basolateral membranes of rat jejunal enterocytes. Exp Physiol 1993; 78:197–203.. Received February 5, 1997. Accepted June 26, 1997. Address requests for reprints to: Prof. Jesus Prieto, M.D., Department of Medicine and Liver Unit, Clònica Universitaria, Av. Pio XII, s/n, 31080 Pamplona, Spain. Fax: (34) 48-296785. Supported in part by Grant J. Vidal and by Fundació n DANONE (Madrid, Spain). Presented in part at the Congress of Experimental Biology ’96, Washington, D.C., April 1996, and published in abstract form (FASEB J 1996;10:2200 [A380]) and at the 31st Annual Meeting of the European Association for the Study of the Liver, Geneva, Switzerland, August 25–29, and published in abstract form (J Hepatol 1996; 1:64). The authors thank Drs. Anna Sköttner and Jan Holmberg, Kabi Pharmacia, for providing the recombinant human insulin-like growth factor I used in this study; Prof. Ernest Wright, Department of Physiology, UCLA School of Medicine, Los Angeles, California, for donating sodium–glucose/galactose–ligand transporter 1 antibody; Dr. Javier Pardo, Department of Pathology, University of Navarra, for authorized help in histological analysis of samples; and M. P. Redin, I. Ordoqui, B. Irigoyen, A. Urbiola, and C. Chocarro by their expert secretarial and technical assistance.. WBS-Gastro.
(9)
Figure

Documento similar
Menal and Vaserstein showed in [24] that the semilocal rings satisfying the hypotheses of Theorem 2 are precisely those rings A with 2A = A and which contain no factor ring
—We have shown that the absorption of a single, undoped graphene layer can be dramatically enhanced (up to ∼50% in the self-standing configuration) by decorating it with
On standing, further HMF dissolves in oleum as shown by the increase in the absorption bands in the UV (see Figure 6), and the ini- tial featureless long tail absorption starts to
Here, we demonstrate attosecond transient absorption spectroscopy (ATAS) as a viable probe of the electronic and nuclear dynamics initiated in excited states of a neutral molecule by
QM/PCM approach, and absorption spectra in water computed by the full-QM, QM/MMee, and QM/MMpol approaches for pyridine with an inset zooming the first absorption feature
The fragmentation of core ionized uridine cannot be described by the fragmentation of separated uracil and d-ribose dications; the sugar and the base contribute ionic
We have discussed the optical response of general two-band models and have argued that a universal optical conductivity can be defined for two-dimensional systems which are com-
Growth regulation of human colon cancer cells by epidermal growth factor and 1,25-dihydroxyvitamin D 3 is mediated by mutual modulation of receptor expression. The down-regulation
