A new towed platform for the unobtrusive surveying of benthic habitats and organisms
14
0
0
Texto completo
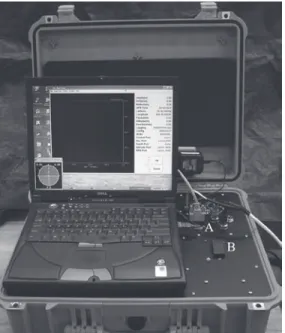
(2) science-based ecosystem-management strategy. In fact, numerous government agencies recently have identified the need for detailed benthic maps (e.g. Florida Oceans and Coastal Resources Council 2007, Puglise and Kelty 2007, U.S. Geological Survey 2007). Such maps, based in part on underwater imagery, assist scientists in characterizing marine resources and provide baseline data for assessing changes in the seascape. Images represent a rich data source, providing fundamental information on the geological characteristics, physical structure, and biological components of a benthic habitat. Details on substrate type, sediment characteristics, and the types of epibenthic organisms can be gleaned from images. When combined with location data and mosaicked, a series of adjacent images can be used to estimate the abundance and distribution of marine resources, the spatial extent of bedform features, and to inventory cultural resources (e.g. Bohnsack 1979, Ballard et al. 2001, Kendall et al. 2005, Morrison and Carbines 2006). Different investigators have employed a variety of approaches for acquiring underwater imagery, including towing divers (Kenyon et al. 2006), using drop/jump cameras (Ewing et al. 1946), dragging sleds along the bottom (Machan and Fedra 1975), towing platforms above the bottom (Blacker and Woodhead 1965), using remotely operated vehicles (Parry et al. 2003), and deploying autonomous underwater vehicles (Singh et al. 2004). Ewing et al. (1946) and Kocak and Caimi (2005) provide historical perspectives and brief reviews of many underwater-imaging technologies. The method adopted by a given investigator is, in part, a function of the scientific objective, the study site, and the cost. To support mapping activities and the ground-truthing of acoustic, lidar, and satellite imagery of submerged coastal environments, the U.S. Geological Survey developed the Along-Track Reef-Imaging System (ATRIS) (Brock et al. 2006). ATRIS is a boat-mounted sensor package that acquires high-resolution, color digital images of shallow-water (<10 m) 52. benthic environments. The basic design consists of a 12-megapixel Nikon D2X camera affixed to a moveable, 2.5-m fiberglass pole with a GPS antenna mounted on top. Each image is geo-located to within 50 cm in real time. In addition, camera-to-seafloor range, water depth, and vessel heading and attitude data are collected for each image. Typically, 1,000 images are captured per hour at a survey speed of 0.5 m · s-1. To date, ATRIS has been used to survey portions of Biscayne National Park (Florida, USA), the Florida Keys reef tract (Florida, USA), Dry Tortugas National Park (Florida, USA), and Buccoo Reef (Tobago) (Nayegandhi, pers. commun.). Greater use of and increased interest in ATRIS have revealed limitations and spawned a “wish list” of new capabilities and functionality. Priority improvements were to extend the operating depth range and increase the imageacquisition rate. Here, we present details on the next-generation towed system, dubbed Deep ATRIS, and results from field tests in the Gulf of Mexico and Biscayne Bay, Florida. MATERIALS AND METHODS Deep ATRIS system description: The overall system consists of three major components, namely the tow vehicle with its instrument payload, the vehicle control module, and the data-acquisition module. The tow vehicle is a Sea Sciences Acrobat™ LTV-50 (Sea Sciences, Inc., Arlington, Massachusetts) outfitted with a custom-designed, stainless-steel instrumentation rack (Fig. 1). As currently configured, the instrument payload includes a proprietary Sea Sciences 3-axis orientation (yaw, pitch, and roll) sensor, pressure sensor, Imagenex model 863 digital altimeter (Imagenex Technology Corp., Port Coquitlam, B.C., Canada), Prosilica GC-1380C gigabit ethernet (GigE) digital camera (Prosilica Inc., Burnaby, B.C., Canada), and custom light-emitting-diode (LED) lights designed and built by the authors. The vehicle plus the instrument payload weigh 45 kg in air and have overall dimensions of 1.3 x 0.25 x 0.63 m.. Rev. Biol. Trop. (Int. J. Trop. Biol. ISSN-0034-7744) Vol. 56 (Suppl. 1): 51-63, May 2008.
(3) Fig. 1. Deep ATRIS tow vehicle equipped with (A) acoustic beacon, (B) 3-axis orientation sensor, (C) altimeter, (D) digital camera, (E) mounting bar for camera and lights (not shown), and (F) ethernet and power distribution module.. The Imagenex altimeter emits a 10° conical beam at 330 kHz, has an operating range of 0.6-30 m with a vertical resolution of 20 mm, and is deployable to a depth of 1,000 m. The high sensitivity of this altimeter is crucial for maintaining the desired vehicle position (see Discussion). The Prosilica GC-1380C camera incorporates a Sony ICX285AQ CCD array containing 1,360 x 1,024 square pixels that are 6.45-µm x 6.45-µm in size. In addition, the camera has a large dynamic range (12 bits · pixel-1) and low power consumption (<4 W). This networkable camera has no capability for data storage. Instead, full-frame, uncompressed images are streamed to a computer at up to 20 s-1 for display and storage. The camera is outfitted with a Navitar 1-in. format, f/0.95, 17-mm focal length, C-mount lens. The angular fields-ofview in the x- and y-directions are 29° and 22°, respectively. Together, this imaging system is a compact package with overall dimensions of 11.9- x 5.1- x 4.1-cm.. This camera is a significant departure from the Nikon D2X used in the original shallowwater ATRIS. Whereas the Nikon has almost nine times as many pixels (4,288 x 2,848), it is considerably larger (27- x 16- x 15-cm), necessitating a larger-diameter underwater housing (33- x 27-cm-diameter). Image acquisition is also significantly slower (0.3 Hz versus 20 Hz). Because Deep ATRIS was designed to acquire overlapping images at a minimum of 6 Hz from a distance of 2 to 4 m, the gains in speed and smaller size were more important than a large pixel count. Moreover, the short imaging distance partially compensates for some of the possible loss of detail due to fewer pixels. The spatial resolution of a Deep ATRIS image is a function of the system geometry, which may be expressed as. Rev. Biol. Trop. (Int. J. Trop. Biol. ISSN-0034-7744) Vol. 56 (Suppl. 1): 51-63, May 2008. tan. l θ = 2d 2. , (1). 53.
(4) where θ is the angular field-of-view, d is the distance of the camera above the bottom, and l is the corresponding distance covered by an image. Solving for l, leads to the expression. l = 2d ⋅ tan. θ 2 , (2). which facilitates computing the spatial resolution of each pixel. For example, at a target distance of 4 m, the horizontal distance spanned by an image is. l = 2 ⋅ 4 ⋅ tan. 29 o = 2.07 m 2. Dividing by 1,360 pixels yields a horizontal spatial resolution of 1.5 mm · pixel-1, providing ample resolution for the intended mapping tasks. Because the pixels are square, the vertical spatial resolution is also 1.5 mm · pixel-1, which can be verified using Equation (2) with the vertical field-of-view of 22° and 1,024 for the number of vertical pixels. Two custom LED lights were built inhouse using high-power white LEDs with a color temperature of 5,500 °K. Each light contains 12 LEDs, each emitting 155 lumens when driven at 3.7 VDC and 1A. A 28° secondary optic and diffuser were placed over individual LEDs to focus and smooth out their beam patterns. Unfortunately, the first prototypes created too much drag and prevented the vehicle from flying properly. A low-profile light assembly is in development. A custom, 100-m tow cable made by Falmat Custom Cable Technologies (San Marcos, California) provides power and datatransmission connections to the Acrobat™. The cable (outside diameter of 1.4 cm) is comprised of a Category-6 ethernet cable, 10 22-gauge conductors, a Kevlar-braid strength member (2,000-pound breaking strength), and a polyurethane protective jacket. The ethernet connection is used to transmit control 54. Fig. 2. The Control and Power Distribution module fits inside a single Pelican case. AC-to-DC power converters and data transmission hardware are secured to the case underneath the laptop. Also visible are (A) the external data and power connections to the tow cable and (B) the manual rocker switch for overriding the wing angle set by the computer.. commands to the vehicle and camera, as well as to send sensor data and images to the shipboard computers. Two of the remaining conductors are used for a serial connection to the vehicle’s wing motor. This serial connection supports the manual override of the wing angle to force the vehicle to ascend/descend, regardless of the software settings (Fig. 2). The Control and Power Distribution module is housed in a single Pelican case (Model 1550, 46.8 x 35.5 x 19.3 cm) containing a PC laptop, power converters, data-transmission hardware, and inputs for depth sounder and multiplexed GPS data streams (Fig. 2). Power supplied to the module is 120 VAC. Control of the Acrobat™ with real-time communications is provided by an application written in JAVA™. This software provides five standard underwater profiles: constant depth, constant altitude above the bottom, constant undulation between two depths, adaptive undulation between a set depth and varying bottom, and maximum number of. Rev. Biol. Trop. (Int. J. Trop. Biol. ISSN-0034-7744) Vol. 56 (Suppl. 1): 51-63, May 2008.
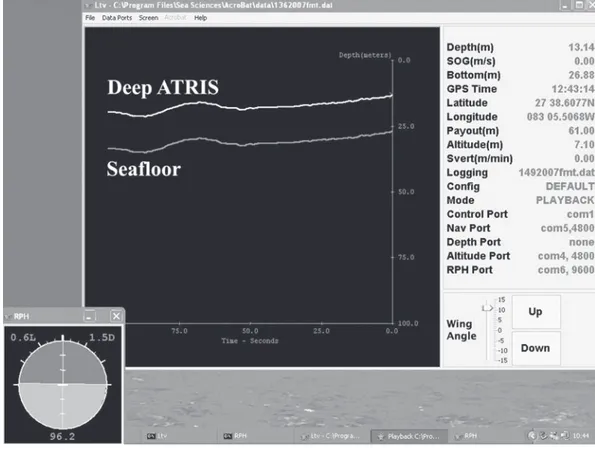
(5) undulations between two survey locations. The externally supplied depth sounder and GPS data are used by the software for determining the tow body position and for adjusting the wing angle in accordance with the chosen tow profile. The user can specify that the altimeter data be used in place of the externally supplied depth soundings. Wing angle is dynamically adjusted in accordance with the selected profile. The control software displays a number of parameters in real time, including boat coordinates, water depth, vehicle depth, and wing angle (Fig. 3). Also shown are a graphical representation of the vehicle’s 3-axis orientation and a continuous strip chart of the water depth and vehicle depth over the most recent 100 s. Two computers accommodate data acquisition. The laptop and software used for vehicle control also log operational parameters,. including depth (water and vehicle), GPS coordinates, vehicle heading, wing angle, altimeter readings, and cable payout length. Image acquisition is supported by a Shuttle XPC SD37P2 computer (Shuttle Computer Group Inc., City of Industry, California) running the Microsoft Windows XP operating system and configured with an Intel Core-2 2.4 GHz CPU, 1 GB RAM, 150 GB IDE hard drive, and two 750 GB SATA-III hard drives. The SATA drives support a transfer rate of 600 MB · s-1 and are set up as a Level 1, mirrored RAID, enabling simultaneous real-time image storage and backup. This configuration was chosen as a hedge against drive failure and allows acquisition to proceed should one drive malfunction. To handle the high transfer rates, an Intel PRO/1000 PT Server Adapter GigE card was added to the Shuttle. This card supports “jumbo frames” of >1,500 bytes. The. Fig. 3. Screen capture of the control software. A number of parameters are displayed in real time, including boat coordinates, water depth, vehicle depth, and wing angle. The continuously updated strip chart conveys the most recent 100 s of both vehicle and water depths. The small window in the lower left provides a graphical representation of the vehicle’s 3-axis orientation.. Rev. Biol. Trop. (Int. J. Trop. Biol. ISSN-0034-7744) Vol. 56 (Suppl. 1): 51-63, May 2008. 55.
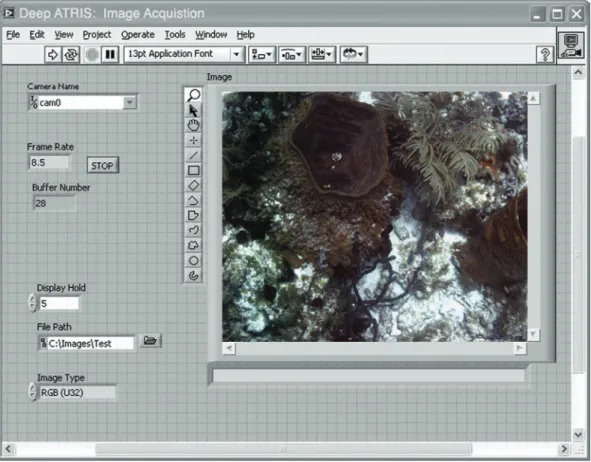
(6) larger the frame size, the less the computer CPU load during the processing of incoming ethernet packets. The card was set to a frame size of 9,000 bytes. The camera control software was developed in-house using LabView™ v8.2 with the Vision Development Module (National Instruments, Austin, Texas, USA) (Fig. 4). The following parameters can be set: Frame rate: Between 1 and 8.5 color images · s-1; 1-20 grayscale images · s-1. Images are stored to the RAID array at this rate. Display rate: The displayed image (Fig. 4) can be updated as fast as the current frame rate or delayed as long as desired. This value has no affect on image storage. Image format: Images may be stored in raw, JPEG, or TIFF formats. The raw format is a non-interpolated, color Bayer pattern (Holst 1998). Each pixel on the. CCD has either a red, green, or blue filter over it, as specified by the Bayer pattern. To create a full-color JPEG or TIFF image, an interpolation algorithm is used to determine values for the missing colors, based on neighboring pixel values for the color in question. To facilitate image mosaicking and other positionrelated processing, GPS data are written into the image header. Specifically, the National Marine Electronics Association standard sentence $GPGGA is used, which provides a GPS timestamp, latitude, longitude, and altitude above mean sea level, among other data. Study sites: The initial field trials were conducted in Florida coastal waters. The first trial took place on 16 May 2007 in the Gulf of Mexico, 30 km offshore of St. Petersburg, FL, USA (27°39’38” – 27°39’41” N, 83° 2’53” – 83° 2’55” W), in 19 m of water depth. The. Fig. 4. Screen capture of the camera control software. A few acquisition parameters can be modified and images are displayed as they are received at the surface. The “display hold” parameter determines how long a given image is displayed.. 56. Rev. Biol. Trop. (Int. J. Trop. Biol. ISSN-0034-7744) Vol. 56 (Suppl. 1): 51-63, May 2008.
(7) seafloor in this area consisted of carbonate rubble and sand with scattered ridges that rose approximately 1 m above the bottom. The ridges contained patches of the algae Acanthophora sp. and Halimeda sp., as well as small coral heads of Oculina sp. and Solenastrea sp., and cup corals. The second field test was conducted on 16 July 2007 west of Pacific Reef in Biscayne National Park, FL, USA (25°21’20” – 25°22’15” N, 80°8’50” – 80°9’50” W) in water depths ranging from 6 to 12m. This region lies at the northern end of the Florida Reef tract and contains patch reefs consisting of massive corals (e.g. Montastraea sp., Siderastrea siderea, and Diploria sp.), octocorals, and associated organisms (e.g. Ginsburg et al. 2001). Deployment: A kellum grip was attached to the Falmat tow cable 46 m from the terminus at the tow vehicle prior to leaving shore. Once on site, Deep ATRIS was lowered overboard and the tow cable paid out until the kellum grip was reached, at which point the grip was attached to a safety tow clutch. Given the constant payout length, the altitude of Deep ATRIS was a function of boat speed and wing angle. Due to the drag problem with the lights, all images were collected under ambient-light conditions with the lens set at an f-stop of 5.6 and a focus distance of 3 m. The corresponding depth-of-field extended from 2.2 to 4.8 m away from the focal point of the lens. For the first field test of the system, Deep ATRIS was deployed with a conservative set of operating parameters. Tow speeds ranged from 0.5-1.5 m · s-1, and altitudes were varied from 3 to 7 m above the bottom. For the duration of the trial, TIFF images were acquired at 8.5 Hz. At the Biscayne Bay location, Deep ATRIS was towed at a nominal speed of 2.6 m · s-1 and an altitude typically 2 to 4 m above the bottom. Acquisition of JPEG images occurred at 5 Hz throughout this trial. Lens distortion correction: A common artifact of using wide-angle lenses is barrel distortion, which magnifies the center portion. of an image with respect to the edges. This radial displacement of image elements makes straight lines appear curved the farther away they are located from the center (Fig. 5A). A point-mapping technique was used to correct the barrel distortion. The pixel coordinates of a subset of grid points are identified from the distorted grid, relative to the center of the image. Knowing the grid spacing, one can compute the proper pixel coordinates for this subset of points in a distortion-free image. Simple linear transformations relate the distorted points to the corresponding corrected points. For each pixel in the distortion-free image, these transformation equations are used to identify a corresponding neighborhood of pixels in the distorted image. An interpolated grayscale value is computed from this collection of pixels and assigned to the rectified pixel location.. Fig. 5. Distorted and corrected calibration image. The wide-angle lens used in Deep ATRIS imparts a barrel distortion (A) in the images. (B) The corrected image after processing with a point-mapping algorithm.. Rev. Biol. Trop. (Int. J. Trop. Biol. ISSN-0034-7744) Vol. 56 (Suppl. 1): 51-63, May 2008. 57.
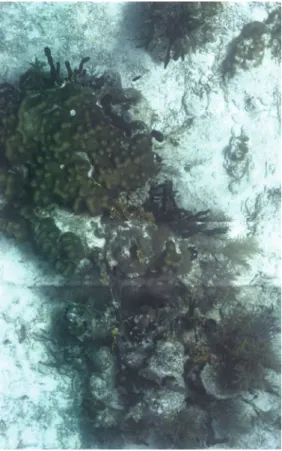
(8) Given a sufficient number of tie points, little if any distortion remains in the resultant image (Fig. 5B). In this case, 99 tie points were sufficient to correct the 1360 x 1024 pixel Deep ATRIS images. The details of this correction procedure are presented in Zawada (2003). Results Operational performance: Overall, Deep ATRIS performed as expected. The ethernet connection between the shipboard computer and the various sensors worked properly. All data transmitted by these sensors were successfully logged, as were software control commands to the vehicle and camera. The manual override also functioned correctly, causing the tow body to ascend/descend regardless of the action prescribed by the control software. Only the constant-altitude-above-the-bottom tow profile was tested because this mode is best suited for the intended benthic-mapping application. Deep ATRIS adjusted its altitude according to changes in seafloor elevation with a response time of ~1 s (Fig. 3). In addition, the logged attitude-sensor (3-axis orientation) data indicated that Deep ATRIS maintained a stable position in terms of yaw (side-to-side motion) and roll (rotation) throughout most of the field trial. Vehicle performance was tested at tow speeds from 0.5 to 2.6 m · s-1. The optimal range was 2.0 to 2.6 m · s-1. At slower speeds, the vehicle was unable to maintain a prescribed depth and sank. There are only two sources of upward forces, namely, lift generated by the wings and buoyancy attributed to cable drag. At speeds of < 2 m · s-1, insufficient lift is generated to overcome downward forces on the vehicle. Sinking was also an issue when making turns, which introduced slack in the tow cable and reduced the lift forces. As a precaution, Deep ATRIS was brought to the surface prior to initiating a turn. Image collection: The custom software functioned correctly, allowing control of exposure settings and acquisition rates (Fig. 4). Images were captured, saved, and archived at 58. rates of 8.5 Hz (test 1) and 5 Hz (test 2). The preview frequency of one image every 5 s proved sufficiently long to inspect the scene. During the initial field tests in the Gulf of Mexico, 8,812 TIFF images were collected in 3 hrs for ~15 km of track lines over and across one of the ridge features. Throughout most of the deployment, Deep ATRIS was 5 m above the bottom. At the Biscayne Bay site, Deep ATRIS captured 29,845 JPEG images in a little over 2 hr for ~14 km of track lines, which covered a mixture of patch reefs, seagrass meadows, coral rubble, and carbonate sand. For the majority of the images, the altitude of Deep ATRIS was in the range of 2 to 4 m. During turns, however, the system was brought to the surface, so a few thousand pictures correspond to imaging distances around 10 m. To illustrate the quality of Deep ATRIS images and the extent of overlap between adjacent images, subsets were assembled into mosaics depicting the different benthic cover present at the study sites (Figs. 6 & 7). All of the images were corrected for lens distortion, but not for the effects of yaw, pitch, or roll of the tow vehicle. The degree of overlap varies as a function of tow speed, vehicle altitude, and image-acquisition rate. A 50% overlap was common for both field tests, which improves mosaic quality and the maps derived from them. Horizontal deviation between adjacent frames was on the order of a few centimeters. An unexpected observation was that animals do not appear to be threatened by the presence of Deep ATRIS. Between successive frames, there is no evidence of abrupt direction changes or wisps of stirred up sand caused by a fleeing animal. Rather, fish and turtles seem to move nonchalantly with little or no regard to the vehicle (Fig. 8). Likely reasons for the lack of alarm are the >2-m separation distance and/ or the non-threatening motion of Deep ATRIS. Discussion The Deep Along-Track Reef Imaging System (Deep ATRIS) was developed to extend the bathymetric and benthic-mapping capabilities. Rev. Biol. Trop. (Int. J. Trop. Biol. ISSN-0034-7744) Vol. 56 (Suppl. 1): 51-63, May 2008.
(9) Fig. 7. A 3-image mosaic of a small patch reef in Biscayne National Park, containing several coral heads, fire coral (Millepora sp.), sponges, and octocorals. Areal coverage is approximately 2.1 m x 3.1 m. Water depth was 4 m, and Deep ATRIS was 4 m above the bottom, i.e. just beneath the surface. The image resolution is 1.5 mm / pixel.. Fig. 6. A 6-image mosaic of the shallow nearshore ridge and adjacent sandy area in the Gulf of Mexico. Areal coverage is approximately 3.6 m x 9 m in size. The ridge is about 1 m higher than the sandy bottom. Water depth was 19 m, and Deep ATRIS was 7 m above the bottom. The image resolution is 3.6 mm / pixel.. of the original shallow-water ATRIS beyond 10 m. Deep ATRIS is built on the Sea Sciences, Inc., Acrobat™ tow body, which is a relatively compact unit deployable from small boats (10. m length) with no need for hydraulic cranes or heavy-duty winches. Among its advantages are its light weight (45 kg in air as configured here), its dynamic vertical positioning, and its straightforward operation. Because of the fixed tow-cable payout length, vertical position varies as a function of boat speed and wing angle. Although Deep ATRIS is capable of operating as deep as 90 m, it is currently limited to ~27 m. Transmission constraints over Ethernet cable impose a 100-m-cable length limit. Switching to a fiber-optic cable would solve the problem. However, the substantial cost of fiber-optic cable, electro-optical converters, and slip rings mandated the use of a wire tow cable. Of the available 100 m, 20 m are kept on the boat to. Rev. Biol. Trop. (Int. J. Trop. Biol. ISSN-0034-7744) Vol. 56 (Suppl. 1): 51-63, May 2008. 59.
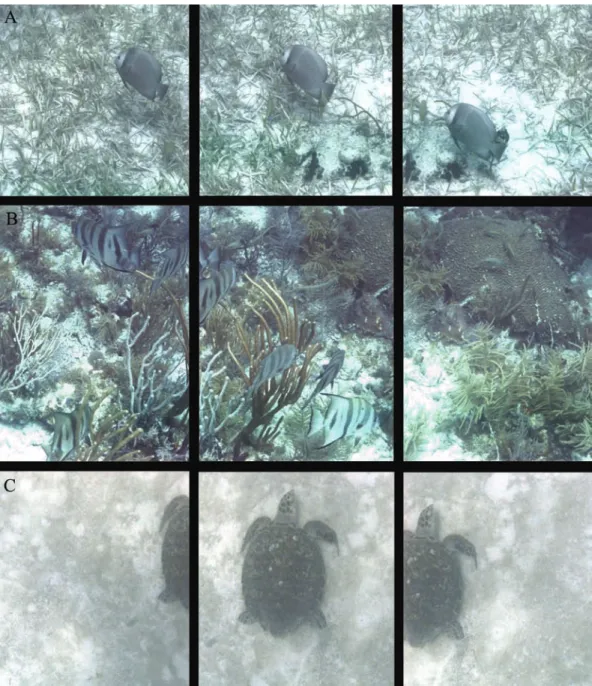
(10) Fig. 8. Animals appear to be indifferent to the presence of Deep ATRIS, as illustrated by these example image sequences. (A) A gray angelfish (Pomacanthus arcuatus) swimming over a seagrass meadow. Each frame is cropped to 0.95 x 0.95 m. Water depth was 8.8 m, and Deep ATRIS was 2.4 m above the bottom. Image resolution is 0.9 mm / pixel. (B) A small school of spadefish (Chaetodipterus faber) is present in the foreground, and several grunts (Haemulon sp.) are hovering above a large brain coral head (Diploria sp.) in the background. Each frame is 0.91 x 1.22 m. Water depth was 9.2 m, and Deep ATRIS was 2.35 m above the bottom. Image resolution is 0.9 mm / pixel. (C) A Hawksbill turtle (Eretmochelys imbricata) apparently resting on the seafloor. Each frame is cropped to 0.55 x 0.90 m. Water depth was 9.2 m, and Deep ATRIS was 2.93 m above the bottom. Image resolution is 1.1 mm / pixel.. 60. Rev. Biol. Trop. (Int. J. Trop. Biol. ISSN-0034-7744) Vol. 56 (Suppl. 1): 51-63, May 2008.
(11) allow for a convenient arrangement of both the cable spool and connections to the control computer, and to provide a reserve as a precaution in the event of a snag. In order to “fly” properly, Deep ATRIS requires a minimum of 3 m of cable to achieve 1 m of depth at a 2.6 m · s-1 tow speed. Thus, the maximum operating depth is 80 / 3 = 26.7 m. To date, Deep ATRIS has been deployed as deep as 19 m. The dynamic vertical positioning capability is a key feature of Deep ATRIS. The wing angle changes depending on the amount of tow cable paid out, the tow speed, the water depth beneath the boat, and the current depth of the vehicle. To avoid collisions, the system needs to respond rapidly to changes in bottom topography. Of the two field trials, the most demanding operational configuration was used at the Biscayne Bay site, which consisted of a 2.6 m · s-1 tow speed and a 46-m-cable payout length. With these settings, the maximum ascent/descent rates were ~30 cm · s-1 and ~19 cm · s-1, respectively, with the wings fully rotated up/down. When positioned at 10 m of water depth (2 m above the bottom), Deep ATRIS was approximately 45 m behind the boat, which meant there were 17 s (45 m / 2.6 m · s-1) available for altitude adjustment from the time the boat passed an obstacle. During this lag time, Deep ATRIS could ascend 5.1 m, a distance more than adequate to cope with the relief changes at this site. The imaging aspect of the field trials was also a success. Despite the lack of auxiliary lighting, water clarity and camera sensitivity were sufficient for capturing detailed images. Spatial resolutions of better than 3 mm · pixel-1 were common (Figs. 6-8). In most instances, taxonomic identification is possible at least to the genus level. Given this degree of detail, coupled with the coincident bathymetric and location data, Deep ATRIS imagery is more than adequate for ground-truthing acoustic and lidar data, as well as classifying habitats. It can be used to estimate a number of ecological parameters, such as percent cover, organism abundance, and species richness. Since fish seem unfazed by the presence of Deep ATRIS. (Fig. 8), there are likely fisheries applications for the imagery in relation to both benthic and demersal species. With periodic coverage over an area of interest, image mosaics would benefit change-detection studies and aid in the monitoring of coral bleaching and subsequent recovery processes. Moreover, the rapid acquisition rate makes Deep ATRIS appropriate for surveying moderately large areas. Total transect lengths of 56 km can be surveyed in a single 6-hr work day. Overall, these initial field tests were successful and provided valuable data about the operating characteristics of the system. Future plans include developing software to automate various processing tasks, such as correcting for vehicle orientation, geo-locating the images, and creating mosaics. This effort will be conducted in parallel with similar work for the shallowwater ATRIS. Hardware improvements include completing the low-profile LED lights and adding a second altimeter, which will be forward looking to enhance the guidance and obstacleavoidance capabilities of Deep ATRIS. Acknowledgments We gratefully acknowledge Dave Wegner, Keith Ludwig, and Lance Thorton at the St. Petersburg, Florida office of the U.S. Geological Survey (USGS) and Jimmy Mulholland of the University of South Florida, St. Petersburg, for their design and fabrication of numerous mechanical components. Richard Curry of Biscayne National Park generously provided assistance with our field investigation. We appreciate the constructive comments of Amar Nayegandhi, Greg Piniak, and one anonymous reviewer, which improved the quality of this manuscript. We also thank the USGS Coastal Marine and Geology Program for funding the development and testing of Deep ATRIS. References to non-USGS products and services are provided for information only and do not constitute endorsement or warranty, expressed or implied, by the U.S. Government, as to their suitability, content, usefulness, functioning, completeness, or accuracy.. Rev. Biol. Trop. (Int. J. Trop. Biol. ISSN-0034-7744) Vol. 56 (Suppl. 1): 51-63, May 2008. 61.
(12) Blacker, R.W. & P.M. Woodhead. 1965. A towed underwater camera. J. Mar. Biol. Assoc. UK. 45: 593-597.. RESUMEN Los mapas de ecosistemas coralinos son necesarios para apoyar muchos objetivos de conservación y manejo, así como actividades de investigación. Algunos ejemplos incluyen comprobación de campo de imágenes aéreas y satelitales, caracterización de hábitats esenciales, determinación de cambios, y supervisión de avance de los esfuerzos de la restauración. Para tratar algunas de estas necesidades, el servicio geológico de los E.E.U.U. desarrolló el sistema de imágenes de arrecifes a lo largo de líneas (Along-Track Reef-Imaging System: ATRIS), un sensor para usar desde un bote y mapear ambientes bénticos someros. ATRIS consiste en una cámara fotográfica digital, una cámara de vídeo, y un sensor acústico de profundidad en un poste movible. Este diseño, sin embargo, restringe su uso a aguas claras de menos de 10 m de profundidad. Para superar esta limitación, desarrollamos una versión remolcada: ATRIS profundo (Deep ATRIS). El sistema se basa en un vehículo ligero, controlado por computadora y remolcado, capaz de seguir una ruta de buceo programada. El vehículo tiene 1.3 m de largo con un ancho de 63 cm y puede llevar una variedad amplia de instrumentos de investigación, incluyendo CTD, fluorómetros, y cámaras fotográficas. Deep ATRIS está equipado con una cámara fotográfica digital de alta velocidad (20 cuadros· s-1), luces LED, una brújula, un sensor triaxial de orientación, y un altímetro nadir. El vehículo ajusta dinámicamente su altitud para mantener una distancia fija sobre el lecho marino. La cámara fotográfica tiene un campo visual de 29°x22° y captura imágenes a color de 1360 x 1024 pixeles. Los coordenadas del GPS se registran para cada imagen. Una conexión de Ethernet de un gigabit permite que las imágenes sean exhibidas y archivadas en tiempo real en una computadora en la superficie. Deep ATRIS tiene una velocidad máxima del remolque de 2.6 m· s-1 y un límite teórico de profundidad de 27 m. Con un cable mejorado del remolque, la profundidad de funcionamiento se puede ampliar a 90 m. Aquí, presentamos resultados de ensayos iniciales en el Golfo de México y en el Parque Nacional de Biscayne, Florida, E.E.U.U., y discutimos la utilidad de Deep ATRIS para mapear hábitats coralinos. Varios mosaicos de imágenes ilustran la alta calidad de las imágenes que se pueden obtener con este sistema. Las imágenes también revelan su potencial para observaciones de animales, ya que peces y tortugas parecen ignorar al Deep ATRIS. Palabras clave: mapeo de hábitats, estudios del bentos, abundancia especies, imágenes digitales. REFERENCES Ballard, R.D., F.T. Hiebert, D.F. Coleman, C. Ward, J. Smith, K. Willis, B. Foley, K. Croff, C. Major & F. Torre. 2001. Deepwater archaeology of the Black Sea: The 2000 season at Sinop, Turkey. Am. J. Archaeol. 105: 607-623.. 62. Bohnsack, J.A. 1979. Photographic quantitative sampling of hard-bottom benthic communities. Bull. Mar. Sci. 29: 242-252. Brock, J.C., C.W. Wright, I.B. Kuffner, R. Hernandez & P. Thompson. 2006. Airborne lidar sensing of massive stony coral colonies on patch reefs in the northern Florida reef tract. Remote Sens. Environ. 104: 31-42. Boutan, L. 1893. Mémoire sur la photographie sous-marine. Arch. Zool. Exp. Gén. 3: 281-324. Eigen, E. 2001. Dark space and the early days of photography as a medium. Grey Room. Spring 2001: 90-111. Ewing, M., A. Vine & J.L. Worzel. 1946. Photography of the ocean bottom. J. Opt. Soc. Am. 36: 307-321. Ginsburg, R.N., E. Gischler & W.E. Kiene. 2001. Partial mortality of massive reef-building corals: An index of patch reef condition, Florida reef tract. Bull. Mar. Sci. 69: 1149-1173. Holst, G.C. 1998. CCD Arrays, cameras, and displays. JCD, Winter Park, Florida, USA. 378 p. Kendall, M.S., O.P. Jensen, C. Alexander, D. Field, G. McFall, R. Bohne & M.E. Monaco. 2005. Benthic mapping using sonar, video transects, and an innovative approach to accuracy assessment: A characterization of bottom features in the Georgia Bight. J. Coast. Res. 21: 1154-1165. Kenyon, J.C., R.E. Brainard, R.K. Hoeke, F.A. Parrish, & C.B. Wilkinson. 2006. Towed-diver surveys, a method for mesoscale spatial assessment of benthic reef habitat: A case study at midway atoll in the Hawaiian archipelago. Coast. Manage. 34: 339-349. Kocak, D.M. & F.M. Caimi. 2005. The current art of underwater imaging - with a glimpse of the past and vision of the future. Mar. Technol. Soc. J. 39: 5-26. Machan, R. & K. Fedra. 1975. A new towed underwater camera system for wide-range benthic surveys. Mar. Biol. 33: 75-84. Morrison, M. & G. Carbines. 2006. Estimating the abundance and size structure of an estuarine population of the sparid Pagrus auratus, using a towed camera during nocturnal periods of inactivity, and comparisons with conventional sampling techniques. Fish. Res. 82: 150-161.. Rev. Biol. Trop. (Int. J. Trop. Biol. ISSN-0034-7744) Vol. 56 (Suppl. 1): 51-63, May 2008.
(13) Parry, D.M., M.A. Kendall, D.A. Pilgrim & M.B. Jones. 2003. Identification of patch structure within marine benthic landscapes using a remotely operated vehicle. J. Exp. Mar. Biol. Ecol. 285-286: 497-511. Puglise, K.A. & R. Kelty (eds.). 2007. NOAA coral reef ecosystem research plan for fiscal years 2007 to 2011. NOAA Coral Reef Conservation Program. NOAA Technical Memorandum CRCP 1. 128 p. Singh, H., R. Armstrong, F. Gilbes, R. Eustice, C. Roman, O. Pizarro & J. Torres. 2004. Imaging Coral I: Imaging coral habitats with the SeaBED AUV. Subsurf. Sens. Technol. Appl. 5: 25-42. Zawada, D.G. 2003. Image processing of underwater multispectral imagery. IEEE J. Oceanic Eng. 28: 583-594.. INTERNET REFERENCES Brock, J.C. & D.G. Zawada. 2006. Along-Track Reef Imaging System (ATRIS). U.S. Geological Survey Fact Sheet 2006-3051, 2 p. (Downloaded July 31, 2007, http://pubs.usgs.gov/fs/2006/3051/). Florida Oceans & Coastal Resources Council. 2007. Investing in Florida’s coastal and oceans future Annual science research plan. 52 p. (Downloaded July 31, 2007, http://www.floridaoceanscouncil.org/ meetings/files/Research_Plan_FY07-08.pdf). U.S. Geological Survey. 2007. Strategic science for coral ecosystems. U.S. Geological Survey. Reston, VA. 23 p. (Downloaded April 16, 2007, http://fisc.er.usgs. gov/coral_plan_final_April_2007.pdf).. Rev. Biol. Trop. (Int. J. Trop. Biol. ISSN-0034-7744) Vol. 56 (Suppl. 1): 51-63, May 2008. 63.
(14)
(15)
Figure

+4

Documento similar
“ CLIL describes a pedagogic approach in which language and subject area content are learnt in combination, where the language is used as a tool to develop new learning from a
In the preparation of this report, the Venice Commission has relied on the comments of its rapporteurs; its recently adopted Report on Respect for Democracy, Human Rights and the Rule
Depth of the rst corrugation D 1 56.25 mm Depth of the second corrugation D 2 102.5 mm Depth of the third corrugation D 3 57.5 mm Depth of the fourth corrugation D 4 72.5 mm Depth
Superconducting parameters of the compounds are given in Table I, and their zero-field tunneling conductance curves are shown in Fig. Note that the critical temperatures of the
Theoretically, the penetration depth and the thermal diffusion length are the same in both images and the waves reach the same depth, but due to the coil shape and the distribution
Auxiliary Picture Syntax uses video plus depth format, consisting of two inputs, one for the video sequence and the associated depth information for one of the two views of the
The number of characters per line also varies depending on a number of factors, including the alphabet and the medium: TV subtitles are usually limited to 37
The expansionary monetary policy measures have had a negative impact on net interest margins both via the reduction in interest rates and –less powerfully- the flattening of the
