Full PDF
18
0
0
Texto completo
(2) most threatened forest formations in Brazil, resting only 12.6% of its original extension (Ribeiro et al. 2009) and only 7% within Santa Catarina State. The term mixed ombrophyllous forest is used to describe a type of forest vegetation characterized by elements of both the tropical (afro-brazilian) and temperate (australanthartic- andinean) flora (Veloso et al. 1991, Leite 2002), under a humid subtropical climate without a dry season. This forest type is also known as Araucaria forest, due to the physiognomic dominance of A. angustifolia, occurring at elevations above 800m.a.s.l. and from latitudes 20ºS to 29ºS. Although A. angustifolia is the physiognomic dominant species, it is in general accompanied, by species as Podocarpus lambertii Klotzsch ex Endl., Drymis brasiliensis Miers, Ocotea porosa (Nees & Mart.) Barroso, Schinus terebinthifolius Raddi, Ocotea pulchella (Nees & Mart.) Mez and Ilex paraguariensis A.St.-Hil. (Veloso et al. 1991). In open areas are frequently found light-demanding tree species like Piptocarpha angustifolia Dusén ex Malme, Mimosa scabrella Benth., Vernonanthura discolor (Spreng.) H.Rob. and Ocotea puberula (Rich.) Nees, according to Klein & Hatschbach (1970/71). Despite of numerous studies about MOF in the Southern states of Paraná and Rio Grande do Sul (reviewed by Figueiredo Filho et al. 2006), knowledge about these forests in Santa Catarina is based on few works (Klein 1960, 1990, Negrelle & Silva 1992, Formento et al. 2004, Lingner et al. 2007). The Floristic and Forest Inventory of Santa Catarina (IFFSC) is an initiative of the local government, realized between 2007 and 2010 in order to evaluate the conservation status of forest cover and to support the formulation of forest conservation and land use policy (Vibrans et al. 2008). Focused on endangered tree species in a highly fragmented forest cover under permanent pressure by agriculture and forest plantations, the inventory is composed by five components: (1) Integration of the state’s four herbaria collections, (2) field inventory strictu sensu, (3) assessment of genetic structure of endangered tree populations, (4) 1372. analysis of socio-economic importance of forest resources and (5) on-line geo-referenced database to be accessed by decision makers and the public. The Santa Catarina inventory applies a systematic sampling with 440 clusters located on a 10x10km grid, in accordance to the Brazilian National Forest Inventory (IFNBR) to be started in 2010. The purpose of this study is to analyze the structure of MOF in the state of Santa Catarina, in Southern Brazil, relating it to human impacts and threats to which it is exposed. Materials and methods The present work consists of a preliminary evaluation of field data collected between 2007 and 2008 in the first stage of IFFSC, realized in mixed ombrophyllous forests with A. angustifolia. The study performed analysis of woody species based on 92 clusters containing four crosswise 1 000m² plots (20x50m), within an area of approximately 32 320km² at the state’s high plateau at 500m to 1 560m above sea level, located at 26º00’-28º30’ S 49º13’-51º23’ W. The 10x10km sampling grid was overlaid to land use map based on unsupervised classification of multispectral SPOT-4 images from 2005 with forest and non-forest classes to determine cluster location at forest areas. No isolation distance was established from the forest border, since the grid location coordinates were strictly obeyed. While 87 of the analyzed clusters are located on the regular grid, five clusters (nº 2 001 to 4 000) were located arbitrarily, within the studied area, in areas of public domain that suffered no logging activities for at least 40 years, in order to obtain data from what are supposed to be forests under better conservation conditions. Within the sample units (Fig. 1) all woody individuals of the main stratum with diameter at breast height (DBH≥10cm) were measured and collected (fertile and sterile), if not undoubtedly identified in field (Vibrans et al. 2010). Regeneration stratum (height>1.50m; DBH<10cm) was registered in 100m² in each sample unit, including regrowth of tree species. Rev. Biol. Trop. (Int. J. Trop. Biol. ISSN-0034-7744) Vol. 59 (3): 1371-1387, September 2011.
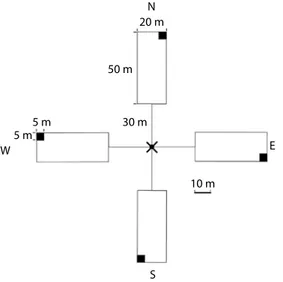
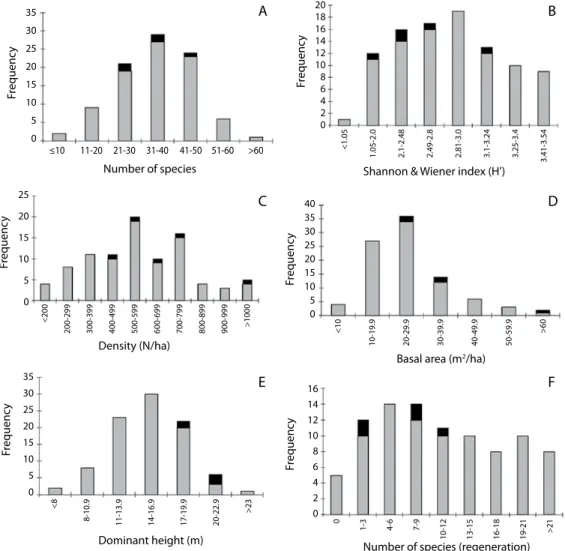
(3) N 20 m. 50 m. 5m. 5m. •. 30 m E. W 10 m. S Fig. 1. Sample unit of IFFSC, composed by four crosswise 1 000m² plots (20x50m), at 30m distance from centre point.. and understory shrubs. Variables measured in main stratum were DBH, height, stem quality, tree sanity and crown length, while in regeneration stratum only density and height of plants. Floristic sampling included collection of fertile trees, shrubs, herbs and epiphytes within the sample unit and in its surroundings. All measured sites were submitted to a detailed physiognomic description by the field crew, including description of disturbing factors and any type of human impact within and in the sampled forest surroundings. A number of 1 809 voucher specimen collected during execution of this study were deposited at herbarium FURB under reference number 6 828 to 20 684 (not consecutive). Floristic and structural indices were calculated according to Mueller-Dombois & Ellenberg (1974). Sampled forest fragments, that we also call remnants, were classified into three groups, using basal area, species composition, successional stage and conservation status as indicators, described as follows: •. Group 1: Vegetation characterized by highly degraded, mostly open arboreous. •. vegetation in early successional stage, due to intensive exploitation or clear cutting, invasion of pioneer tree and shrub species; sometimes with sparse tree cover, presence of silvopastoral systems, canopy cover less than 50%. Group 2: Vegetation in intermediate successional stage, after intensive logging and exploitation of Ilex paraguariensis and extensive cattle farming; vegetation predominantly arboreous, in variable conservation status, creating mosaic of vegetation types, evidence of recent and historic timber exploitation, frequent presence of pasture. Group 3: Vegetation in advanced successional stage, with species composition near to original, but diameter structure and structural parameters yet fare from primary forests; vegetation with low human influence, absence of pasture and recent logging, wide diameter amplitude. RESULTS. The main floristic and structure variables including successional group are shown for each cluster in Table 1, separately for the main stratum (DBH≥10cm) and regeneration stratum (all plants with total height >1.50m and DBH<10cm). The distribution of stand variables within the set of 92 examined remnants is shown in Fig. 2. While species richness, diversity, density and dominant height were nearly normally distributed, basal area and richness of regeneration species distributions seemed to tend leftwards. Shannon and Wiener Index and density showed intermediate values in most of the remnants, although it is not possible to establish direct relationship between conservation status and diversity or density, for high values of both can occur in unperturbed as well as in perturbed forests. Considering vegetation physiognomy, species composition and conservation status, 46 (50% of total) remnants were classified as belonging to Group 1, 41 (45%) belonged. Rev. Biol. Trop. (Int. J. Trop. Biol. ISSN-0034-7744) Vol. 59 (3): 1371-1387, September 2011. 1373.
(4) TABLE 1 Main floristic and structure variables of 92 clusters measured by IFFSC between 2007 and 2008 Cluster 69 70 85 87 89 104 113 114 134 137 139 140 177 188 206 208 211 217 242 246 297 301 304 328 336 337 365 367 369 409 413 415 450 453 455 456 495 555 561 562 565 566 615 619 623 668 669 672 673. 1374. Alt.1 1 091 1 089 990 867 1 255 825 1 430 1 449 1 068 1 359 1 475 1 560 826 1 231 998 870 1 129 1 283 1 110 1 015 1 051 891 863 850 840 888 941 846 811 962 1 150 849 908 993 1 070 989 788 943 869 985 1 055 802 954 954 1 190 1 089 1 012 970 1 025. DE2 82 150 313 29 111 627 201 103 107 82 146 146 120 294 38 56 147 130 250 372 143 51 299 101 100 167 192 148 100 115 106 176 185 100 213 320 112 142 100 92 413 325 118 458 295 45 63 117 107. S3 19 22 30 39 24 51 18 12 31 29 8 10 37 34 34 38 37 35 16 34 41 14 26 50 31 40 37 43 39 54 50 48 49 50 35 41 28 52 38 43 50 45 28 32 25 44 40 30 34. Main stratum DBH ≥ 10cm H’4 J5 D6 1.67 0.57 515 2.09 0.68 418 2.23 0.66 730 3.15 0.86 503 2.52 0.79 733 3.2 0.81 780 2.08 0.72 538 1.5 0.6 345 2.76 0.8 685 2.8 0.83 770 1.33 0.64 190 1.64 0.71 303 2.85 0.79 643 1.67 0.47 1230 3.05 0.86 497 3.04 0.84 683 2.84 0.79 838 1.97 0.55 1310 2.29 0.83 268 2.93 0.83 375 2.84 0.77 970 2.38 0.9 85 2.71 0.83 289 3.47 0.89 858 3.06 0.89 406 2.8 0.76 595 3.02 0.84 378 3.28 0.87 915 3.01 0.82 573 3.48 0.87 846 3.29 0.84 553 3.5 0.9 535 3.31 0.85 550 3.21 0.82 733 1.98 0.56 1228 2.01 0.54 740 2.48 0.74 378 3.36 0.85 635 2.95 0.81 620 3.11 0.83 555 2.83 0.72 615 3.44 0.9 318 2.98 0.89 260 2.95 0.85 590 1.43 0.44 1228 3.41 0.9 533 3.08 0.83 553 2.65 0.78 663 2.87 0.81 473. BA7 24.47 12.07 43.54 22.8 33.77 27.84 25.28 29.31 32.71 32.29 8.62 20.2 23.11 54.86 17.29 16.1 27.94 50.75 7.55 22.11 28.15 3.87 21.26 30.08 10.27 19.02 16.44 25.58 19.02 29.02 36.76 27.59 25.27 27.92 43.21 51.36 12.74 21.8 39.23 22.87 44.63 15.5 12.47 20.47 64.1 22.97 12.95 20.31 30.08. DBH8 17.9 16.1 24 20.7 19.8 19 18.8 28.6 20.4 19.8 20.3 22.6 18.2 21.3 18.6 15.3 17.9 20.1 16.8 24.3 17.3 21.6 26.7 18.9 15.9 16.7 20.8 17.3 18 19.1 24 22 20 18.7 19.4 25.6 18.1 18.3 21.8 20.3 26.3 21.1 22.6 19.1 23.4 20.1 13.7 17.2 25.4. DH9 12.3 6.7 11.2 10.9 13.6 18.3 9.6 13 12.2 11.4 9.2 8.1 15.7 7.2 17.7 12.9 17.1 10.6 11.2 15.8 16.4 13.2 12.9 17.6 11.7 12.3 17.8 16.5 16.7 16.4 15.2 11 17.2 15.7 12 14.8 16.3 15.9 16.1 15.5 17.2 18.8 17.1 14.9 10.4 16.2 12.5 16.3 19.1. Regeneration Dreg10 Sreg11 2 900 8 1 000 6 1 300 8 1 500 5 8 200 22 9 700 26 3 300 12 4 500 17 1 000 6 4 600 11 900 3 2 300 5 13 000 28 2 600 10 3 000 10 7 700 26 6 100 20 2 400 15 1 600 8 0 0 7 600 25 3 600 13 2 700 9 900 4 8 800 20 5 200 14 6 500 14 11 000 28 8 100 18 4 700 17 800 5 2 900 14 8 100 13 3 700 20 400 3 300 3 4 200 12 5 800 28 2 700 9 2 600 12 1 300 8 800 4 5 700 10 5 400 17 0 0 9 700 15 7 000 21 3 000 13 300 3. SG12 2 1 1 2 2 2 1 2 2 2 1 1 1 1 1 2 1 2 1 2 2 1 1 1 1 2 2 1 1 1 3 1 1 1 2 2 2 2 2 1 3 2 1 1 2 1 1 1 2. Rev. Biol. Trop. (Int. J. Trop. Biol. ISSN-0034-7744) Vol. 59 (3): 1371-1387, September 2011.
(5) TABLE 1 (Continued) Main floristic and structure variables of 92 clusters measured by IFFSC between 2007 and 2008 Cluster 732 736 739 784 789 793 794 843 845 850 887 894 895 901 902 933 934 939 945 946 949 974 976 978 979 982 984 1 010 1 013 1 016 1 019 1 024 1 034 1 042 1 055 1 059 1 061 1 063 2 001 2 002 3 001 3 002 4 000 Average. Alt.1 1 175 1 287 572 1 348 1 026 1 110 682 1 269 1 060 560 1 047 867 861 943 979 1 098 1 143 866 865 932 865 1 011 820 1 226 800 845 740 807 813 896 903 1 005 835 846 796 792 879 861 824 806 842 821 995 980.2. DE2 123 187 82 92 142 202 146 162 250 100 565 80 171 489 690 250 284 327 96 187 104 81 250 953 134 122 401 95 369 152 149 111 134 114 144 83 110 153 250 52 496 929 795 209. S3 44 25 46 38 28 37 62 24 30 42 30 42 44 56 35 46 53 54 37 35 28 46 49 39 37 29 19 16 15 26 38 47 17 26 21 47 40 47 30 31 42 21 31 35.3. Main stratum DBH ≥ 10cm H’4 J5 D6 3.19 0.84 743 2.33 0.72 973 3.05 0.8 718 2.69 0.74 778 2.6 0.78 483 3.07 0.85 510 3.46 0.84 515 1.05 0.33 768 2.75 0.81 469 3.25 0.87 353 2.53 0.74 670 3.02 0.81 470 3.32 0.88 713 3.43 0.85 770 3.13 0.88 238 2.97 0.78 698 2.82 0.71 710 3.51 0.88 393 2.95 0.82 430 2.6 0.73 583 2.64 0.79 438 3.43 0.9 373 3.25 0.84 575 2.39 0.65 543 2.95 0.82 510 2.71 0.8 245 2 0.68 390 1.98 0.71 273 2.22 0.82 135 2.67 0.82 308 3.34 0.92 283 3.3 0.86 713 2.23 0.79 108 2.87 0.88 295 2.15 0.71 408 3.34 0.87 575 2.81 0.76 710 2.77 0.72 825 2.36 0.69 598 2.75 0.8 710 3.13 0.84 635 2.27 0.75 470 1.73 0.5 1083 2.73 0.78 578.4. BA7 24.7 32.94 20.8 46.9 13.6 12.01 24.47 42.88 28.28 14.81 32.34 12.26 20.87 42.53 27.4 20.18 30.09 24.41 14.6 17.47 19.35 19.46 22.16 33.55 16.01 14.23 22.83 16.69 15.25 24.84 17.57 17.41 7.16 18.51 19.32 26.21 29.89 36.19 33.6 39.68 26.51 26.51 68.85 25.75. DBH8 18.2 17.8 17.3 24.4 16.5 15.7 21.6 24.1 21.8 19.7 20.4 14.8 16.2 20.6 29.4 17.1 21.3 23.8 16 17.1 21.8 21.5 17.4 25 17.6 22.2 23.1 20.1 34.1 26.6 25.4 16.4 25 23.5 21.7 19.8 19.9 19.9 23.2 22 20.3 21.9 23.1 20.6. DH9 15.2 10.8 13.6 16 11.9 12.5 16.8 12.3 15.3 16.2 14.4 15.4 18.4 15.5 16.8 12.6 14.9 17.3 17 13.4 18.8 15.7 17.8 18.7 15.1 20.6 19.8 11.2 23.1 17.6 17.6 12.3 13 16.8 21.4 22.8 23 17.1 19.6 20 20.5 18.3 20.1 15.3. Regeneration Dreg10 Sreg11 1 400 10 1 300 7 4 100 21 1 400 5 5 500 16 300 3 1 600 8 0 0 300 3 800 4 200 2 300 2 3 100 17 4 400 18 6 500 10 800 6 2 800 19 1 100 5 5 500 21 400 4 800 5 1 700 10 2 400 16 0 0 2 300 19 800 7 500 2 800 2 7 900 9 1 700 7 5 000 9 5 100 25 0 0 2 300 15 800 6 2 700 14 4 700 19 4 300 21 1 400 11 1 500 8 4 000 9 300 2 200 2 3 200 11.1. SG12 2 2 1 2 1 1 2 2 1 1 2 2 2 3 2 1 1 2 2 1 2 1 2 3 1 1 1 1 1 1 2 2 1 1 1 2 1 1 2 2 2 2 3. 1Altitude. above sea level (m); 2Distance of clustercenter from the forest edge (m); 3Species richness within plot; 4Shannon and Wiener Index; 5Pielou eveness Index; 6Density (n/ha); 7Basal Area (m²/ha); 8Mean DBH (cm); 9Dominant height mean of trees with height > + sd (m); 10Density of regeneration (n/ha); 11Species richness of regeneration within cluster; 12Successional group.. Rev. Biol. Trop. (Int. J. Trop. Biol. ISSN-0034-7744) Vol. 59 (3): 1371-1387, September 2011. 1375.
(6) >60. Shannon & Wiener index (H’). Density (N/ha). >23. 20-22.9. 17-19.9. 14-16.9. 11-13.9. 8-10.9. 0. Dominant height (m). >21. 5. 19-21. 10. 16-18. 15. 13-15. 20. F. 10-12. Frequency. 25. 16 14 12 10 8 6 4 2 0. 0. E. 30. <8. >60. Basal area (m2/ha). 35. Frequency. 50-59.9. >1000. 900-999. 800-899. 700-799. 600-699. 500-599. 400-499. 300-399. 200-299. <200. 5. 40-49.9. 10. D. 30-39.9. 15. 40 35 30 25 20 15 10 5 0. <10. C. 20. Frequency. Frequency. 25. 0. 3.41-3.54. 41-50 51-60. 20-29.9. 31-40. 7-9. 21-30. Number of species. 10-19.9. 11-20. 4-6. ≤10. 1-3. 0. 3.25-3.4. 5. 3.1-3.24. 10. 2.81-3.0. 15. 2.49-2.8. 20. 2.1-2.48. 25. B. 1.05-2.0. Frequency. Frequency. 30. 20 18 16 14 12 10 8 6 4 2 0. <1.05. A. 35. Number of species (regeneration). Fig. 2. Number of species (A), Shannon & Wiener Index (B), density (C), basal area (D), dominant height (E) and regeneration species number (F), from 92 sample plots (main stratum, DBH≥10cm); plots within conservation units in black.. to Group 2 and only five remnants (5%) to Group 3. Classification of sampled remnants into the three successional groups (Table 2) showed that basal area (ANOVA, α<0.01) and density (ANOVA, α<0.05) were significantly different between groups. Furthermore analyzing basal area, Group 1 and 2 differed more significantly (Student, α<0.01) than Group 2 and 3 (Student, α<0.05). Considering density, only Group 1 and 2 showed significant difference (Student, 1376. α<0.05). Yet neither DBH, nor dominant height or species richness, showed significant difference between successional groups. This indicates that basal area can be considered the most appropriate indicator of stand quality and conservation status in the observed universe within MOF. Remnants located in public areas, supposed to be forests under better conservation conditions, did not have highest values of floristic and structure variables; they showed. Rev. Biol. Trop. (Int. J. Trop. Biol. ISSN-0034-7744) Vol. 59 (3): 1371-1387, September 2011.
(7) TABLE 2 Mean values and standard deviation (sd) of vegetation variables by successional group Group 1 2 3. BA1 21.1 28.5 45.3. sd 9.4 11.5 13.0. DBH2 20.2 20.7 23.8. sd 3.5 3.5 2.1. DH3 14.8 15.6 17.3. sd 3.7 3.1 2.1. S4 33.1 36.5 45.2. sd 12.3 10.2 10. H’5 2.85 2.88 2.90. Sd 2.06 2.12 2.36. D6 515 633 713. sd 238 248 226. 1Basal Area (m²/ha), 2DBH (cm), 3Dominant height (m), 4Species richness (S), 5Shannon and Wiener Index, 6Density (n/ha). Data from 92 analyzed remnants by IFFSC between 2007 and 2008.. higher values of basal area and dominant height than the average, but surprisingly lower species richness (not diversity) in the main stratum and in the regeneration stratum (Fig. 2), possibly due to ancient exploitation and degradation. Even in the site considered most closely to primary conditions (cluster nº 4 000), richness and diversity were quite lower than expected; this can mean that species richness is not automatically correlated to conservation status, besides the possible restriction that the applied sampling method was not appropriate and could have failed recording the existing plant diversity. On the other hand, due to the hegemony of Dicksonia sellowiana Hook (61.4% of relative density) and A. angustifolia (52% of relative dominance), this particular community (cluster nº 4 000) could represent a monodominant forest, due to special site conditions. In this case ideal site conditions for one or two species can be adverse or even exclusive for a lot of other species and reduce richness and diversity values. Species richness and diversity: A total of 342 tree and shrub species and 28 morphospecies were detected in the sampled areas (five Coniferophyta, one tree fern, 364 Magnoliophyta), belonging to 66 families. There were 310 species in the main stratum (113 of them exclusives in this stratum) and 260 in the regeneration stratum (59 exclusives); the families with major richness were Myrtaceae, Asteraceae, Lauraceae, Fabaceae, Solanaceae, Rubiaceae, Euphorbiaceae and Melastomataceae. The species richness reflected the great. range of forest sites and environmental conditions within MOF in Santa Catarina. The mean species richness in measured remnants was 35 (ranging from eight up to 62 tree species). Shannon and Wiener diversity index (H´) varied between 1.05 and 3.48. Although beta and gamma diversity was high, the results showed that the individual fragments have low species richness (alfa diversity). Only 13 species were present in more than 50% of sampled clusters (main stratum, in decrescent order of frequency): A. angustifolia, Prunus myrtifolia (L.) Urb, Clethra scabra Pers., Vernonanthura discolor, D. sellowiana, Myrsine coriacea (Sw.) R. Br. ex Roem. & Schult., Matayba elaeagnoides Radlk., Ocotea puberula, Ilex paraguariensis, Casearia decandra Jacq., Sapium glandulosum (L.) Morong, Zanthoxylum rhoifolium Lam., Ocotea pulchella; all them can be considered generalists and secondary species with wide range of environmental conditions. In contrast, a high number of species (178 equivalent to 57% of total species number) were present in less than six clusters. The high number of rare species corroborates this assumption, showing 74 species occurring in only one cluster, and 120 species occurring in up to two clusters. Among these species, 44 occurred with only one specimen and 72 species were sampled with only two specimens. Among them were found naturally rare species, like Myrcia rupicola D. Legrand, Myrceugenia alpigena (DC.) Landrum; yet also species highly impacted by exploitation like. Rev. Biol. Trop. (Int. J. Trop. Biol. ISSN-0034-7744) Vol. 59 (3): 1371-1387, September 2011. 1377.
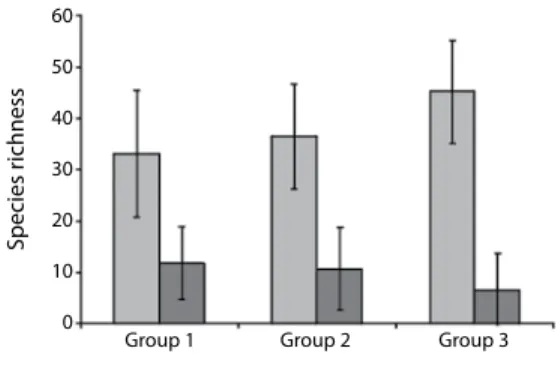
(8) Ocotea odorifera (Vell.) Rohwer and Ocotea porosa and indirectly impacted by pasture burning close to forest remnants like Myrceugenia venosa D. Legrand, certainly contributed to increase the number of rare species. The floristic survey within and around the clusters resulted in an important increase of registered plant diversity. There were found another (exclusive) 378 species belonging to 84 families. The Lycophyta and Monilophyta groups were represented by 99 species (terricole and epiphyte) and the Magnoliophyta group by 279 species, being 65 trees and shrubs species undetected by the inventory, 33 lianas, 35 epiphytes, 145 terricole herbs and one parasite. Species richness within the three successional groups showed increasing pattern from group one to group three in the main stratum and decrease in the regeneration stratum (Fig. 3).. were 25 species with IV≥1% (8.0% of total number of species). This relatively restricted group of species represents 67.8% of all trees, 73.5% of total basal area and 60.6% of the total importance value. Collected data showed a relatively small group of species of high importance within horizontal structure in the MOF. Within these species occurred, in decrescent order, D. sellowiana, A. angustifolia, C. scabra, Lithraea brasiliensis Marchand, O. porosa, M. elaeagnoides, P. myrtifolia, O. puberula, O. pulchella and I. paraguariensis. Two of them, D. sellowiana and A. angustifolia, are endangered and red list species (MMA, 2008). Structure analysis by successional group showed that: •. 60. Species richness. 50. •. 40 30 20. •. 10 0. Group 1. Group 2 main stratum. Group 3. regeneration. Fig. 3. Mean species richness within three successional groups and standard deviation (main stratum: DBH≥10cm; regeneration stratum: total height>1.50m, DBH<10cm).. Species composition and forest structure: Mean density of trees with DBH≥10cm was 578 individuals/ha (ranging from 85/ha to 1 310/ha, sd=248); medium basal area was 25.75m²/ha (3.87 to 68.85m²/ha, sd=12.06), dominant height 15.3m (6.7m to 23.1m, sd=3.44). Considering Importance Values (IV), calculated for the whole set of 92 clusters, there 1378. In group one dominated: (highest IV, in decrescent order) D. sellowiana, A. angustifolia, O. porosa, I. paraguariensis, Nectandra megapotamica (Spreng.) Mez, C. decandra, M. elaeagnoides, Allophylus guaraniticus (A. St.-Hil.) Radlk., Myrcia hatschbachii D. Legrand; In group two dominated: D. sellowiana, A. angustifolia, L. brasiliensis, P. lambertii, O. pulchella, M. elaeagnoides, C. scabra, O. porosa, I. paraguariensis; In group three dominated: D. sellowiana, A. angustifolia, L. brasiliensis, P. lambertii, O. pulchella, M. elaeagnoides, C. scabra, Sebastiania commersoniana (Baill.) L. B. Sm. & Downs, O. porosa, I. paraguariensis.. Density showed increasing mean values from group one to three (515/633/713 ind./ ha), the same tendency is observed for basal area (21.1/28.45/45.26m2/ha) and mean species richness (33/36/45 species/cluster), while regeneration richness (12/11/7 species/cluster) and density (3 528/2 884/1 340 ind./ha) were decreasing. In this context it has to be mentioned that edge effect could have influenced species composition and structure of analyzed forests, overlapping or masking the described succession processes. Than basal area (α<0.01). Rev. Biol. Trop. (Int. J. Trop. Biol. ISSN-0034-7744) Vol. 59 (3): 1371-1387, September 2011.
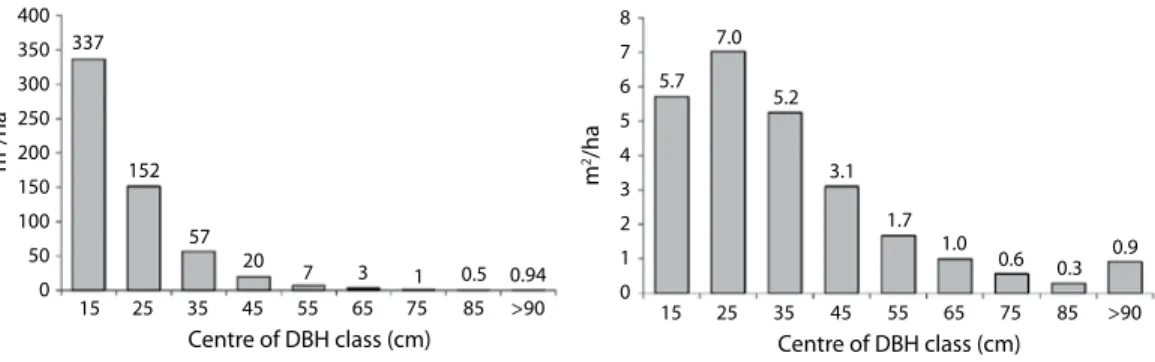
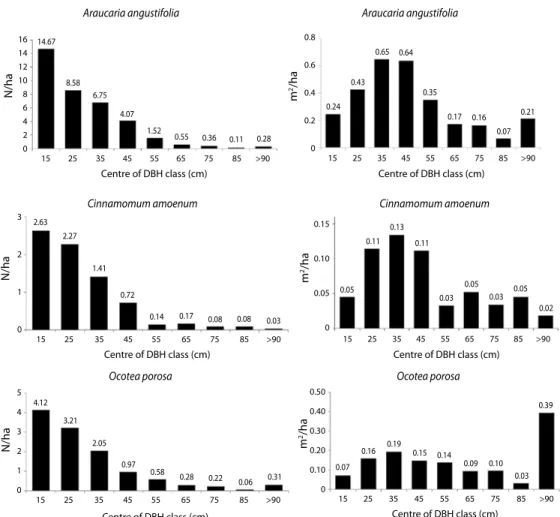
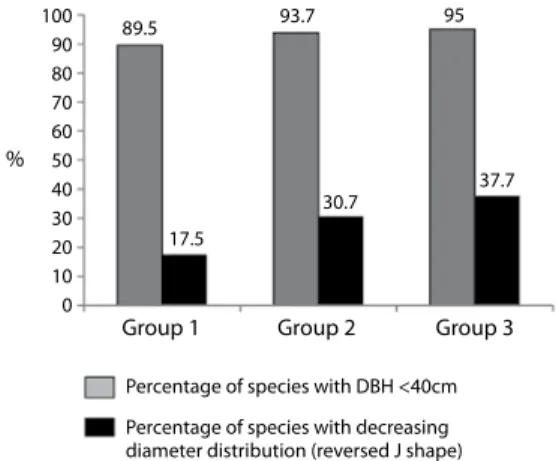
(9) and dominant height (α<0.05) were positively correlated (Pearson) to edge distance (Table 1), while richness of regeneration stratum (α<0.05) was inversely correlated and the other structural variables did not show any relationship to the edge distance. Diameter distribution: Diameter distribution ranged from 10cm to 165cm, with major concentration of trees (84.21% of total number) in lower diameter classes (Fig. 4). Besides tree size distribution in tropical forests is to be expected like reversed J shape, small number of big trees was quite astonishing. In the classes ≤30cm were found 84.4% of total number of trees, in classes ≤40cm, 94.2% and ≤50cm, 97.7%. Therefore the overwhelming majority of sampled trees belonged to regrowth and to lower or intermediate diameter classes, probably due to intensive exploitation and successional stage of forest remnants. Between all the tree species, only 10 (2.7%) showed diameters greater than 100cm: A. angustifolia, Cedrela fissilis Vell., Cinnamomum amoenum (Mez) Kosterm., Ficus cestrifolia Schott ex Spreng., Ilex brevicuspis Reissek, Luehea divaricata Mart., Nectandra lanceolata Nees, Ocotea porosa, Ocotea pulchella and Sloanea monosperma Vell. All of them, despite F. cestrifolia, were found with decreasing diameter distribution (reversed J shape), showing stability of there populations within MOF (Fig. 5).. On the other hand, 67.9 % of all species only occurred in lower diameter classes (<40cm). Within these species, the following ones had major density values (>50 specimen/ ha) and can be considered typical components of early and intermediate successional stages of MOF in Santa Catarina: A. guaraniticus, Cupania vernalis Cambess., Ilex dumosa Reissek, Jacaranda puberula Cham., S. terebinthifolius, Symplocos uniflora (Pohl) Benth., Z. rhoifolium, Myrcia splendens (Sw.) DC., Inga lentiscifolia Benth., Lonchocarpus campestris Mart. ex Benth., Inga vera Willd., Schinus lentiscifolius Marchand and Drimys angustifolia Miers. The number of species present only in the lower diameter classes are shown in Fig. 6. Their number was relatively stable in the three successional groups, meanwhile number of late successional or climax species with decreasing diameter distribution was increasing accordingly to the successional stage of vegetation. This means that an increasing number of species reached stable population levels in later successional stages of the analyzed forest vegetation. Regeneration: In the regeneration were found an average of 3 200 individuals/ha (sd=2 890), belonging to 260 species and morphospecies, 59 of them were exclusive of this stratum and were not sampled in the main stratum. Absolute density of species was ranging from one to 120 individuals/ha, relative density varied from 0.03 to 3.5%, considering. 400. 8. 337. 300. 6. 250. 5. 200. 152. 150 100. 57. 50 0. 15. 7.0. 7. m2/ha. m2/ha. 350. 25. 35. 5.7. 5.2. 4. 3.1. 3. 1.7. 2 20 45. 7. 3. 1. 0.5. 0.94. 55. 65. 75. 85. >90. Centre of DBH class (cm). 1 0. 15. 25. 35. 45. 55. 1.0 65. 0.6. 0.3. 75. 85. 0.9 >90. Centre of DBH class (cm). Fig. 4. Total diameter distribution for density (N.ha-1, left) and basal area (m2ha-1, right) of main stratum (DBH≥10cm) from 92 sample plots in MOF.. Rev. Biol. Trop. (Int. J. Trop. Biol. ISSN-0034-7744) Vol. 59 (3): 1371-1387, September 2011. 1379.
(10) Araucaria angustifolia 16. Araucaria angustifolia 0.8. 14.67. 0.65. 14. m2/ha. N/ha. 10. 8.58. 8. 6.75. 6. 4.07. 4. 1.52. 2 0. 15. 25. 35. 45. 55. 0.43. 0.4. 0.35. 0.24. 0.17. 0.2 0.55. 0.36. 0.11. 0.28. 65. 75. 85. >90. 0. 15. 25. 35. Cinnamomum amoenum. m2/ha. N/ha. 2 1.41. 15. 25. 35. 45. 55. 0.08. 0.08. 0.03. 75. 85. >90. 65. 0.05. 0.05 0.02. 0 15. 25. 35. 45. 55. 65. 75. 85. >90. Ocotea porosa 0.50. 4.12. 0.30. 2.05. 2. 0.20. 0.97. 1 15. 25. 0.39. 0.40. 3.21. m2/ha. N/ha. >90. Centre of DBH class (cm). 3. 0. 0.03. 0.03. Ocotea porosa 4. 85. 0.11. 0.05. Centre of DBH class (cm) 5. 75. 0.10. 0.05. 0.72 0.17. 65. 0.13 0.11. 0.14. 55. Cinnamomum amoenum 0.15. 2.27. 0. 45. Centre of DBH class (cm). 2.63. 1. 0.21. 0.16 0.07. Centre of DBH class (cm). 3. 0.64. 0.6. 12. 35. 45. 0.58 55. 0.28 65. 0.22 75. 0.06 85. 0.31 >90. 0.10 0. 0.16. 0.19. 0.15. 0.14. 0.07 15. 0.09. 0.10 0.03. 25. 35. 45. 55. 65. 75. 85. >90. Centre of DBH class (cm). Centre of DBH class (cm). Fig. 5. Total diameter distribution for density (N.ha-1) and basal area (m2ha-1) of Araucaria angustifolia, Cinnamomum amoenum and Ocotea porosa in MOF.. the whole data set of 92 clusters. Only 14 species (7.7%) were found with density major than 50 individuals/ha (in decrescent order): Myrcia oblongata DC, Sebastiana brasiliensis Spreng., Solanum sanctaecatharinae Dunal, C. vernalis, C. decandra, Acca sellowiana (O. Berg) Burret, Solanum variabile Mart., Grazielia serrata (Spreng.) R.M. King & H. Rob., Gymnanthes concolor (Spreng.) Müll. Arg., M. elaeagnoides, S. commersoniana, A. angustifolia, V. discolor and I. paraguariensis. The cited species summarized 30.8% of total density. Considering species frequency, maximum absolute frequency was 20 (23%) and only a 1380. small group of 28 (10.8%) species were present in at least 10% of the sampled clusters, meanwhile 183 species (or 70%) had been detected in less than 5% of the sampled forests; 97 species were found in a unique cluster. Within the most frequent and representative species were C. decandra, A. angustifolia, C. vernalis, I. paraguariensis, M. elaeagnoides, S. commersoniana, Styrax leprosus Hook. & Arn. and D. brasiliensis, but only some of these were also frequently founded in the main stratum. This means that MOF has diverse species compositions due to great variability of site conditions within the total area.. Rev. Biol. Trop. (Int. J. Trop. Biol. ISSN-0034-7744) Vol. 59 (3): 1371-1387, September 2011.
(11) 100 90 80 70 60 % 50 40 30 20 10 0. 95. 93.7. 89.5. 37.7. 30.7 17.5. Group 1. Group 2. Group 3. Percentage of species with DBH <40cm Percentage of species with decreasing diameter distribution (reversed J shape). Fig. 6. Species with DBH<40cm and species with decreasing (reversed J shape) diameter distribution in % at MOF.. Data analysis of successional groups resulted in the following species compositions (most frequent species): •. •. •. Group 1: M. oblongata, G. serrata, C. decandra, Myrciaria tenella (DC.) O. Berg, S. commersoniana, M. elaeagnoides, A. sellowiana, I. paraguariensis and Annona sylvatica (A. St.-Hil.) Mart. Group 2: Eugenia verticillata (Vell.) Angely, M. hatschbachii, Sloanea guianensis (Aubl.) Benth., Cordiera concolor (Cham.) Kuntze, Strychnos brasiliensis (Spreng.) Mart., Coussarea contracta (Walp.) Müll. Arg., Mollinedia clavigera Tul., Sorocea bonplandii (Baill.) W. C. Burger, Lanj. & Wess. Boer, Banara parviflora (A. Gray) Benth. and C. vernalis; Group 3: Myrsine gardneriana A. DC., C. scabra, Cinnamodendron dinisii Schwacke, Myrceugenia myrcioides (Cambess.) O. Berg, A. guaraniticus, Rudgea jasminoides (Cham.) Müll. Arg., C. vernalis and D. sellowiana.. The results showed that the most frequent species in the regeneration were different from the most important of the main stratum. For group 1 and 2 as initial and intermediate. stage vegetation types, these differences can be explained by the process of natural succession dynamic, which led to subsequent alteration of the dominant species pool and permanent substitution of early succession species by late succession components. On the other hand, in group 3 was expected that leading species of main stratum would be well represented also in regeneration stratum; their absence in regeneration can be explained either by deficit of fruit producing by or by weak conditions for late succession species in the understory, mostly due to manual clearing of understory vegetation and extensive cattle pasture, which is still a local practice to provide survival of cattle in wintertime when grasslands outside of forests does not offer sustain for the animals. It also had to be considered that part of the species of the regeneration stratum are understory specialists and absent in the upper story and therefore are not “regenerating” species. Conservation status and human impacts: Detailed site description revealed evidences of impacting and stress factors inside forests and in the surroundings (Table 3). Main pressure factors identified inside forests were selective logging, of more or less intensity, mostly not recent, but always without any silvicultural criteria and extensive cattle pasture (present in 51% of all fragments), damaging the understory and regeneration through grazing and trampling; these activities were often driven by vectors like (desirable and. TABLE 3 Impacting and degrading human factors observed in 92 sampled forest remnants Factor Recent or historic selective logging Extensive cattle pasture Logging roads Understory clearing Exploitation of Ilex paraguariensis. N° of remnants 72 50 25 18 11. % 78.3 54.3 27.2 19.6 12.0. More than one factor possible in one fragment.. Rev. Biol. Trop. (Int. J. Trop. Biol. ISSN-0034-7744) Vol. 59 (3): 1371-1387, September 2011. 1381.
(12) sustainable) non-destructive exploitation of leaves and branches of I. paraguariensis (mate tea). Invasion of herbs, climbers and bamboo species (Merostachys spp. and Chusquea spp.) were consequences of excessively opened forest ecosystems. In the forest surroundings most frequently detected land uses were cattle farming, afforestation with fast growing exotic species and agriculture (soybean, corn and wheat crops), as seen by the attractiveness of alternative land-use systems that increases pressure on forest lands. Native vegetation in good conservation status was rarely found. In the studied forest sites, grazing and cattle trampling may have caused differential mortality of herbs and woody seedling. The occasional penetrations of fire also may have caused significant changes in vegetation structure and composition at the edge affected area that penetrates, at least, up to 50m inside the forest. In the public areas were detected vestiges from hunters and exploitation of I. paraguariensis, but they did not suffer directly from logging, cattle pasture, understory clearing or burning, but indirectly from these impacts present in the surrounding areas. The ensemble of the main factors pressuring on forest remnants in Santa Catarina’s MOF are depictured in Fig. 7.. DISCUSSION Despite of high total number of species founded, species richness found by this study in most of the sampled forest remnants was considered low, comparing to data collected by Longhi et al. (2006), who found 75, 96 and 110 tree species in three well conserved MOF sites at São Francisco de Paula, in the state of Rio Grande do Sul. Considering the same sampling criteria (DBH≥10cm), Formento et al. (2004) registered 70 tree species and Figueiredo Filho et al. (2006) 108 tree species in primary remnants of MOF in Santa Catarina and Paraná state. The overwhelming majority of forest fragments of this study were highly impacted and impoverished, in process of progressive succession (regeneration) after exploitation near to clear cutting or in regressive succession due to repeated and constant, historic or recent, intensive human impact. Shannon and Wiener Index (H’) showed similar average values in all the three groups (with huge standard deviation within the groups), despite of differences of species composition and ecological category of species in these groups. Murphy & Lugo (1986) observed that, besides the influences of pedoclimatic conditions, diversity of secondary forests depends on the type of previous use. Thus intense cropping or pasture, with short. Hunting. Fire, slash burning. Pesticides. Understory cutting. Forest fragments Clear cutting or selective logging. Selective logging. Logging roads. Hunting. Extensive cattle farming. Roads, highways. Cattle farming. Agriculture Afforestation with Pinus spp. and Eucalyptus spp.. Fig. 7. Main environmental stress factors impacting inside (grey) and from outside on remnants of Santa Catarina’s Mixed Ombrophyllous Forests.. 1382. Rev. Biol. Trop. (Int. J. Trop. Biol. ISSN-0034-7744) Vol. 59 (3): 1371-1387, September 2011.
(13) regrowth periods and frequent use of fire, as mentioned by Lugo (1990) and Lamprecht (1989), leads to degradation of the original ecosystem, lagging or irreversibly obstructing the successional process. In the case of MOF, also intense and repeated selective logging without clearcutting apparently led to heavily degraded forest sites. The high number of rare species (120 species occurring in only two clusters, 72 species with only two specimens) is not unusual in tropical forests, since their high α-diversity is directly related to the presence of rare species (Connel et al. 1984, Lepsch-Cunha, 1996). As pointed out by Cavallari Neto (2004), these species have evolved to be rare because their genetic flows are compatible with their rarity. Most of them colonize small gaps, have temporary seedlings, and show characteristics that are related with Janzen hypothesis. Some of them may be dependent of resource pulses linked to stochastic disturbance, as has been discussed in Tilman & Paccala (1993). In the studied area it seemed evident that besides the naturally rare species like Myrcia rupicola, Myrceugenia alpigena (DC.) Landrum (Legrand & Klein 1969, 1970, Klein 1990), many others like Ocotea odorifera and O. porosa have turned rare and threatened by anthropogenic stress factors as. On the other hand, also the wide spread of the sampled territory and his environmental gradients could have influenced the results (Longhi 1997). It is notable that D. sellowiana was the predominant species in the understory, and can be considered the most important component of MOF in Santa Catarina, due to his elevated density, showing that this species seems to be in regeneration process within the remnants of MOF. It’s high Importance Value (IV) in all successional groups, may be related to the fact that in eight clusters the communities were dominated by this species, forming monodominant forests, sensu Connell & Lowman (1989), with more than 50% of all upper story individuals and basal area. The overwhelming presence of this species generally occurred in areas with wet or even soggy soils in valleys. and plains, but also on slopes. These soil conditions can lead to monodominant tree species compositions, as observed by Peters et al. (1989), Steege (1994) and Arieira & Cunha (2006). Due to their high density many of these species in monodominant forests constitute important economic resources (Peters et al. 1989, Marimon & Felfili 2000), like D. sellowiana in Santa Catarina, which was intensively exploited during the twentieth century (Reitz et al. 1978, Windisch 2002). At the same time, A. angustifolia as the second most important species, seems to be benefited by many degraded and open forest stands, that permitted her regrowth as a long living pioneer species. Increase of species richness within the three successional groups showed from group 1 to group 3 in the main stratum (Fig. 3) is a tendency expected and consistent with current theory of ecosystem development and plant succession (Odum 1983), which supposes increasing richness, diversity and complexity of plant communities along the succession process. On the other hand, decreasing species richness in the regeneration stratum, also depicted in Fig. 3, has been explained by Lamprecht (1989); according to this author, the decrease of understory species richness during the succession process, caused by disappearance of light-demanding pioneers and also many ephemeral gap opportunist species, can be larger than the migration of new shade-tolerant species in areas with more homogenized light conditions in later successional stage. Considering tree size distribution, most of the sampled trees belonged to lower or intermediate diameter classes and big trees are very rare. Species present in higher diameter classes were found with decreasing diameter distribution (reversed J shape). This diameter frequency distribution has been observed frequently in tropical forests, also in brazilian stands (Felfilli & Silva-Junior 1988, OliveiraFilho et al. 1994, Felfilli 1997); yet diameter distribution of species, varies as a function of their environmental and successional context and of their populations’ spatial pattern (Felfilli. Rev. Biol. Trop. (Int. J. Trop. Biol. ISSN-0034-7744) Vol. 59 (3): 1371-1387, September 2011. 1383.
(14) 1997, Marimon & Felfilli 2000). Some authors like Lieberman & Lieberman (1987) and Condit et al. (1993) singled out the great range of increase rates between tropical tree species, specially between understory species, due to the heterogeneity of light conditions. Comparison between main stratum and regeneration stratum turned evident that pools of dominant species are different, in part due to succession processes in course after and during the action of degradation factors. While it can be expected that the species composition of both strata would be more or less approximate, it is worth noting what was reported by Guariguata & Ostertag (2001), who argue that the succession processes are strongly dependent on site characteristics, as well as on earlier land use. The same authors comment that the more intensive human impacts become, the potential for forest regeneration from seed bank decreases, making regeneration dependent on the inflow of new seeds, both from autochtonous and allochthonous sources. However, not all species will have life story characteristics that will favor their establishment, and it is likely that, in the case of this study, the autochtonous species do not possess characteristics that allow their easy regeneration. This means that although the characteristics of plant communities, such as the density and basal areas, are relatively predictable, the floristic composition along a chronological sequence is practically impossible to be predicted (Guariguata & Ostertag 2001, Chazdon et al. 2007, Letcher & Chazdon 2009) and therefore the described differences in the composition, could be expected. Regeneration of upper story species is yet affected by clearing of understory vegetation through pasture and burning practices in agriculture land around the forests. The action of livestock in MOF in Santa Catarina has been described by Sampaio & Guarino (2007), who appointed to the processes of simplifying forest ecosystems and loss of biodiversity, benefitting pioneer species. Also apparently well conserved forests revealed in many cases extremely simplified structure with only young, small and not reproducing trees, 1384. lack of regeneration, impoverished understory and forest floor vegetation, inducing regressive succession and leading to “empty forests”, as cited by Redford (1992) and Richards (1996). Besides their extreme impoverishment, ‘empty forests’ are frequently considered ‘closed forests’ by remote sensing monitoring, error caused by lack of detailed knowledge of relations between biophysical vegetation variables from field survey and data collected by remote sensing techniques. On the other hand, in tropical forests some species show intense regeneration while others are rarely fruiting or their seedlings hardly succeed to establish, as observed by Whitmore (1998). The simultaneous occurrence of species typical to different successional stages has been frequently observed in tropical forests (Budowski 1965), yet the more frequent and prevailing species can serve to define their successional stage. Meanwhile the total absence of seedlings of red list species (MMA, 2008) O. porosa (Lauraceae) drew attention, once it was the main commercial timber species in Santa Catarina and composes the group of formerly frequent and dominant species that were actually turned rare by excessive and inordinate exploitation. Considering results of species composition, forest structure data and field evidences, only five percent of fragments showed characteristics similar to primary forests, while 49% could be considered under medium impact and 47% under high external impact, mostly in secondary succession. Only six percent of sampled forests have got well conserved vicinity with favorable conditions towards conservation. Therefore Santa Catarina’s MOF must be considered threatened by isolation and internal impoverishment and structural simplification, due to over-logging and due to the presence of livestock inside the understory; these types of threatens seams to be performed mostly by small land owners. Lack of seed trees and seedlings of late succession and commercial tree species like O. porosa completes the ‘tableau’ of empty forest remnants, often identified as closed forests by remote sensing surveys. External pressures exercised on forests by. Rev. Biol. Trop. (Int. J. Trop. Biol. ISSN-0034-7744) Vol. 59 (3): 1371-1387, September 2011.
(15) other land-uses like agriculture, cattle farming and afforestation with rapid growing species appear to be related to major land owners and private firms. For rare and endangered species, reduced area and isolation of forests stand for additional threaten leading to loss of genetic diversity by bottle-neck effects (Tarazi et al. 2010). Floristic surveys should be included in large scale inventories in order to increase databases and to recognize patterns of spatial distribution of rarer species. Effective measures have to be submitted to decision makers, including financial compensation of forest owners, mostly small farmers, for their conservations efforts (maintaining forests and keeping livestock out of woodlands) and for providing environmental services like carbon stocking in vegetation and soil, so as water and soil protection. Besides educational measures and stimulatory actions towards conservation and sustainable use of forest resources, more efficient direct surveillance and protection has to be realized in order to combat or at least reduce illegal clear-cutting and timber logging. Finally, research has to focus on developing conservation indices and ecological indicators in order to define successful conservation strategies and priority areas within the mixed ombrophyllous forests. ACKNOWLEDGMENTS The authors are grateful to Fundação de Apoio à Pesquisa Científica e Tecnológica de Santa Catarina (FAPESC) for supporting the IFFSC and to the anonymous reviewers for the comments on this manuscript. Resumen Este estudio es parte del Inventario Florístico Forestal de Santa Catarina, realizado para evaluar los recursos forestales, la composición de especies y la estructura de remanentes de bosque, y proporciona información para actualizar la conservación de los bosques y políticas de uso de la tierra en el estado brasileño de Santa Catarina (95 000km²). El inventario se aplica al muestreo sistemático, de 440 conglomerados en cuatro parcelas de 1 000m². cada una, situados en una red de 10x10km. Dentro de las parcelas, todos los individuos leñosos (DAP≥10cm) fueron medidos. El estrato de regeneración (altura>1.50m, DAP<10cm) se registra en 100m² en cada conglomerado. Este estudio realiza un análisis de 92 conglomerados medidos en 2008 dentro de un área de 32 320km² de bosques ombrófilos mixtos con Araucaria angustifolia ubicados en el altiplano del estado. La densidad media (DAP≥10cm) es de 578 individuos/ha (desde 85/ha hasta 1 310/ha), la media de la riqueza de especies en los remanentes es de 35 (8-62), la diversidad (H’) de Shannon y Wiener varía entre 1.05 y 3.48. A pesar de la alta diversidad total de especies (364 Magnoliophyta, cinco Coniferophyta y un helecho arborescente) y el alto promedio del área basal (25.75m²/ha, variando de 3.87 a 68.85m²/ha), la mayoría de los fragmentos de bosque se consideran altamente impactados por la tala, quema y ganadería extensiva, por lo tanto es necesario más medidas eficaces de protección. Palabras clave: inventario forestal regional, Araucaria angustifolia, estructura forestal, impactos antrópicos en florestas.. REFERENCES Arieira, J. & C.N. Cunha. 2006. Fitossociologia de uma floresta inundável monodominante de Vochysia divergens Pohl (Vochysiaceae), no Pantanal Norte, MT, Brasil. Acta Bot. Bras 20: 569-580. Budowski, G. 1965. Distribution of tropical american rain forest species in the light of successional processes. Turrialba 15: 40-42. Cavallari Neto, M. 2004. Efeito do manejo na diversidade genética de populações naturais de Tabebuia cassinoides LAM (DC), por marcadores isoenzimáticos. Master Thesis, Universidade de São Paulo, Piracicaba, São Paulo, Brazil. Chazdon, R.L., S.G. Letcher, M. van Breugel, M. Martínez-Ramos, F. Bongers & B. Finegan. 2007. Rates of change in tree communities of secundary Neotropical Forests following major disturbances. Phil. Trans. R. Soc. B. 362: 273-289. Condit, R., S.P. Hubbel & R.B. Foster. 1993. Identifying fast-growing native trees from the Neotropics using data from a large, permanent census plot. Forest. Ecol. Manag. 62: 123-143. Connell, J.H., J.G. Tracey & L.J. Webb. 1984. Compensatory recruitment, growth and mortality as factors maintaining rain forest tree diversity. Ecol. Monograph. 54: 141-164.. Rev. Biol. Trop. (Int. J. Trop. Biol. ISSN-0034-7744) Vol. 59 (3): 1371-1387, September 2011. 1385.
(16) Connell, J.H. & M.D. Lowman. 1989. Low-diversity tropical rain forests: some possible mechanisms for their existence. Am. Naturalist 134: 88-119. Felfilli, J.M. 1997. Diameter and height distributions in a gallery forest tree community and some of its main species in central Brazil over a six-year period (19851991). Rev. Bras. Bot. 20: 155-162. Felfilli, J.M. & M.C. Silva-Junior. 1988. Distribuição de diâmetros numa faixa de cerrado na Fazenda Água Limpa (FAL) em Brasília-DF. Acta Bot. Bras. 2: 85-104. Figueiredo Filho, A., A.N. Dias & L.F. Watzlawick. 2006. Inventário das florestas naturais na Floresta Nacional de Irati, Estado do Paraná. Unicentro, Irati, Paraná, Brazil. Formento, S., L.A. Schorn & R.A. Ramos. 2004. Dinâmica estrutural arbórea de uma Floresta Ombrófila Mista em Campo Belo do Sul, SC. Cerne 10: 196-212. Guariguata, M.R. & R. Ostertag. 2001. Neotropical secondary forest succession: changes in structural and functional characteristics. Forest Ecol. Manag. 148: 185-206. Klein, R.M. 1960. O aspecto dinâmico do pinheiro brasileiro. Sellowia 12: 9-16. Klein, R.M. 1978. Mapa fitogeográfico de Santa Catarina. Herbário Barbosa Rodrigues, Itajaí, Santa Catarina, Brazil. Klein, R.M. 1979. Ecologia da flora e vegetação do vale do Itajaí. Sellowia 31: 1-189. Klein, R.M. 1990. Espécies raras ou ameaçadas de extinção, Estado de Santa Catarina. IBGE, Rio de Janeiro, Brazil. Klein, R.M. & G.G. Hatschbach. 1970/71. Fitofisionomia e notas complementares sobre o mapa fitogeográfico de Quero-Quero (Paraná). Bol. Par. de Geociências 28/29: 159-188. Lamprecht, H. 1989. Silviculture in the Tropics. Deutsche Gesellschaft für Technische Zusammenarbeit (GTZ) GmbH, Eschborn, Germany. Legrand, C.D. & R.M. Klein. 1969. Mirtáceas – Myrcia. Flora Ilustrada Catarinense. Herbario Barbosa Rodrigues, Itajaí, Santa Catarina, Brazil. Legrand, C.D. & R.M. Klein. 1970. Mirtáceas – Myrceugenia. Flora Ilustrada Catarinense. Herbario Barbosa Rodrigues, Itajaí, Santa Catarina, Brazil.. 1386. Leite, P.F. 2002. Contribuição ao conhecimento fitoecológico do Sul do Brasil. Ciência e Ambiente 24: 51-73. Lepsch-Cunha, N. 1996. Variabilidade Genética Intrapopulacional de Duas Espécies de Baixa Densidade na Amazônia Central: Couratari multiflora (J.E. Smith) Eyma e Couratari guianensis Aublet. Master Thesis, Universidade de São Paulo (ESALQ), Piracicaba, São Paulo, Brazil. Letcher, S.G. & R.L. Chazdon. 2009. Rapid recovery of biomass, species richness, and secies composition in a forest chronosequence in northeastern Costa Rica. Biotropica 41: 608-617. Lieberman, D. & M. Lieberman. 1987. Forest tree growth and dynamics at La Selva, Costa Rica (1969-1982). J. Trop. Ecol. 3: 347-358. Lingner D.V., Y.M.M. Oliveira, N.C. Rosot & F.L. Dlugosz. 2007. Caracterização da estrutura e da dinâmica de um remanescente de Floresta com Araucária no Planalto Catarinense. Pesq. Flor. Bras. 55: 55-66. Longhi, S.J. 1997. Agrupamento e análise fitossociológica de comunidades florestais na sub-bacia hidrográfica do rio Passo Fundo-RS. Ph.D. Thesis, Universidade Federal do Paraná, Curitiba, Paraná, Brazil. Longhi, S.J., D.A. Brena, J.F. Gomes, I.S. Narvaes, G. Berger & A.J. Soligo. 2006. Classification and characterization of stages of succession in mixed rainy forests remains in São Francisco de Paula’s National Forest (FLONA), RS, Brazil. Ciênc. Flor. 16: 113-125. Lugo, A. E. 1990. Tropical secondary forests. J. Ecol. 6: 1-32. Marimon, B.S. & J.M. Felfilli. 2000. Distribuição de diâmetros e alturas na floresta monodominante de Brosimum rubescens Taub. na Reserva Indígena Areões, Água Boa-MT, Brasil. Rev. Árvore 24: 143-150. Metzger, J.P. 2009. Conservation issues in the Brazilian Atlantic Forest. Biol. Cons. 142: 1138-1140. MMA (Ministério do Meio Ambiente). 2008. Lista oficial de espécies da flora brasileira ameaçada de extinção. Diário Oficial da União de 24 de setembro de 2008. Mueller-Dombois, D. & H. Ellenberg. 1974. Aims and methods of vegetation ecology. Wiley, New York, New York, USA. Murphy, P.G. & A.E. Lugo. 1986. Ecology of tropical dry forest. Ann. Rev. Ecol. Syst. 17: 67-88. Negrelle, R.A.B. & F.C. Silva. 1992. Fitossociologia de um trecho de floresta com Araucaria angustifolia (Bert.). Rev. Biol. Trop. (Int. J. Trop. Biol. ISSN-0034-7744) Vol. 59 (3): 1371-1387, September 2011.
(17) O. Ktze. no município de Caçador-SC, Bol. Pesq. Flor. 24/25: 37-54.. a soil hydrological gradient in the tropical rain forest of Guyana. Oecologia 100: 356-367.. Odum, E.P. 1983. Ecologia. Guanabara, Rio de Janeiro, Brazil.. Tarazi, R., A. Mantovani & M.S. dos Reis. 2010. Fine-scale spatial genetic structure and allozymic diversity in natural populations of Ocotea catharinensis Mez. (Lauraceae). Conservat. Genet. 11: 965-976.. Oliveira-Filho, A.T., J.R.S. Scolforo & J.M. Mello. 1994. Composição florística e estrutura comunitária de um remanescente de floresta semidecídua Montana em Lavras, MG. Rev. Bras. Bot. 17: 167-182. Peters, C.M., M.J. Balick, F. Kahn & A.B. Anderson. 1989. Oligarchic forests of economic plants in Amazonia: utilization and conservation of an important tropical resource. Conserv. Biol. 3: 341- 349. Redford, K.H. 1992. The empty forest. BioScience 42: 412-422. Reitz, R., R.M. Klein & A. Reis. 1978. Projeto Madeira de Santa Catarina. Sellowia 28-30: 11-320. Ribeiro, M.C., J.P. Metzger, A.C. Martensen, F.J. Ponzoni & M.M. Hirota. 2009. How much is left, and how is the remaining forest distributed? Implications for conservation. Biol. Cons. 142: 1141-1153. Richards, P.W. 1996. The tropical rain forest. Cambridge University, Cambrige, United Kingdom. Sampaio, M.B. & E.S.G. Guarino. 2007. Efeitos do pastoreio na estrutura populacional de plantas em fragmentos de Floresta Ombrófila Mista. Rev. Árvore 31: 1035-46. SOS Mata Atlântica, Instituto Nacional de Pesquisas Espaciais. 2010. Atlas dos remanescentes florestais da mata Atlântica, período 2008-2010. (Downloaded: February 24, 2011, www.sosmatatlantica.org.br). Steege, H. 1994. Flooding and drought tolerance in seeds and seedlings of two Mora species segregated along. Tilman, D. & S. Pacala. 1993. The maintenance of species richness in plant communities, p. 13-25. In R.E. Ricklefs & D. Schluter (eds.). Species diversity in ecological communities: historical and geographical perspectives. University of Chicago, Chicago, USA. Veloso, H.P., A.L.R. Rangel Filho & J.C.A. Lima. 1991. Classificação da vegetação brasileira, adaptada a um sistema universal. IBGE, Rio de Janeiro, Brazil. Vibrans, A.C., A. Uhlmann, L. Sevegnani, M. Marcolin, N. Nakajima, C.R. Grippa, E. Brogni & M.B. Godoy. 2008. Data ordination of mixed rain forest structure based on information of Floristic Forest Inventory of Santa Catarina State, Southern Brazil: results of a pilot survey. Ciênc. Flor. 18: 511-523. Vibrans, A.C., L. Sevegnani, D.V. Lingner, A.L. Gasper & S. Sabbagh. 2010. The Floristic and Forest Inventory of Santa Catarina State (IFFSC): methodological and operational aspects. Braz. J. For. Res. 30: 291-302. Whitmore, T.C. 1998. An introduction to tropical rain forests. Oxford University, Oxford, United Kingdom. Windisch, P.G. 2002. Pteridófitas do Brasil: diversidade decrescente, p.196-198. In E.L. Araujo, A.N. Moura, E.V.S.B. Sampaio, L.M.S. Gestinari & J.M.T. Carneiro (eds.). Biodiversidade, conservação e uso sustentável da flora do Brasil. Univ. Fed. Rur. de Pernambuco & Soc. Bot. do Brasil, Recife, Pernambuco, Brazil.. Rev. Biol. Trop. (Int. J. Trop. Biol. ISSN-0034-7744) Vol. 59 (3): 1371-1387, September 2011. 1387.
(18)
(19)
Figure
+4

Documento similar
The causes of forest mortality are inherently complex and difficult to predict [42]. In our study, Aleppo pine defoliation and mortality has been related to ‘Candidatus
scleroxylon, one of the most valuable and fragile timber species from the Chiquitano forest in Santa Cruz de la Sierra, Bolivia, (ii) to quantify the changes in
This is due to the will of the micro-retailers to remain small and the fact of not having enough resources to deal with this type of structure and (6)
This divide between extractivism and cultivation of NTFPs reflected the important dichotomy that characterizes forest management more generally, namely between natural
1. Provide the year that your year-specifíc data refers to. Alíhough we will attempt to standardize by using data from 1998, enter a different date here if the bulk of the data
Other variables were highly influential at some of the spatial scales, showing a greater resistance in pine forests or plantations with a higher diversity of pine sizes, greater
Thus, the aim of this study was to (i) determine the effect of the cover management techniques (grazing, mowing and tillage) on the floristic composition in the cover vegetation
The aim of this work was to analyse in detail the relative contribution of spiders to the diet of Great Tit nestlings in a typical Mediterranean forest. We analysed
