Smoke but do not inhale: capital inflows, financial markets and institutions, a tale from three emerging giants
78
0
0
Texto completo
(2) The Working Group on Development and Environment in the Americas, founded in 2004 under the initiative of the Global Development and Environment Institute at Tufts University, brings together economic researchers from several countries in the Americas who have carried out empirical studies of the social and environmental impacts of economic liberalization. The Working Group‟s goal is to contribute empirical research and policy analysis to the ongoing policy debates on national economic development strategies and international trade. The Working Group has completed three projects, with associated policy reports and books, most in Spanish, English, and Portuguese: Globalization and the Environment: Lessons from the Americas (2004) http://ase.tufts.edu/gdae/WorkingGroup.htm Foreign Investment and Sustainable Development: Lessons from the Americas (2008) http://ase.tufts.edu/gdae/WorkingGroup_FDI.htm The Promise and the Perils of Agricultural Trade Liberalization: Lessons from Latin America (2008) http://ase.tufts.edu/gdae/WorkingGroupAgric.htm The Policy Reports and Discussion Papers produced by the Working Group can be found on the web at: http://ase.tufts.edu/gdae/WGOverview.htm. Leonardo E. Stanley is a researcher at CEDES and at the MERCOSUR Economic Research Network. © 2011, Leonardo E. Stanley and the Working Group on Development and Environment in the Americas. 1.
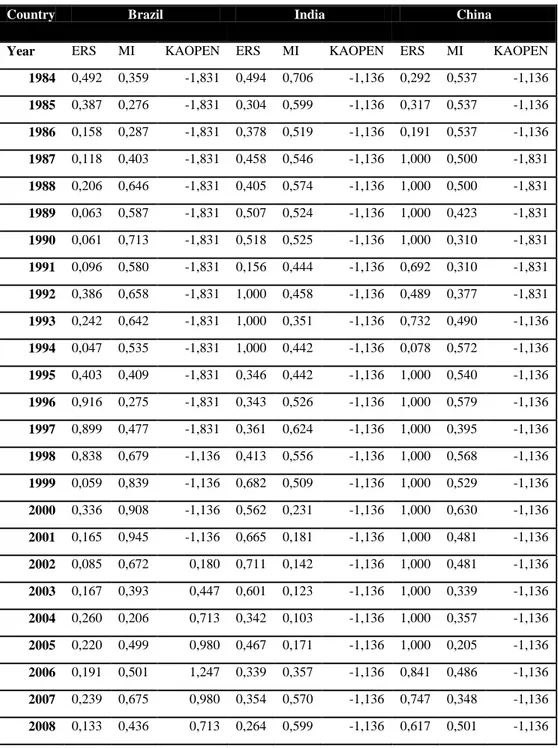
(3) Index 1. Introduction .................................................................................................................. 7 2. At the macro level: the capital account and the impossible trinity ............................ 10 Brazil – Macro ........................................................................................................ 12 India - Macro .......................................................................................................... 21 China - Macro ......................................................................................................... 31 3. At the micro level: financial markets .......................................................................... 40 Brazil – Micro......................................................................................................... 40 India - Micro ........................................................................................................... 44 China - Micro ......................................................................................................... 47 4. Financial Globalization, Capital Controls and Institutions....................................... 53 Liberalization at the multilateral level ........................................................................ 53 Liberalization at the bilateral and regional level ........................................................ 55 Brazil - Institutions ................................................................................................. 56 India - Institutions................................................................................................... 57 China - Institutions ................................................................................................. 59 5. Conclusions ............................................................................................................ 64 References ....................................................................................................................... 67 Annex .............................................................................................................................. 74 List of graphs Graph 1: Brazil, FDI as a percentage of GDP (1981-2011) ........................................... 13 Graph 2: Brazil, interest rates (January 2003 – July 2011) ............................................ 14 Graph 3: Brazil, foreign exchange reserves.................................................................... 16 Graph 4: Brazil, Net Financial Flows (1995-2010) (U$ Millions) ................................. 17 Graph 5: US dollar versus Brazilian Real exchange rate (January 1995 – June 2011) .. 18 Graph 6: Brazil, playing the Trilemma (1984-2009)...................................................... 20 Graph 7: US dollar versus Indian rupee exchange rate (January 1995 – June 2011) ..... 22 Graph 8: Net Investment by FIIs in the Indian Capital Market (April 2006 – June 2010) ................................................................................................................................ 23 2.
(4) Graph 9: India, foreign investments inflows (1991-92 to 2009-2010) (Million of U$ dollars) .............................................................................................................. 25 Graph 10: India, ECBs average maturity (in months) (August 2006 – June 2011) ....... 25 Graph 11: India, Foreign exchange reserves (U$ billions) ............................................. 27 Graph 12: India, interest rate (January 2002 – July 2011) ............................................. 29 Graph 13: India, playing the Trilemma (1984-2009) ..................................................... 30 Graph 14: US dollar versus Chinese Yuan exchange rate (January 1995 – July 2011) . 33 Graph 15: China´s foreign exchange reserves minus gold (Billion of U$ dollars) ........ 34 Graph 16: China, interest rate (January 2002 – July 2011) ............................................ 37 Graph 17: China, playing the Trilemma ......................................................................... 38 Graph 18: China´s Banking Institutions, Total Assets and Liabilities (Unit: RMB 100 million) ................................................................................................................... 49 Graph 19: BICs current account balance (U$ Billions) (1980-2010) ............................. 74 Graph 20: BICs GDP evolution ...................................................................................... 74 Graph 21: Chin – Ito Capital Account Index .................................................................. 75 List of tables Table 1: Brazilian growth in historical perspective, average rate (%) ........................... 12 Table 2: Brazil, capital flow management related measures (from October 2009 to January 2011) ......................................................................................................... 19 Table 3: India, ECBs and FCCBs registered with the Reserve Bank (in U$ millions) .. 26 Table 4: India, movements in Foreign Exchange Reserves (U$ millions) ..................... 28 Table 5: China financial account (1997-2010) (U$ dollars, 100 MM) .......................... 32 Table 6: Brazilian Banking, market structure by assets and loans ................................. 43 Table 7:India, percentage share of bank groups (only commercial banks) .................... 45 Table 8: Comparison of capital account liberalization and financial service liberalization ................................................................................................................................ 53 Table 9: WTO – China commitments in the banking sector .......................................... 61 Table 10: Aizenman, Chinn and Ito data for BICs, Evolution 1984-2009 ..................... 76 Table 11: Bank return on equity, selected countries (2006-2009) ................................. 77 Table 12: Banks NPLs to Total Loans ratio, selected countries (2006-2009) ................ 77. 3.
(5) Table 13: Bank Regulatory Capital to risk – weighted asset .......................................... 77. 4.
(6) “Smoke but do not inhale”: Capital Inflows, Financial Markets and Institutions, a Tale from Three Emerging Giants Leonardo E. Stanley Executive Summary The recent international financial crisis has, among other consequences, raised a new interest on Keynes and Minsky and their vigilant stance towards unregulated short-term capital flows. As large amounts of capital are flowing back to emerging markets, even the IMF recognizes that some form of regulation may be convenient. Brazil comes as a useful example. In 2009 authorities reintroduced a 2 per cent tax on foreign loans, subsequently raised to 6%. But in spite of those increases and of other prudential measures introduced by the government, foreign capital keeps flowing in. At 12 per cent the interest rate in Brazil ranks among the highest on the world, consequently attracting speculative investors from everywhere and leading to further appreciation of the Real. The appreciation trend experienced by the local currency, however, won´t stop with taxes to capital inflows. A more substantial approach may be helpful. The experience of both China and India might prove exemplary. In the case of India, authorities persisted in their cautious and multi-faceted approach with regard to capital flows and financial integration. Certainly, India has always maintained important controls on their capital account during the whole process. It is also maintained that the presence of strong capital control mechanisms, on both inflows and outflows, isolated China from financial market volatility. There is now a consensus among policy makers and academics on China´s gradualist route towards development along on the relevance of tight capital restrictions. In other emerging economies financial deregulation gained momentum, capital flows transformed into bank liabilities almost instantly, increasing the feasibility of currency and maturity mismatch problems. Henceforth, regulating cross-border transactions can be seen as imperative. A series of options are available, including the introduction of reserve requirements or the prohibition of certain financial transactions. Brazil moved in that direction since 2008 but more radical options are also available. Both China and India have maintained a certain degree of financial repression, blocking the entrance of foreign banks or banning them from financing local private agents. Despite the progress at the macro front, capital controls and prudential measures in financial markets could certainly be institutionally contested as recent RTAs, including BITs and FTAs,. 5.
(7) expressly banned them. While most developing countries and transition economies actively introduced or passively acquiesced neoliberal packages offered to them, the larger emerging economies (China, India, Brazil) reworked their national development strategies to define a more complementary role for foreign investment and actively sought to limit or reduce the risks associated with FDI, or those related to portfolio investment. In other words, this group of countries were very cautious on the institutional front, reducing their legal risks and Brazil directly rejected any sort of legal constraint from bilateral treaties. China and India also profited all the legal loopholes of the WTO/GATS system. In particular, the right given to member countries by GATS to maintain sovereignty over prudential and related regulations of all financial firms resident in the countries.. 6.
(8) 1. Introduction In the past, foreign shocks spread to national economies mainly through trade channels, and transmission of such shocks took time. After globalization and increasing capital account liberalization, most cross-border transactions become delinked from trade, financial related instead. Henceforth, shocks arrive at domestic financial markets almost immediately. When coupled with financial deregulation, freeing completely the capital flows might certainly increase the probability of a crisis particularly among poorly developed domestic financial systems. The problem aggravates as emerging countries´ interest and inflations rate continued to remain higher than in major advanced economies. But conventional monetary policy responses might not work under this macro scenario, as exchange rate movements are more likely to be linked to changes in capital than trade flows. Henceforth, Central Bank´s responses might now address the issue when moving its interest rate. The effects of exchange rate movements are not just confined to price stability. Under a regime of capital account openness exchange rate dynamics might enhance financial system fragility. Henceforth, policy – makers might carefully control misalignments at both, interest rate and exchange rate, in order to maintain the economy performing. To some extent, the actual situation began its trend after the collapse of the Bretton Woods system in the earliest 1970s, implying the irruption of a new flexible exchange rate system and the dismantling of former controls on capital flows worldwide extended. The shift towards free markets was accelerated with the coming to power of Margaret Thatcher and Ronald Reagan in 1979 and 1980 respectively. The predominant neoliberal vision perceived increased financial activity as beneficial for development and, Keynesian-Myskian caveats were set aside. By the same token, the efficient market hypothesis substituted Keynes´ beauty contest parabola of how financial market actually behaves. That was the central message arriving from the developed world, and being vociferated by the International Financial Institutions (IFIs), throughout a collective of instructions enclosed under the Washington Consensus. Henceforth, rescue packages originated at the International Monetary Fund (IMF) or World Bank (WB) lending practices, introduced new clauses of financial deregulation and capital account fully convertibility. Under this new framework, developing countries were urged to liberalize their capital account and deregulate their financial sector. In other words, a micro-macro initiative was under operation. Sooner than later Wall Street and the US government began to move forwards the institutionalization of this scenario, both at the bilateral and multilateral foray.. 7.
(9) International investment agreement (IIAs) 1 would swiftly become the centre of a new legal framework supporting the liberalization task2. Financial liberalization was also integrated at the Uruguay round, and numerous new instruments were soon launched at the newly created WTO, including those introduced by the General Agreement on Trade in Services (GATS) 3 . Henceforth, either on a bilateral or multilateral basis, developing and emerging economies passed through a [legal or institutional] process of financial deregulation and capital account liberalization. Following the failure of Lehman Brothers there was a substantial reversal in portfolio capital inflows affecting emerging economies. But, as emerging economies proved resilient to the contest, portfolio investors swiftly returned. Many emerging countries have received capital flows much than their financial requirements, as the Brazil case might be illustrating. As a consequence a more nuanced opinion on the beneficial role of short-term capital inflows emerge, recognizing that excess funds may give rise to asset bubbles and macro instability. The paper analyses the liberalization wave, at both macro and micro levels, and its legal consequences among three emerging giants: China, India and Brazil. In a first section, it considers the financial, monetary and exchange rate policy options adopted by those countries attempting to reflect how they confronted the Impossible Trinity (commonly referred as the Trilemma4). Certainly, the deepening of domestic and international financial markets has also influenced the responses posed by the previous mentioned trilemma. The point is referred in the second section that briefly analyse banking regulation and market structure. In a third section, the paper looks at institutional transformation launched at both, multilateral and bilateral level which might be preventing the regulation of capital flows or affecting market entry conditions. Finally, some conclusions are drawn, scrutinizing the sequencing options adopted by these countries and how analysed countries responded to the new institutional scheme. The analysed countries, particularly China and India, have resisted short-term capital flows, intervening in the foreign exchange markets, introducing controls and maintaining a highly 1. Among others, IIAs include the following: Bilateral Investment Treaties (BITs), Free Trade Agreements (FTAs), Regional Trade Agreements (RTAs), and Economic Partnership Agreements (EPAs). 2. Initially built-in a bilateral format, investment liberalization will spread later under a free trade scheme. Particularly, following the signal of the North American Free Trade Agreement (NAFTA). 3. It might be also consider the Agreement on Trade-Related Aspects of Intellectual Property Rights (TRIPs), and the Trade-Related Investment Measures Agreements (TRIMs) 4. As an expression, the trilemma has been introduced by logicians at the 17th century, in order a describe a situation in which someone faces a choice among three options, each of which comes with some inevitable problems (Mankiw, 2010).. 8.
(10) repressed financial system. Rephrasing FT´s columnist Martin Wolf, they “smoke but do not inhale”.. 9.
(11) 2. At the macro level: the capital account and the impossible trinity The incompatible trinity is a term used in discussing the problems associated with creating a stable international financial system. It refers to the impossibility to achieve simultaneously the triple contradicting, but desirable goals of fixing its exchange rate (to foster stabilization of trade and growth), of running an independent monetary policy (to achieve domestic monetary policy goals) and of freeing completely its capital flows (for an optimal allocation of resources). According to the Mundell-Fleming model, a small, open economy cannot achieve all three of these policy goals at the same time: in pursuing any two of these goals, a nation must forgo the third. Under the golden standard, the trilemma was fully operative. Capital flows were almost unfettered and currencies tied to gold. External shocks were passing through the national economy without further restrictions, and the economy enthused alongside capital inflows movements. Monetary policy was absent from the policy discussion, and authorities incapable to manipulate interest rates. The financial architecture settled down at the Bretton Woods Conference radically altered the previous scheme, introducing a more stable regime although a more closed one. National currencies become pegged to the US dollar, which in turn, was tied to gold. Nearby all countries maintained capital controls on both inflows and outflows 5 , consequently, international financial markets were tiny and highly regulated. But, at the beginning of the seventies the previous consensus collapsed. The new global scenario was one of high liquidity affecting agents‟ perceptions over the costs and benefits of regulate the capital account. The world observed an unprecedented growth in financial products, and private capital flows began to return to the South. The system of fixed exchange rates broke down, and a new market-friendly era began. Unfortunately, such an abrupt change came deprived of provisions. Developing countries were clearly less protected, henceforth more exposed to further macro instability and deprived of accurate regulatory tools. Uncontrolled capital movements affected the real exchange rate with significant costs on the real side6 although their financial effects are 5. Capital controls could take a quantitative or qualitative character, affecting inflows and / or outflows. Among the regulations affecting capital inflows could be mentioned those introducing minimum stay requirement or limiting local agents (domestic firms and residents) from borrowing in foreign currencies, or the introduction of unremunerated reserve requirement (URR). Exchange controls or taxes / restrictions on outflows could be cited as an example of management techniques affecting outflows. Price-based techniques include the Tobin tax or the URR, whereas quantitative – based measures include quantitative limits on foreign ownership of domestic companies stock or reporting requirement and quantitative limits on borrowing from abroad. 6. Uncontrolled capital flows could alternative be mitigated by encouraging local firms to invest abroad (outward FDI) or by maintaining a permissive policy towards capital controls, thus helping investors to invest abroad (i.e.: capital flights).. 10.
(12) certainly critical. Under an open economy environment monetary policies have both monetary and exchange rate consequences. Henceforth, policy – makers confronts a new problem when dealing with inflation, as usual interest rate tools cannot solve since raising short-term rates induce speculators from everywhere to enter into the market (the so-called “carry-trade” subject)7. The quantitative easing policy practised by the US and other advanced economies added more pressure to the picture: with interest rates close to zero, cross-arbitrage remains prevalent. But not only interest rates are far from equilibrium, exchange rate efficiency has also become increasingly questioned. Exchange rate influence, on the other hand, is not only limited on trade related effects, but additionally its impact spawned to net capital gains obtained by private agents external holdings, the so –called “valuation effect” (Lane and Shambaugh, 2009). Nevertheless, and despite this sort of problems a true crusade against financial regulation and capital controls unleashed, and monetary authorities at developing countries become a territory to conquest. Liberalization and deregulation have also transformed the banking industry, transforming financial institutions into powerful actors. The financial boom began to transform into a burst, however, someone in between 2004 to 2008. Risk seeking by voracious investors reached unprecedented levels, and capital inflows began to flood into emerging markets profiting from high yields and calm waters. And then, the Lehman Brothers collapse, and the “perfect storm” began. But the accumulation of international reserves, among other factors, gave more leeway to policy makers at emerging economies (Frenkel, 2007; Aizenman et.al., 2008) 8 . Nonetheless, and above all, those countries playing at the vertexes of the triangle became more exposed whereas cautious countries performing at the interior made relatively well. Certainly, and considering the policy options adopted by the analysed countries, China and India avoided the hard corners more fervently than Brazil. The following paragraphs introduce the experiences of Brazil, China and India, including the main policy response introduced by authorities in these countries in the aftermath of the crises. Policy options were certainly more extreme at Brazil, although less radical when compared. 7. In a carry trade, an investor holds a high-yielding (“target”) currency assets financed with a lowyielding (“funding”) currency liability. In the present context, Brazilian Real or Chinese Yuan qualifies are considered target currency, whereas US dollar or Japanese yen could be considered as funding currencies. 8. Frenkel introduces a thought-provoking idea: the trilemma should be considered false as a general theorem. According to the author, in a context signed by an excess supply of international currency, the central bank can simultaneously control the exchange rate and the interest rate (Frenkel, 2007; page 30). Aizenman, by contrast, sustain a less radical idea, claiming that the trilemma remains latent but international reserves reduce the constraints faced by the (open) economy. In particular, international reserves can reduce both the probability of a sudden stop and the deep of the resulting output collapse when the sudden stop occurs (Aizenman et.al., 2008; page 2).. 11.
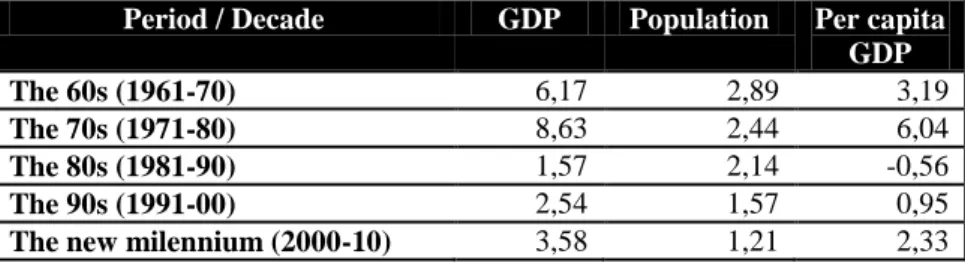
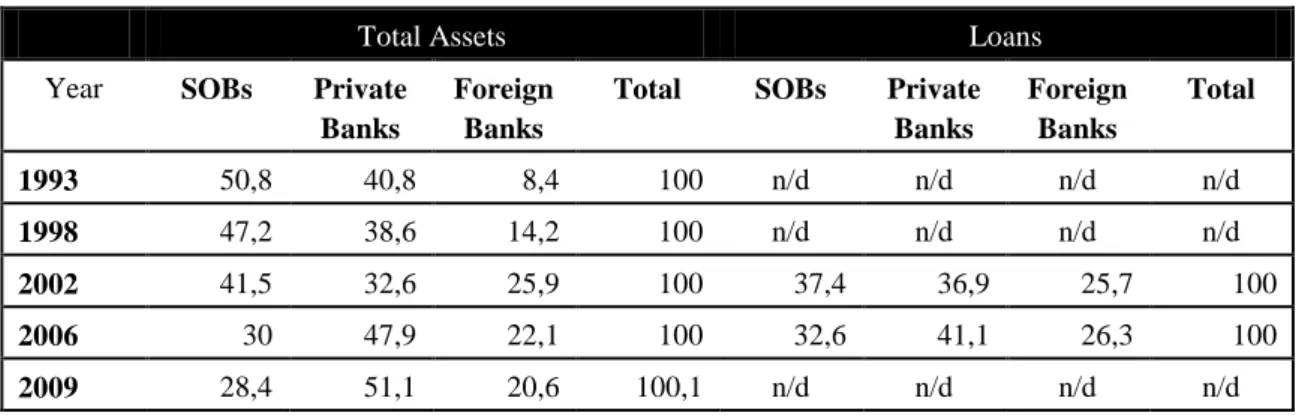
(13) against their Latin American pairs. Policy makers at both China and India were more precautious, interested in preserve policy space and macro autonomy. Nevertheless, the recent crisis reinforced authorities in the three countries to maintain away from the vertexes, particularly in managing the capital account openness.. Brazil – Macro Until the early nineties, Brazil followed a policy of industrialization by substitution of imports (ISI), with strong involvement of multinational (market seeking) companies (particularly, directing towards the manufacturing sector) 9 attracted by the promise of the internal market rather than any legal protection available, and in spite of the existence of some sectorial restrictions consistent with the ISI model10. At the banking industry, in particular, authorizations for entry were only conceded on a reciprocal basis and, once entered, foreign banks were also subject to special capital requirements (Freitas, 2009). Thoughout all this period, the Brazilian economy experienced a outstanding evolution, particularly during the 1970s (“os anos do miraclo”) when growth rates averaged a 8,63 percent of annual increasse. But, Brazil become more nor less dependent on foreign inputs during this period, pushing the economy to recurrent balance of payments crisis. Table 1: Brazilian growth in historical perspective, average rate (%) Period / Decade The 60s (1961-70) The 70s (1971-80) The 80s (1981-90) The 90s (1991-00) The new milennium (2000-10). GDP. Population. 6,17 8,63 1,57 2,54 3,58. 2,89 2,44 2,14 1,57 1,21. Per capita GDP 3,19 6,04 -0,56 0,95 2,33. Source: Fundación Getulio Vargas and IBGE The rise in global interest rise coupled with a sharp rise in oil prices exposed Brazilian structural weakness. The external debt crisis aggravated the pre-existent fiscal and financial gaps and the collapse of the internal market put a damper on business prospects and FDI halted. New tensions became apparent in the Brazilian treatment of FDI, thereafter. Decree-Law Nº 1986/82 introduced a series of restrictions for foreigners to operate at the local capital market. A 1988 constitutional amendment introduced further restrictions, including a formal ban to operate in 9. The arrival become stimulated by various types of incentives, as the government felt that they were needed in order to accelerate the country´s industrial development (Baer, 2008) 10. For instance, foreign investors were obliged to register in the Central Bank in keeping with existing foreign exchange and tax controls. But, on the other hand, the government were guaranteeing MNCs the “right of return” and of profit remittances (Carvalho and Souza, 2010).. 12.
(14) the banking industry. But, despite these legal attempts, authorities become confidently in moving into a new macro approach. Deregulatory initiatives and liberalization measures were undertaken under both Collor de Melo and Itamar Franco governments, including the opening of the securities market to foreign investors and the permission to transfer financial resources abroad without proof of previous internment (through the so-called CC5 results) (Carvalho and Souza, 2010). However, and despite the efforts the inflationary burden continued. Graph 1: Brazil, FDI as a percentage of GDP (1981-2011) 6,0%. 5,0%. 4,0%. 3,0%. 2,0%. 1,0%. 20 10 11 (* ). 09. 20. 08. 20. 07. 20. 06. 20. 05. 20. 04. 20. 03. 20. 02. 20. 01. 20. 00. 20. 99. 20. 98. 19. 97. 19. 96. 19. 95. 19. 94. 19. 93. 19. 92. 19. 91. 19. 90. 19. 89. 19. 88. 19. 87. 19. 86. 19. 85. 19. 84. 19. 83. 19. 82. 19. 19. 19. 81. 0,0%. Source: Banco Central do Brasil On July, 1994, the government launched a new programme (Real Plan) aimed to curb inflation by commiting to maintain an exchange rate ceiling of one-to-one parity with the dollar11. A few months before Brazil normalized the financial front by achieving an agreement with the international banking sector (i.e.: Brady Plan). Hereafter, Brazilian authorities adopted a more liberal and market-friendly approach toward national development. The plan was fully successful in settling the inflation down, putting an end to contract indexation and chronic high inflation. From a political perspective, the success of the plan granted the Ministry of Economy. 11. In contrast to the Convertibility Plan in Argentina, the monetary authorities at Brazil did not explicitly state the relationship between changes in the monetary base and foreign reserves movements, henceforth, allowing for some discretionary leeway.. 13.
(15) (Fernando Henrique Cardoso - FHC), the possibility to run for the presidential race. Attracted by the privatization programme and the new macro environment, FDI inflows significantly increased thereafter (see previous graph). The success generated some complications, however, including an important bias towards exchange rate appreciation (depressing manufactured exports) and demand expansion (pulling for imports). The plan stemmed powerless to knot the fiscal front and, henceforward, induced a rapidly – accumulating external debt. External imbalances, in turn, leave the economy at the mercy of financial speculators12. Graph 2: Brazil, interest rates (January 2003 – July 2011). Politics put more stress on the picture, as markets permanently questioned Lula involvement in the 1998 Presidential race. In order to keep the exchange rate, the government profited from an IMF syndicate loan that proved unsuccesful to revert market expectations. Under this circumstances, the re-elected president (FHC) decided the Real to float, in January 1999, convinced that the currency would be less vulnerable to future speculative attacks. The new approach included an inflation targeting regime along more pressure on achieving primary fiscal surplus (Fiscal Responsibility Law). During this period Brazil attracted an important number of foreign investors (Mortimore and Stanley, 2010), including the massive entrance of portfolio investments which put more pressure on the exchange rate13. The economy growth at very low. 12. In might be important to emphasize the low interest rate level observed among industrialize countries in the nineties. Henceforth, pushing capital towards emerging economies as investors look after better returns. During the Asian crisis the country lost U$ 11 billion in reserves in three months, forcing the Central Bank to raise interest rates from 19% annual average to 46% at November 1997. Few months‟ later, high interest rates pulled foreign investors back, although “temporarily”: the Russian crisis pulls them out again (Carvalho and Souza, 2010). 13. Capital inflows increased spectacularly in the nineties, in both FDI and financial flows: whereas at 1990 capital flows represented 0,9% of Brazilian GDP, ten years later they totalized 3,8%. Considering 14.
(16) rates, however, as the government opted for a contractive fiscal policy and mantained very high real interest rates14. But volatility remained. The occurrence of new external shocks (Russia, Argentina, dot.com bubble at the US) aggravated the external front. Confronted to a new crisis, economic authorities acted similarly to the previous one: raising interest rates and causing the economy to contract (Cardim de Carvalho e Pires de Souza, 2010). Nevertheless, and despite all the undertakings made by the government towards the market, the Brazilian economy could not take off. In order to reduce volatility, and despite the liberalization path already launched15, economic authorities decided to advance throughout the regulation of capital inflows. The legal framework still contained elements dated from the Vargas administration (Carvalho and Garcia, 2006)16. Price-based schemes including explicit taxs on capital flows, foreign loans and certain exchange transactions17. The government also maintained different administrative controls as outright prohibitions against (or minimun maturirty requirement for) certain type of inflows (“sand in the wheel” provisions). But, the effectiveness of capital controls remained questioned (Cardoso and Golpin (1998), Sohiet (2002), Paula, Oreiro and Silva (2003), Carvalho and Garcia (2006), basically after the ineffectiveness of the fiscal policy18. A different and more the 1990-2000 period, mid and long term inflows totalized U$ 95,8 billions – mostly commercial notes (71,0%), followed by inter-firm credits (17,1%), bonds (5,9%) and commercial papers (4,3%). Short – term flows, in turn, were important till 1995, thereafter-monetary authorities began to bet hard against speculative capitals (Terra and Sohiet, 2006). 14. Between 1995 and 2007, the average GDP growth was 2,9%. Average nominal interest rates between 1995 and 2007 were around 22,9% per year, although slightly lower for the 2000-2007 sub-period: 17,5% (nominal) and 9,8% (real). A high interest rate certainly reflected a policy choice made by the monetary authority in order to maintain the inflation at low levels. Contractive fiscal policy, in turn, become entrenched in the inflation targeting scheme, pushing the country to push for high target goals for primary surplus – between 3,75% and 4,25 of GDP during the 2000-2007 period. But, although the primary fiscal surplus might have contributed to lowering the debt burden, the external vulnerability led it to an increase in the short and medium term debt (Ferrari-Filho and Spanakos, 2009). 15. As an example, Terra and Sohiet (2006) mentioned the approval of two resolutions (Nº 1832/91 and Nº 1482/92) reducing the short-term capital stance, along the CBB Resolution Nº 2388 constituting the foreign capital fixed-rent fund. Since 1997, the FHC government introduced a series of rules and measures, resuming the opening of the capital account. But the path was further discontinued following the Asian crisis, as the Brazilian authorities re-introduced different policies to curb the increase in capital outflows. 16. Brazilian legal framework included [at 2006] the following requirements: foreign exchange must be converted into the national currency; export revenues and resources secured offshore must be brought back into the country; and private exchange rate transactions are prohibited (Carvalho and Garcia, 2006). 17. The so-called tax on financial operations (or Imposto sobre Operações Financeiras – IOF) was introduced at June, 1994 by Law Nº 8.894. Inflows were mostly charged at 2% - although some operations were exempted, as those involving the State (local, regional or national) and their related companies and payments accruing to import and exports operations. 18. Cardoso and Golpin (1998) introduce an index of capital controls describing all legal transformation affecting the capital inflows, including all the normative introduced by the Central Bank of Brazil.. 15.
(17) optimistic opinion become sustained by another group of scholars, for whom ineffectiveness (of capital controls) resulted from the absence of more more restrictive measures (Costa da Silva and Cunha Resende, 2010)19. Graph 3: Brazil, foreign exchange reserves $ 400.000,00. $ 350.000,00. $ 300.000,00. $ 250.000,00. $ 200.000,00. $ 150.000,00. $ 100.000,00. $ 50.000,00. $ 0,00 1994. 1995. 1996. 1997. 1998. 1999. 2000. 2001. 2002. 2003. 2004. 2005. 2006. 2007. 2008. 2009. 2010. jul-11. Since 2003 macro tended more favorable as commodity prices began to improve and exports continued to raise, moving the current account quickly from deficit to surplus20. The always problematic fiscal front become less traumatic as the economy recovered and government´s revenues raised – certainly helped by the impressive amount of exports proceeds. Favored by the new external scenario, the country also began to increase its gross international surpassing U$ 300 billions at July 2011, and relaxed the the always annoying debt constraint along. Last, but not least, interest rates began to coming down, albeit at very slowly rates and remaining settled at two-digit levels. All this set the Brazilian economy into a more relaxed site, but instable.. 19. In particular, Costa da Silva and Cunha Resende (2010) emphasize the importance of quantitative methods over price-type controls, particularly to deal with exchange rate crisis. 20. Considering a five-year period, Brazilian exports multiplied by a factor of 3,5, surppassing U$ 200 billions in 2010.. 16.
(18) Graph 4: Brazil, Net Financial Flows (1995-2010) (U$ Millions) $70.000,00. $60.000,00. $50.000,00. $40.000,00. $30.000,00. $20.000,00. $10.000,00. $1995. 1996. 1997. 1998. 1999. 2000. 2001. 2002. 2003. 2004. 2005. 2006. 2007. 2008. 2009. 2010. $-10.000,00. $-20.000,00. $-30.000,00. $-40.000,00 Foreign Direct Investment. Por olio Investment. Other Financial Investments. When the international financial crisis exploded, however, affected both the real and the financial side. Foreign investors´ aforementioned enthusiasm suddenly reversed, leading to a sharp decline in portfolio flows and other financial investments. MNCs subsidiaries established at Brazil also experiencing a sudden change of mood, increasing their remittances and payments abroad. These attitudes augmented the pressure on the real exchange rate, forcing the government to lead the initiative (Tabak et. al., 2010). Among the measures undertaken by the government, the economic team impulsed the expansion of banking loans throughout monetary instruments 21 and by the enactment of new credit lines at the Brazilian Development Bank (BNDES) (Sobreira & de Paula, 2010). At the monetary front, authorities rushed to shield the system from a systematic crisis, introducing new rediscount lines and liquidity provisions (auctions of loans reserves and currency swaps agreeements) (Tabak, et. al., 2010) 22 and enacting new regulatory and prudential measures. At the fiscal front, policy actions were oriented to induce private agents consumption and investment expenses, introducing a more adaptable position over it previous more ortodox approach. A high level of international 21. In order to push financial institutions towards credits, the government introduce penalties in the reserve requirement of time deposits. Another important set of measures was related to development of the discount windows procedures and of the Credit Guarantee Fund (CGF). The creation of a special type of time deposit (6 months, backed by the FGC) becomes another valuable instrument introduced by monetary authorities (Mesquita Toro, 2010). 22. The swap agreement obtained with the US FED might have also helped at mantaining investors calm, and relaxing the exchange rate market. 17.
(19) reserves also helped to insulate the Brazilian economy from the crisis. But, more importantly, the crisis persuaded Brazilian authorities to a more active response towards the international community, with Guido Mantega, the Ministry of Finance, its principal spokeman. Graph 5: US dollar versus Brazilian Real exchange rate (January 1995 – June 2011). Notwithstanding the progress, matched against international benchmarks, local interest rates continues to be elevated, around 12,25 percent according to latest figures23. On the other hand, when observing latest years figures it also become evident the important transformation at the Balance of Payments´ financial account. Portfolio related operations has become the main source of capital inflows arriving to Brazil (see graph 2), totalizing U$ 67.794,86 in 2010. But FDI inflows are also surpassing previous records, as the bouyant economy continues to attract investors from all over the world 24– including an important mass of Japanesse households25. Capital inflows coupled with high commodity prices, in turn, are pushing the Real to appreciate (Brazil Fears economic fallout as real soars” FT, July 1, 2011) 26 and, henceforward,. 23. The SELIC identifies the basic interest rate. One of the main explanations behind the high level exhibit by this rate relates to the Brazilian public debt, and the fact that an important portion of the debt remains indexed to the SELIC (World Bank, 2006). This fact reduces monetary authorities‟ degrees of freedom, and the effectiveness of the regulatory policies affecting capital movements. 24. According to the 2011 World Investment Report (WIR) elaborated by the United Nations Conference on Trade and Development (UNCTAD), Brazil jumped to the fifth place among the major destinations of Foreign Direct Investment (FDI) (U$ 48,4 billion) from a previous 15th position (U$ 25,9 billion). The US continued to lead the ranking with U$ 228,2 billion received, followed by China (U$ 105,7 billion), Hong Kong (U$ 68,9 billion) and Belgium (U$ 61,7 billion). 25. Between January and April 2011, Brazil receipt about U$ 42,3 billions, more tan 5 times as much as the same period last year. From this total, Japanese investors explained about U$ 4 billions (FT, July 1 st 2011), after reaching U$ 30 billion last year (“Yen influx into Brazil set to grow” FT, June 28, 2011). 26. At July 1st the real traded at 1,5523, its strongest level since just after it was first floated in 1999 (FT, July 1, 2011).. 18.
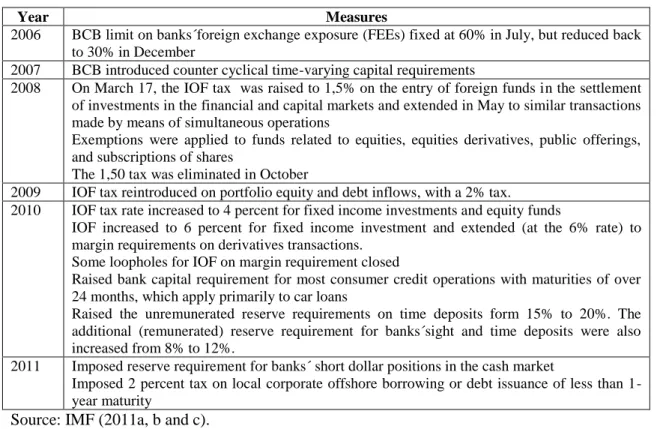
(20) introducing the local economy into a vast political discussion (“Currency wars not over, says Brazil” FT, July 5, 2011) 27 . To summarize, high interest rates matched local currency appreciation trend induced investors´ enthusiasm to carry trade. High real rates have failed to cool the economy but also to bring down inflation as many from developed world continues to flow into the country. Table 2: Brazil, capital flow management related measures (from October 2009 to January 2011) Year 2006 2007 2008. 2009 2010. 2011. Measures BCB limit on banks´foreign exchange exposure (FEEs) fixed at 60% in July, but reduced back to 30% in December BCB introduced counter cyclical time-varying capital requirements On March 17, the IOF tax was raised to 1,5% on the entry of foreign funds in the settlement of investments in the financial and capital markets and extended in May to similar transactions made by means of simultaneous operations Exemptions were applied to funds related to equities, equities derivatives, public offerings, and subscriptions of shares The 1,50 tax was eliminated in October IOF tax reintroduced on portfolio equity and debt inflows, with a 2% tax. IOF tax rate increased to 4 percent for fixed income investments and equity funds IOF increased to 6 percent for fixed income investment and extended (at the 6% rate) to margin requirements on derivatives transactions. Some loopholes for IOF on margin requirement closed Raised bank capital requirement for most consumer credit operations with maturities of over 24 months, which apply primarily to car loans Raised the unremunerated reserve requirements on time deposits form 15% to 20%. The additional (remunerated) reserve requirement for banks´sight and time deposits were also increased from 8% to 12%. Imposed reserve requirement for banks´ short dollar positions in the cash market Imposed 2 percent tax on local corporate offshore borrowing or debt issuance of less than 1year maturity. Source: IMF (2011a, b and c). Henceforth, and despite the battery of macro measures being introduced since 2008 and the actual level of international reserves, the government announced the reintroduction of a 2% year tax on foreign loans (i.e. capital controls) later expanded to 6% (see previous table)28. Likewise, the government began to intervene in the currency swap markets (“Rousseff to tackle sharp rise in the real”, T, Janauary 4, 2011) and taxing bond´s portfolio inflows (Financial Times, July 5, 2011). Theoretically, Brazil shows a low degree of capital openess as playing in the middle field of the triangle. In practice its capital account is decidedly open, and authorities forced to play macro prudential policies. Policies, however, might prove useless when funds massively arrives 27. Since the end of 2008 the real appreciated 39% (Bloomberg, “Mantega Threatens More Capital Controls to Prevent Brazil Currency Wars”). Siemens, German industrial group and Brazil´s biggest electronic conglomerate, has entered into the debate, warning of the danger of deindustrialisation (“Siemens warns on Brazil´s strong real” FT, May 4, 2011) 28. In her inaugural speech on January 1st., Brazilian President Dilma Rousseff stated that Brazil would protect “the country from unfair competition and from the indiscriminate flow of speculative capital”.. 19.
(21) overheating the national economy and introducing alarming symptoms of being traped by the “dutch disease”. Graph 6: Brazil, playing the Trilemma (1984-2009) 1984 1,5. 2009. 1985. 2008. 1986 1. 2007. 1987 0,5. 2006. 1988. 0 -0,5. 2005. 1989 -1 -1,5. 2004. 1990. -2 2003. 1991. 2002. 1992. 2001. 1993. 2000. 1994 1999. 1995 1998. 1996 1997 ers. mi. ka_open. Source: Aizenmman, Chinn and Ito According to Mesquita and Torós (2010), the main lesson to be extracted from the recent experience is that a country characterized by inflation – targeting, prudential monetary policy, conservative banking rules and practices enter into the crisis later and exit sooner, all along with lower price volatility. Hermann (2010), on the other hand, signalls macro stability (i.e.: as balanced fiscal and monetary aggregates) as a necessary but insufficient condition to impulse financial broadening and, henceforth, economic development. The current situation sounds close to the latest, is not time to play at the vertexes. The appreciation trend experienced by the local currency, however, cannot be merely confronted by taxing capital inflows. According to prominent local authors as Jose Luis Oreiro (from the Brazilian Keynessian Association)29 and. 29. “Economista da UnB defende reduçâo da Selic para segurar alta do real” (http://jlcoreiro.wordpress.com/2011/07/29/economista-da-unb-defende-reducao-da-selic-para-seguraralta-do-real-portal-sul-21/).. 20.
(22) Antonio Delfim Netto (emeritus proffesor at FEA-USP and former Ministry of Economy) 30, a more substantial approach might be helpful including a reform into the monetary policy envisioned to curb the interest rate ceilings. In this sense, the India case could become exemplary.. India - Macro After a brief period of FDI promotion upon independence, India established a relatively closed economy with considerable state intervention in industrial policy and multiple controls over private investment. The government implemented a national development strategy characterized as a highly interventionist industrialization model popularly known as the “Licence Raj”, affecting both local and foreign investors. The legal scheme introduced by the Foreign Exchange and Regulation Act (FERA) imposed a 40% ceiling on foreign investors participation in industrial projects, sometimes even preventing TNCs using their own brands in India. Despite these restrictive rules and institutional arrangements, benefits were considerable for those lucky foreign investors that managed to enter - typically market-seeking TNCs (Kumar, 1995). Obviously, capital movements were highly restricted; development was mainly financed from domestically mobilized resources. From a macro perspective, the model become characterised by a pegged exchange rate system and fiscal dominance whereas repression categorised financial markets (Mohan and Kapur, 2009). But, and despite the inner orientation of the economy policy, the country not kept immune from a foreign exchange crisis. India´s economic performance could also be considered unsuccessful under this period, observing a per capita growth rate of 1,7 per cent between 1950 and 1980 (defiantly termed “Hindu rate of growth”). Consequently, the government began to phase out the model in the early 1980s, to place the per capita rate of growth on a 3,8 per cent during the subsequent two decades (Rodrik and Subramanian, 2004). During this decade the government opted for a more flexible exchange rate regime moving, firstly, to a basket of currencies and later to [a theoretical] market-determined floating exchange rate scheme since March 1993 although, in practice highly administrated (or “de facto” pegged)31 system as the Reserve Bank of India (RBI) actively participated at the market to avoid. 30. “O Trilema” at Valor Económico, 05/04/2011. Available at https://conteudoclippingmp.planejamento.gov.br/cadastros/noticias/2011/4/5/o-trilema 31. In practice the rupee has been pegged to the U$ in the period 1993-2008 (Patnaik, 2010).. 21.
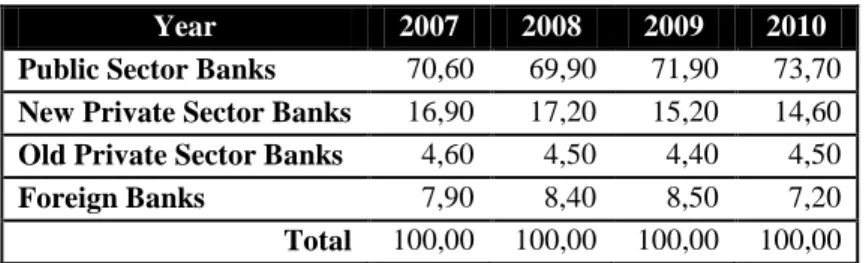
(23) extreme volatility and influencing rupee parity32 . India exchange rate policy, on the whole, become guided “by the need to reduce excess volatility, prevent the emergence of destabilising speculative attacks, help maintain an adequate level of reserves, and develop and orderly foreign exchange market” (Mohan and Kapur, 2009). Extensive management practices, on the other hand, were possible thanks to the presence of voluminous capital controls and the limited integration to international financial markets reported by India (Khurana, 2007). Graph 7: US dollar versus Indian rupee exchange rate (January 1995 – June 2011). The government also began to reshape its industrial policy, by introducing a price liberalization scheme, an important reduction in tariffs and the partially progressive dismantling of the Licence Raj system. India gradually opened up its markets through economic reforms reducing former controls on foreign trade and investment (including portfolio) (Panagariya, 2004; Ahluwalia, 2002), although maintaining restrictions over debt flows (Shah and Patnaik, 2004, Mohan and Kapur, 2009). Important liberalization measures were also adopted at India´s stock market, benefiting the arrival of foreign institutional investors (FIIs), including pension funds33. Nevertheless, and as previously commented, the Asian crisis interrupted the route towards rupee fully convertibility along other liberalization measures suggested by the committee chaired by S. S. Tarapore. Advances were ultimately following a step-by-step strategy (Chandrasekhar,. 32. Several authors have tested the “dirty-floating” scheme introduced by the government, most of whose results indicate that the Rupee continued to be pegged to the U$ dollar. 33. Permission to enter was granted on both, primary and secondary market for securities. Ceilings on shares of domestic companies that can be held by foreigners were maintained, however, been initially settled at 5% for a particular entity and 24% for all FIIs participating in the market (later expanded to 30%).. 22.
(24) 2008)34. As for example, whereas FIIs were just allowed to invest in government bonds in April 1998, by January 2003 all previous limitations were removed. Likewise FIIs share (at local firms) enlarged up to 49% at 2001 from a previous ceiling of 30%. Institutional investors would become powerful in the new millennium. Between 2004 and 2007, IFIs related inflows totalized U$ 45,07 billions, but the ascending trend would become reversed during the financial crisis (Arora, et. al., 2010). During the first semester of the 2008-year foreign investors pulled $ 57 billions out of the market, a movement basically originated at foreign Banks and financial entities. Funds returned after April 2009 as observed in the next graph. Graph 8: Net Investment by FIIs in the Indian Capital Market (April 2006 – June 2010) 25.000,00₨. 20.000,00₨. 15.000,00₨. 10.000,00₨. 5.000,00₨. b07 ab r- 0 7 ju n07 ag o07 oc t-0 7 di c07 fe b08 ab r- 0 8 ju n08 ag o08 oc t-0 8 di c08 fe b09 ab r- 0 9 ju n09 ag o09 oc t-0 9 di c09 fe b10 ab r- 1 0 ju n10. fe. 6. 06. di c-. 06. t-0. oc. ag o-. 6. ju n-. Ap ril 20 0. 06. 0,00₨. -5.000,00₨. -10.000,00₨. -15.000,00₨. -20.000,00₨. Source: RBI. Historically, India´s stock markets were tiny and listed companies were actively traded (Chandrasekhar, 2008), all of which generated a high degree of volatility. As a consequence of all of this, India´s financial sector is primarily bank based. Market importance began to rise in recent years, however, as denoted by the rocketing increase experienced by SENSEX, the daily 34. Among others measures, the new economic team become more permissive with remittances or maintaining portfolios abroad. All inflows by non-residents are freely repatriable, whereas some restrictions are maintained on resident non-financial companies. Indian citizens could also invest abroad, although important restrictions are still binding for borrowing abroad (Mohan and Kapur, 2009). A complete list of liberalization measures benefiting capital account convertibility is listed at Chandrasekhar (2008).. 23.
(25) stock price index of Bombay Stock Exchange35. Certainly, FIIs has played an important role in this surge. A set of actions launched by the government also helped36, including the launching of several IPOs by state-owned firms37. As for domestic companies, they are entitled to issue American Deposit Receipts (ADRs) and Global Depository Receipts (GDRs). In the case domestic mutual funds, the government authorized them to invest in foreign securities, whereas some qualified mutual funds are permitted to invest cumulative up to U$ 1 billion in overseas exchange traded funds (Reddy, 2009). But, in contrast to what happened in other emerging markets, India´s experience with ADRs and GDRs become short-lived, particularly thanks to the sophistication of the domestic stock market (Shah and Patnaik, 2010). On the other hand, restrictions were maintained for foreigners at the market for government securities (Shah and Patnaik, 2004), a decision basically adopted to maintain autonomy over its decision – making process (Chandrasekhar, 2008; Economist, 2009). Analogously, the RBI conserved several constraints on foreign currency borrowing by firms, by fixing both the maturity and the interest rate of the loan, and banning short-term borrowing (Economist, 2009; Patnaik, 2010).. 35. At July 25, 1990, SENSEX Index was fixed at 1.000 points, reaching 6.000 points ten years later and 17.000 points by September 2007. 36. As for example, in his Budget speech at the Congress the government compromised to “abolished the tax on long-term capital gains from securities transactions altogether”, a fiscal concession that [might] triggered the speculative surge in stock markets. 37. At mid-October, 2010 the state-owned Coal India launched an IPO expecting to rise up to $ 3 billion. Previously, Power Grid Corporation and Steel Authority of India have adopted a similar path (“Rupee off highs as capital controls talks weigh” The Economics Time, 11 October, 2010).. 24.
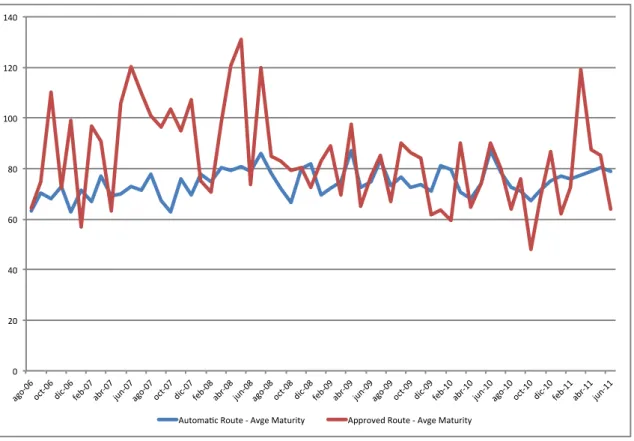
(26) Graph 9: India, foreign investments inflows (1991-92 to 2009-2010) (Million of U$ dollars) $40.000,00. $30.000,00. $20.000,00. $10.000,00. 809. 708. 607. 506. 910 20 0. 20 0. 20 0. 20 0. 20 0. 405 20 0. 304 20 0. 203 20 0. 001. 102 20 0. 899. 798. 697. 596. 495. 394. 293. 900. 20 0. 19 9. 19 9. 19 9. 19 9. 19 9. 19 9. 19 9. 19 9. 19 9. 192. $0,00. -$10.000,00. -$20.000,00 A. Direct investment. B. Por olio investment. Source: Figures from RBI database Notes: Portfolio investments include GDRs/ADRs, FIIs and Offshore funds and others.. As observed in the previous figure portfolio investments are adding in importance, although not all inflows qualify as non-stable funds. Debt flows, on the other hand, are subject to prudential controls through a system of overall ceilings on the amount that can be borrowed, maturity prescriptions and ceilings on interest rate spreads (Mohan and Kapur, 2009). However, in order to support productive investments, the government allowed for some exceptions in external commercial borrowing (ECBs). ECB are commercial loans raised by Indian borrowers from non-resident lenders with a minimum average maturity of three years (36 months) (see RBI Guidelines at http://www.welcome-nri.com/info/project/ECB_Guidelines.htm) 38. Graph 10: India, ECBs average maturity (in months) (August 2006 – June 2011). 38. Eligible borrowers under the scheme are all corporate entities (except financial intermediaries), units in special economic zones and non-governmental organizations (NGOs) engaged in micro-financed activities. ECB guidelines explicitly address those ventures that could be founded by external funds, including investments in the real sector. Funds can only be raised among a limited number of lenders, including international banks, international capital markets, multilateral financial institutions, export – credit agencies, suppliers of equipment, foreign collaborators and foreign equity holders. Finally, it might also be remarked that ECBs costs are limited by a ceiling (Libor plus 300 bps for a 3 to 5 years maturity loan).. 25.
(27) A buoyant economy induced ECBs related inflows to increase since mid - 2002 (Mohan and Kapur, 2009; Arora et. al., 2010). Inflows increased from a quarterly average of U$ 1,2 billion during June 2002 – September 2004 to U$ 4,1 billion during September 2005 – December 2006. During 2007 ECB related inflows were at their maximum, totalizing U$ 33, 31 billions, to decrease thereafter (more data at the appendix) (ECBs data available at RBI webpage http://www.rbi.org.in/scripts/statistics.aspx). As capital inflows continued to jump into the country, and the economy to show some overheating signs, the government tightened the regime, particularly aiming to discourage real estate loans. These measures were somewhat relaxed following the collapse of Lehman Brothers, but resumed once capital inflows made their reappearance. Thereafter, the RBI modified the ECB guidelines several times, either liberalizing or restricting the scheme. Anyway, ECB access continues (partially) subject to prior approval, external funds are mostly used to finance the import of capital goods, observing a balancing maturity profile (Mohan and Kapur, 2009). Foreign currency convertible bonds (FCCBs) become a funding alternative for Indian firms certainly less demanded than ECBs, observing a dwindling trend since 2007-08. Table 3: India, ECBs and FCCBs registered with the Reserve Bank (in U$ millions) Instrument ECBs FCCBs Total. 2007-08 22,224 6,103 28,327. 2008-09 15,462 463 15,925 26. 2009-10 17,363 3,362 20,725. 2010-2011 24,481 1,270 25,751.
(28) Source: RBI (2011, b) India‟s economic performance in the post-reform period shows many positive features. The average growth rate that put India among the fastest growing developing countries at that time. As the economy keep on growing, helped the domestic demand to flourish, whereas the country maintained high rates of gross capital formation. Simultaneously, the government advanced at the fiscal front, reducing their financing needs. Inflation rates were significantly reduced, but still higher than in most advanced and (some) emerging economies. Remittances from abroad keep entering, increasing the availability of external funds for the public and private sectors. Meanwhile, the services sector continued their expansion, becoming an important source of foreign exchange – the merchandise trade continued experiencing recurrent deficits, however. India also transformed into one of the FDI top destinations, ranking just besides China and the US, and certainly a leading country among MNCs (UNCTAD, 2005)39. Graph 11: India, Foreign exchange reserves (U$ billions) 2009-10 2008-09 2007-08 2006-07 2005-06 2004-05 2003-04 2002-03 2001-02 2000-01 1999-00 1998-99 1997-98 1996-97 1995-96 1994-95 1993-94 1992-93 1991-92 $-. $50,00. $100,00. $150,00. $200,00. $250,00. $300,00. $350,00. The RBI began to build-up an important amount of foreign reserves short after the liberalization process began (RBI, 2010b), surpassing the U$ 300 billions barrier during 2007-2008 period and totalizing at September 30, 2010, U$ 292,9 billions. The accumulation process, in turn, 39. With a total of U$ 98 billion, India resulted the largest recipient of net capital flows among BRICs countries in 2007, ahead of Russia (U$ 96 billion), Brazil (U$ 88 billion) and China (U$ 70 billion).. 27.
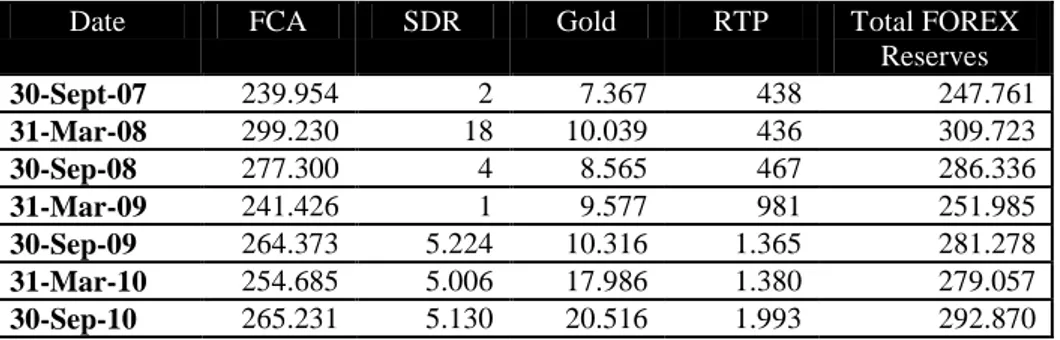
(29) becomes explained by the massive entry of foreign capitals, mainly FDI but also by FIIs intermediate resources, as explained. The excess of FX assets obviously forces the RBI to expand the system liquidity; at least on a partial basis with the remaining maintained as government securities to be sell at the market. Henceforth, and since April 2004, India launched the Market Stabilization Scheme (MSS), which allows the government to issue Government Treasury bills or bonds to offset the expansionary impact of capital inflows 40 . The scheme operates on a symmetrical basis, injecting capital during a reversal in capital flows and purchasing foreign currencies to prevent excess liquidity in the national economy. In order to neutralise the expansionary impact of foreign exchange purchases on the domestic monetary and liquidity conditions, authorities were not constrained to one instrument (Mohan and Kapur, 2009). The RBI is also entitled to alter bank´s cash reserve requirements (CRRs), to launch open market (repo / reverse) operations via the Liquidity Adjustment Facility (LAF)41 scheme or to introduce a liquidity adjustment facility. As in the case of MSS, all these instruments are prepared to work on symmetrical basis42. Table 4: India, movements in Foreign Exchange Reserves (U$ millions) Date 30-Sept-07 31-Mar-08 30-Sep-08 31-Mar-09 30-Sep-09 31-Mar-10 30-Sep-10. FCA 239.954 299.230 277.300 241.426 264.373 254.685 265.231. SDR 2 18 4 1 5.224 5.006 5.130. Gold. RTP. 7.367 10.039 8.565 9.577 10.316 17.986 20.516. 438 436 467 981 1.365 1.380 1.993. Total FOREX Reserves 247.761 309.723 286.336 251.985 281.278 279.057 292.870. Notes: 1) FCA as for Foreign Currency Assets, maintained as a multi-currency portfolio comprising major currencies, and valued in terms of US dollars, 2) SDR as for Special Drawing Rights, 3) Gold includes U$ 6,699 million reflecting the purchase of 200 metric tonnes of gold from IMF in October 2009, totalizing a physical stock of gold of 557,75 tonnes, 4) RTP as for Reserve Tranche Position in the IMF Source: RBI (2010b) 40. Legally, the government is prevented to finance its expenditures through the sale of these securities (Chandrasekhar, 2008). Government Treasury bills or bonds, on the other hand, are specific limited (Mohan and Kapur, 2009). 41. In contrast to other instruments being mentioned, like CRR or MSS, LAF is basically aimed to manage transitory liquidity shortfalls / surpluses in the money market. 42. As capital inflows were massively entering into the country, the RB raised the CRR from 4,5 per cent (March 2004) to 9.0 per cent (July 2008), although most of the increase was launched by the end of 2007. As flows suddenly reversed, authorities rolled back the requirement to previous levels. From August 2008 to January 2009, CRR was reduced by 400 basis points, whereas REPO rate decreased by 425 points (from 9 % in August 2008 to 4,75 in May 2009) and Reverse REPO rate by 275 basis points (from 6 % in November 2008 to 3,25% in April 2009) (Arora et.al., 2010).. 28.
(30) When the sub-prime crisis exploded, macroeconomic fundamentals proved resilient. The government announced several stimulus packages in order to maintain the level of economic activity unperturbed. Fiscal measures included a reduction in indirect taxes and sector specific measures, increasing government´s expenditure by 36% in the third quarter of 2008-09 (Arora et. al., 2010). The package augmented the government fiscal deficit, however. Monetary response was also rapid and ample, including a series of conventional and exceptional instruments to lead liquidity into the economy, including: open market operations, CRR reduction, MSS unwinding / buyback, term REPO facilities (14 days), increase in Export credit refinance, special refinance and liquidity facilities for banks (more details at Arora et.al., 2010, page 817). Finally, and in order to reverse the adverse trend in capital inflows, the government has also unwind former regulations. The crisis, however, affected the Indian economy and trade imbalances grew significantly, particularly the trade account as imports remained high pulled by a firmly domestic demand. The stock market was also severely hit as the foreign investors lost confidence in the local economy 43 (Chandrasekhar, 2008; Arora et.al., 2010). Consequently, the Indian rupee depreciated against the US dollar, although the RBI contained the falling throughout open market operations and selling dollars to the market (diminishing FX reserves) (FOREX data on RBI webpage). But sooner than later, foreign investors were back in India, resuming the former pressures on rupee appreciation and macroeconomic overheating. When the Lehman Brother crisis started, challenged authorities at the Reserve opted to preserve the economy from contagion and maintained its key policy rate at 4,75% despite important inflationary pressures (Economist, 2009). Once capital inflows resumed, RBI decided for a tight monetary policy, increasing their referential rate – actually set at 6, 5% (see next graph). Monetary authorities also announced a series of measures in order to discourage housing loans – including an increase in the Loan to value ratio (RBI, 2011b) RBI authorities also revised commercial banks´ CRR figures along modifying their reserve requirements (RBI, 2010). Graph 12: India, interest rate (January 2002 – July 2011). 43. IIFs retracting caused a 23,43% drop at the Bombay Stock Exchange (BSE), in just 26 trading days beginning at January 8, 2008. But local factors have also influenced investor´s pessimism. Afterwards, the Satyam episode, concerning irregular practices among Indian companies, started another phase of capital outflows, and generating a 16,1% loss in just 13 trading days starting at January 6, 2009.. 29.
(31) The monetary policy also included important sterilization measures in order to reduce pressure on the rupee, particularly by the launching of open market sales of government securities from its portfolio and reintroducing the MSS. In addition, authorities used the liquidity adjustment facility (LAF) scheme to extract liquidity from the local financial system. Alternatively the government could either introduce more controls or stimulate capital outflows, either by encouraging local firms to go global or inducing local private agents to invest abroad. As portfolio flows continued to flood the country 44 , authorities began to consider the reintroduction of more stringent capital controls (Chandrasekhar, 2009). Graph 13: India, playing the Trilemma (1984-2009). 44. Between April and December 2009 inflows nearly equalled the total from 2000 to 2005, strengthen the local currency and destabilizing the Indian macro (“India considers capital controls” gulfnews.com, May 3, 2010).. 30.
(32) 1984 1. 2009. 1985. 2008. 1986 0,5. 2007. 1987. 0. 2006. 1988. -0,5. 2005. 1989. -1 2004. 1990 -1,5. 2003. 1991. 2002. 1992. 2001. 1993. 2000. 1994 1999. 1995 1998. 1996 1997 ers. mi. ka_open. Source: Aizenmman, Chinn and Ito On the whole, and despite the liberalization trend launched at the beginning of the 1990s, India has always maintained important controls on their capital account during the whole process. The prudential attitude adopted towards banks access to external commercial borrowing has also helped (Mohan and Kugar, 2009).. China - Macro The Popular Republic of China (PRC) initiated a large walking towards a more balanced and successful model that entailed breaking with some traditional communist practices, including a closer association with the international economy in the form of international trade and foreign investment beginning as of 1978 (Mortimore and Stanley, 2010). Two decades of exceptionally high growth in the order of 10% a year transformed the economy, converted the PRC into the world‟s principal exporter, pulled more than 500 million Chinese out of poverty and consolidated a huge domestic market (World Bank, Database). The PRC adopted an open policy towards FDI, but a gradualist approach, transforming the country in one of the principal developing country recipients of FDI (UNCTAD, 2008b) 45. FDI, in turn, become massively 45. By 2005, the PRC was receiving annual FDI inflows of US$ 70 billions. It might be important to notice that the bulk of the FDI originated in Asia, particularly from Hong Kong, Japan, Korea, Taiwan and Singapore.. 31.
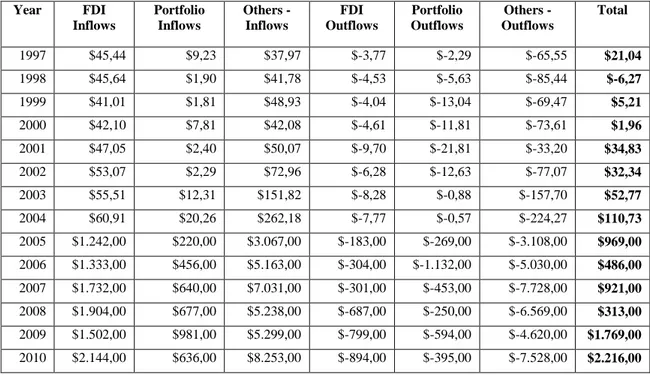
(33) involved in transforming China in the world leading export platform46. Both, FDI attraction and export promotion become the drivers of China´s exceptional growth, a path characterized by the simultaneous presence of commercial and capital account surplus. Table 5: China financial account (1997-2010) (U$ dollars, 100 MM) Year. FDI Inflows. Portfolio Inflows. Others Inflows. FDI Outflows. Portfolio Outflows. Others Outflows. Total. 1997. $45,44. $9,23. $37,97. $-3,77. $-2,29. $-65,55. $21,04. 1998. $45,64. $1,90. $41,78. $-4,53. $-5,63. $-85,44. $-6,27. 1999. $41,01. $1,81. $48,93. $-4,04. $-13,04. $-69,47. $5,21. 2000. $42,10. $7,81. $42,08. $-4,61. $-11,81. $-73,61. $1,96. 2001. $47,05. $2,40. $50,07. $-9,70. $-21,81. $-33,20. $34,83. 2002. $53,07. $2,29. $72,96. $-6,28. $-12,63. $-77,07. $32,34. 2003. $55,51. $12,31. $151,82. $-8,28. $-0,88. $-157,70. $52,77. 2004. $60,91. $20,26. $262,18. $-7,77. $-0,57. $-224,27. $110,73. 2005. $1.242,00. $220,00. $3.067,00. $-183,00. $-269,00. $-3.108,00. $969,00. 2006. $1.333,00. $456,00. $5.163,00. $-304,00. $-1.132,00. $-5.030,00. $486,00. 2007. $1.732,00. $640,00. $7.031,00. $-301,00. $-453,00. $-7.728,00. $921,00. 2008. $1.904,00. $677,00. $5.238,00. $-687,00. $-250,00. $-6.569,00. $313,00. 2009. $1.502,00. $981,00. $5.299,00. $-799,00. $-594,00. $-4.620,00. $1.769,00. 2010. $2.144,00. $636,00. $8.253,00. $-894,00. $-395,00. $-7.528,00. $2.216,00. Source: Data from the State Administration of Foreign Exchange - SAFE webpage But, although the government highly incentivised the FDI arrival some capital inflows were certainly less, and portfolio and foreign debt flows were definitely unimportant 47 . China´s capital account followed a “selective opening” strategy (Prasad and Wei, 2004; Glick and Hutchinson, 2008; Yu, 2010). Inflation remained at low levels for most of the transitional phase, mainly thanks to the flexible monetary policy implemented by the Popular Bank of China (PBC). During this phase the government always retained critical limitations on the national. 46. China‟s cautious FDI policy originally focused on restricting FDI to the cheap labour export assembly activities in the Special Economic Zones, for the most part reserving the domestic market to domestic companies or limited to joint ventures of foreign companies with local partners. For foreign investors, activities in the PRC were defined as prohibited, restricted, permitted and encouraged. MNCs companies were originally prevented to commercialize its production in the countryside. In terms of country of origin, most funds were coming from the region, particularly, from Hong Kong. On the other hand, FDI was subject to approval, and later registered with both the planning and foreign trade department of the government. After entry into the WTO in 2001, China‟s FDI rules became more liberal in the sense that they encouraged more activities and fewer restricted activities were maintained and eventually 75% of all foreign companies were wholly-owned foreign companies. 47. The policy might be enunciated as “welcome to FDI, but no thank to foreign debt and portfolio flows” (Prasad and Wei, 2004 pp 453).. 32.
(34) currency convertibility, along high restrictions on their purchase by domestic importers48. Fiscal policy has complemented monetary policy, in particular, in allowing the government to maintain policymaking autonomy and limit external vulnerabilities 49 . On the whole, and considering the last 30 years, China maintained an annual average growth rate of nearly 10% to become the second biggest economy of the world after the US50. Certainly, “China´s gradual approach to financial liberalization and capital account openness [could be understood as] a key element contributing to its rapid and highly stable growth” (Yu, 2009)51. Graph 14: US dollar versus Chinese Yuan exchange rate (January 1995 – July 2011). Until 1994 China maintained a differentiated exchange rate regime, an expanded strategy adopted by several developing countries, in order to protect local production from foreign competition. Thereafter, a managed floating exchange rate regime replaced a centralized and fixed one, although the new one could be better described as a de facto fixed. As for example, consider the 1994-1998 period where the exchange rate appreciated from 8.7 Yuan per dollar to 8.3, as observed by Robert E. Rubin (US Treasury secretary at the time of the Asian crisis), a truly “island of stability” in a turbulent world. Starting in 2005 monetary authorities allowed the Yuan to revaluate, and the exchange rate become determined by a basket of currencies 48. To qualify for FX, domestic buyers had first to be eligible to import. For licensed imports, enterprises had to obtain the license in the first place, whereas for non-licensed imports, SAFE approval was based on a “priority list”. 49. The government has also limited its external debt to low levels, although shortening its maturity in recent years because the increasing importance of trade credits. Enterprises were particularly discouraged from taking external debt (Prasad and Wei, 2004). 50. The latest figure reveals a nominal GDP of $U 1.337 trillion (“China: Second in line”, Economist, August 16th, 2010) 51. An important point made by Yu (2010) is the coincidence between the launching of the reform at China and the Latin America debt crisis, which prevented the giant Asia on the importance of sequencing.. 33.
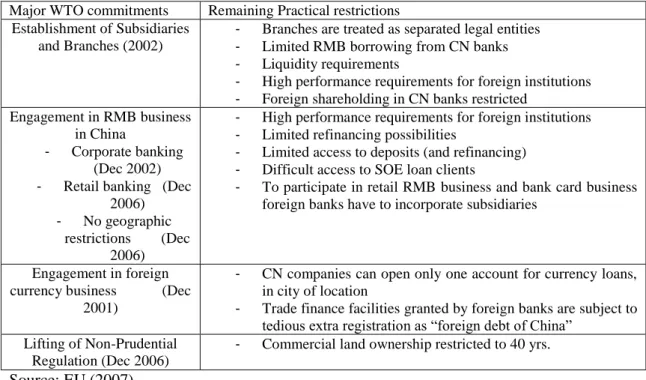
(35) thereafter but the dollar maintained its relevance. Floating range becomes narrowed since 2008 as the global financial crisis emerged. Two years later, at June 21 2010 China ended de facto peg to the dollar and the renminbi began to appreciate (FT, August 11, 2010) 52. To limit local currency appreciation, authorities intervened in the foreign exchange market, accumulating massive amounts of foreign reserve. Henceforth, with a stable exchange rate, increasing trade surplus and large FDI inflows international reserves grew steadily. As the model persisted and growth rates sustained their trend, China continue to amass reserves, passing from U$ 186,3 billions in 2000 to U$ 3,04 trillion at March 2011 reflecting an strong capital account surplus (FDI inflows) along a formidable surplus in their current account (export boom). Graph 15: China´s foreign exchange reserves minus gold (Billion of U$ dollars) $3.500,00. $3.044,70 $3.000,00. $2.847,30. $2.500,00. $2.399,20. $1.946,00. $2.000,00. $1.582,20 $1.500,00. $1.066,30 $1.000,00. $818,90 $609,90 $403,30. $500,00 $165,60. $212,20. $286,40. $0,00 2000. 2001. 2002. 2003. 2004. 2005. 2006. 2007. 2008. 2009. 2010. 2011 March. The Asian crisis convinced Chinese authorities the relevance of maintaining restrictions on capital flows but, fundamentally, on the importance of an accurate sequencing policy. Thereafter the government began to relax constraints on capital flows. Initially, due the financial commitments made by China towards its enter at the World Trade Organization (WTO) in 2002. FDI flows become fully liberalized thereafter, including the abolishment of former 52. Since July 2005 to June 2010 RMB appreciated 21,88% against the US dollar and 21,07% against the Euro (PBC, 2010).. 34.
Figure
+7
Documento similar