Intraseasonal variability of rainfall over Northern South America and Caribbean region (Report)
14
0
0
Texto completo
(2) Intraseasonal variability of rainfall over northern south America and caribbean region. lowlands of Orinoco and Amazon basin these signals are not clearly expressed. Exploring the relationship between regional ISV and Madden-Julian Oscillation of correlation analysis was made. Due to the presence of signals different of 30-60 days, the correlation coefficients were very low. Considering this situation, high frequency smoothing was applied to DPI time series; after that, a relative correlation was detected between smoothed DPI and Madden-Julian Index (MJI).. KEYWORDS Intraseasonal Variability, Madden-Julian Oscillation, Rainfall.. RESUMEN Con base en registros de precipitación media de cada diez días (DPI), tomados de estaciones de la región Norte de Sur América y del Caribe, se calculó la variabilidad de la precipitación inter-estacional (ISV) de la región. El análisis espectral del DPI permitió identificar periodos entre 20-25, 30, 40 y 50-60 días. De acuerdo con el análisis de esas distribuciones espaciales, éstas se encuentran bien definidas en las islas de el Caribe y la región Caribe y en algunos lugares de los Andes; las series de 60 días se presentan solamente en la región Caribe y en algunos lugares del Pacífico: en las cuencas de la Orinoquía y el Amazonas las señales de estas distribuciones no se encuentran claramente definidas. Se realizó un análisis de correlación entre el ISV regional y la oscilación Madden-Julián. El coeficiente de correlación encontrado fue muy bajo debido a la presencia de señales entre 30-60 días. Considerando esta situación se utilizó una frecuencia más leve con las series DPI, encontrando una correlación relativa entre periodos depurados de DPI y el indicador Madden-Julián (MJI). PALABRAS CLAVE. Variabilidad Interestacional, Oscilación Madden-Julián, Precipitación. Ingeniería de Recursos Naturales y del Ambiente, - No. 7. 1. INTRODUCTION. Extreme phases of climate variability bring to different regions warm or cold periods, rainy (more precipitation than normal or more frequent heavy rainfall events) or dry conditions, and so. This variability impacts in several ways ecosystems and economic systems of the countries around the world, producing in some cases disasters. In the climate system many processes generate this variability. For example, the tropical Pacific phenomena El Niño (warm condition) and La Niña (cold conditions) are the cause of 2-7 years time scale oscillations of climatic variables known as ENSO cycle (Philander, 1990; Hastenrath, 1996; see also ENSO bibliography in COAPS, 2006). In addition to the ENSO cycle, signals such as quasi-biennial component (Ropelewski et al., 1992; Meehl, 1997; Baldwin et al., 2001), and fluctuations in the period interval of 20-90 days called intraseasonal oscillations (Knutson & Weickman, 1987; Bantzer & Wallace, 1996; Nogués-Paegle et al., 2000; Krishnamurti & Shukla, 2000; Goswami & Mohan, 2001; Bond & Vecchi, 2003; Krishnamurti & Shukla, 2007) have been identified. Today the most studied signal of climate variability is that caused by ENSO. There are many works related to the effects of ENSO in monthly precipitation of different regions in the world (Ropelewski et al., 1986; Ropelewski & Halpert, 1987; Pabón & Montealegre, 1992; Peel et al., 2002; Poveda, 2004; and many others). Currently, seasonal climate prediction schemes are based on the knowledge about particularities of ENSO cycle in a given region, however, because they do not include other modes of climate variability, prediction fails frequently, especially in month-to-month range and less (see for example Hendon et al., 2000; Jones & Schemm, 2000; Jones et al., 2004c). A source of fails in prediction in month-to-month range is associated to the no inclusion of intraseasonal variations in the schemes. In fact, the phases of intraseasonal fluctuations activate and deactivate rainfall for periods of a couple of weeks lasting or forwarding the beginning or end of rainy season, or breaking it. The rainy phase of intraseasonal variability also activates heavy precipitation events and related to them disasters (flashfloods, landslides, etc). Due to practical value to improve subseasonal predictability (Waliser et al. 2003; Webster & Hoyos, 2004), the interest on intraseasonal modes of climate variability has been increasing in last decade and many efforts have. Facultad de Ingeniería «EIDENAR». 27.
(3) Figure A. Estaciones Colombianas. 28. Facultad de Ingeniería «EIDENAR». Ingeniería de Recursos Naturales y del Ambiente, - No. 7.
(4) Intraseasonal variability of rainfall over northern south America and caribbean region. been doing to study this variability especially the associated to Madden-Julian Oscillation (Madden & Julian, 1994), the dominant mode in intraseasonal climate variability. Several authors have been studied the intraseasonal variability (hereafter ISV) in precipitation for different geographical regions of the world. Krishnamurti & Shukla, (2000, 2007), for example, found modes with 45 and 20 days period in precipitation in India. Wang et al. (1996) explored ISV of precipitation in China finding 12, 21 and 43days period. Analysis was made also for Africa (Janicot & Sultan, 2001; ; Mathews, 2004) and signals over 10-25 and 25-60 days period were found in convection and precipitation in the western region (Sultan et al., 2003; Mounier & Janicot, 2004); satatistically significant spectral peaks over 15 and 40 days period were found for Sahel precipitation (Janicot & Sultan 2001). Jones et al. (2004a) using outgoing long wave radiation data developed a climatology for tropical intraseasonal convective anomalies. Also, Ye & Cho (2001), analyzed precipitation data for United States, and found 24 and 37 days signals. ISV of convection and precipitation for different regions of South America has been studied by Garreaud (2000), Petersen et al. (2002), Misra (2005). Exploring the causes of ISV of precipitation many researchers have been paying special attention to its relationship to Madden-Julian Oscillation (MJO), because the MJO is the dominant mode of tropical ISV. Thus, Bantzer & Wallace (1996) analyzed temperature and precipitation data using satellite data and found a 40-50 days component, close to MJO period. Liebman et al. (1994) investigated the relationship between tropical cyclones of the Indian and western Pacific oceans and the MJO and found that cyclones preferentially occur during the convective phase of the oscillation; but they noted, however, that the increase in cyclone activity during active periods of convection is not restricted to MJO activity and concluded that the last does not influence tropical cyclones in a unique fashion (this situation may be due to the existence of other modes of ISV). A similar analysis was done by Maloney & Hartman (2000a,b) for hurricanes of eastern north Pacific and Gulf of Mexico (information on Caribbean is also included). Kayano & Kousky (1999) studied the MJO in the global tropics using pentad-means for the 1979–1995 period computed for 200- and 850-hPa zonal winds, 200-hPa velocity potential, 500-hPa geopotential height and pressure vertical velocity, 925-hPa temperature and specific humidity, SLP and total precipitable water (PW);. Ingeniería de Recursos Naturales y del Ambiente, - No. 7. they found in all variables an eastward traveling largescale oscillatory regime with a period of approximately 45 days. In the other hand, Jones et al. (2004b) using pentadal precipitation data based on Global Precipitation Climatology Project (GPCP) confirmed that over Indian Ocean, Indonesia, Western Pacific, Eastern South America, Western North America, northeast Africa, the Middle East, and Eastern China, extremes precipitation events increases with the presence of active (convective) phase of MJO. Barlow et al. (2005) analyzing daily precipitation for Southwest Asia found that this variable is modulated by MJO activity in the eastern Indian Ocean, with strength comparable to the interannual variability. Bond & Vechi (2003) found a relationship between MJO and precipitation of Oregon and Washington states. ISV was detected in convective processes over Amazon region by Petersen et al. (2002). The climate variability for northern South America and Caribbean region has been studied mainly in interannual scale (Hastenrath, 1976; Pabón & Montealegre, 1992; Enfield, 1996; Alfaro et al., 1998; Enfield & Alfaro, 1999; Montealegre & Pabon, 2000; Giannini et al., 2000; Chang & Stephenson, 2000; Chang & Taylor, 2002; Taylor et al., 2002; Poveda, 2004, Nobre et al., 2006), especially the associated to ENSO, with purpose to improve seasonalinterannual climate prediction. The ISV of precipitation have been less studied, however some attempts have been carried out by Poveda et al. (2002), who analyzed the daily cycle of precipitation of Colombian Andes and found a significant relationship between MJO and daily precipitation, such as between MJO and amplitude of daily cycle. Pabón (2007), explored ISV using decadal (ten days amounts) precipitation data for different regions of Colombia and found 20-25 and 50-70 days periodical components; searching the relationship of the analyzed times series with MJO it was found a low correspondence because the presence of other mode of ISV different to MJO mode. These works show the evidences of ISV modes in climate of the region. Taking in account the state of knowledge about the ISV and the regional importance for improving climate prediction and to strength the disaster prevention systems, especially in the component related to heavy rainfall, this paper try to analyze in more detail the characteristics of ISV of precipitation in northern South America and Caribbean region.. Facultad de Ingeniería «EIDENAR». 29.
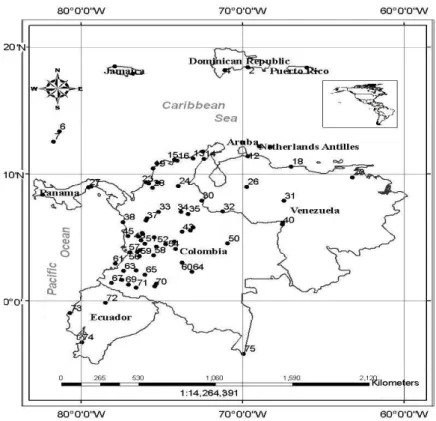
(5) Figure 1. Northern South America and Caribbean region and distribution of meteorological stations used for analysis Table 1. The number corresponds to station listed in .. 30. Facultad de Ingeniería «EIDENAR». Ingeniería de Recursos Naturales y del Ambiente, - No. 7.
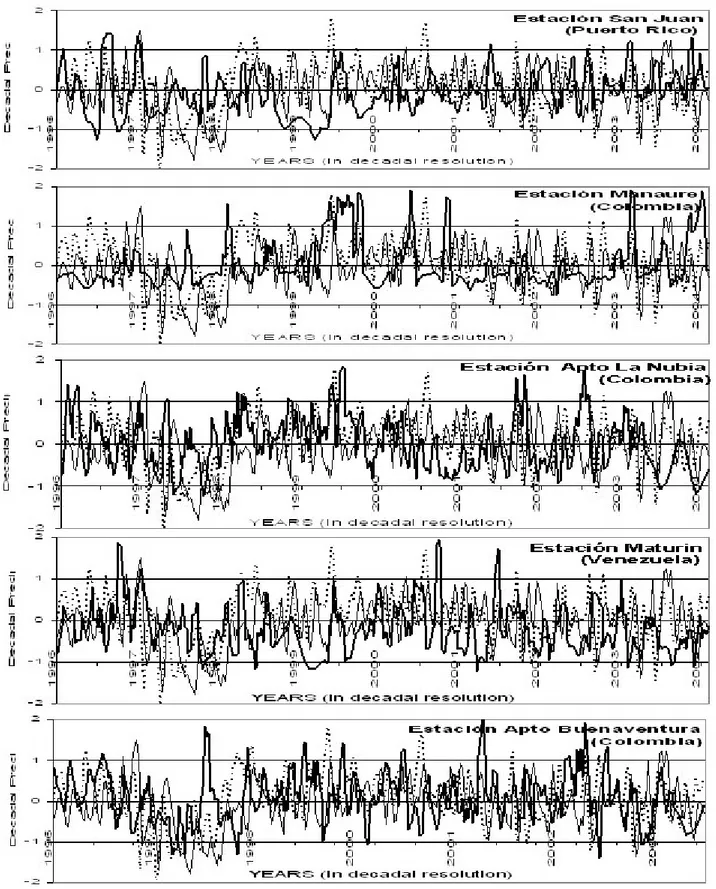
(6) Intraseasonal variability of rainfall over northern south America and caribbean region. 2. DATA AND METHODOLOGY. 3. ANALYSIS AND DISCUSSION. For the analysis in the current study as basic data was used daily precipitation for the 1978-2004 period from meteorological stations distributed over northern South America and Caribbean region as showed in Figure 1 (the 75 are listed in Table 1). Selection of the meteorological stations was done considering criteria as representativeness of a given region, length of record period at least 20 years and minimal gaps in data series. Considering the complex topography over Colombian territory that generates a rich climate diversity, it was necessary to include a relatively high density of the network for this region. An initial check was carried out in order to test the quality of data. After this quality control a decadal (amounts for each ten days period) precipitation series were organized and an index (DPI) was calculated using the equation:. Figure 2 shows the 3-points (30 days) moving averages of DPI for five stations (one for each delimited sector) in the region; this presentation visualizes the intraseasonal fluctuations of DPI. The MJI for 120 and 40°W is also presented to compare with DPI series.. (1). (or simply, the z-score of decadal precipitation) where: P – decadal precipitation; multianual precipitation average for respective decade; standard deviation for the series of a given decade (time sequences of first decades, or second decades of the year and so on). To facilitate the presentation of analysis and results the report was organized for five sectors of the region: islands in Caribbean Sea region, continental plain lowland of the To identify signals of ISV of precipitation spectral analysis (Wilks, 1995) was applied to time series of DPI using commercial software that calculates the spectral density. Considering that Madden-Julian Oscillation induces the most outstanding signal of ISV in the tropics, an attempt to associate the regional ISV of precipitation with MJO was done; therefore the Madden-Julian Index (MJI) for 120 and 40°W was compared with DPI series. For that, DPI was smoothed using moving averages to filtrate high frequency modes. MJI data was taken from NOAA/ NCEP/CPC Web page (see http:// www.cpc.ncep.noaa.gov/products/precip/CWlink/ daily_mjo_index/details.shtml) Finally, correlation coefficients for MJI and original and smoothed DPI were calculated.. Ingeniería de Recursos Naturales y del Ambiente, - No. 7. The lines that correspond to MJI over both 120 and 40°W has similar fluctuations with a noticeable delay caused by the eastward propagation of MJO, however in 19971998 (during strong El Niño event) this concordance was disrupted. It is possible to observe also that during El Niño events (1997-1998 and 2002-2003 in the analyzed period) the MJI tends to have the lowest values, while during cold events La Niña (1996, 1999-2000, and 20032004) the highest values are presented. At first glance, in the Figure 2 it is possible to observe too, that some extreme events of DPI are synchronic in different regions in spite they differ by their magnitude. Comparing DPI and MJI evolution is not possible to identify any pattern of correlation because in some periods they are in the same phase, and in times are in counter phase. However, a correspondence may be detected for extreme rainfall events: maximums values of DPI are associated with minimum of MJI; at least the most outstanding rainfall (heavy rainfall) events are associated to low values of MJI. The figures 3-5 present spectra of several stations of the regions analyzed in this paper (due to limitation of space, is not possible to present the spectra for all 78 stations). Also, it is necessary to consider that in these graphics the periods less than 2 decades (20 days) are not observed, because 2 decades coincide with 0.5 frequency (Niquist frequency), under which is not possible to represent the spectrum. The analysis of Figure 3 (left side) shows that for East and Central Caribbean region the graphics are similar: all spectra have peaks at 20, 30, 45 and 60 days period. In the Western sector (Aepto El Embrujo – Providence Island, and Aepto Sesquicentenario – San Andres Island) regions analyzed in this paper (due to limitation of space, is not possible to present the spectra for all 78 stations). Also, it is necessary to consider that in these graphics the periods less than 2 decades (20 days) are not observed, because 2 decades coincide with 0.5 frequency. Facultad de Ingeniería «EIDENAR». 31.
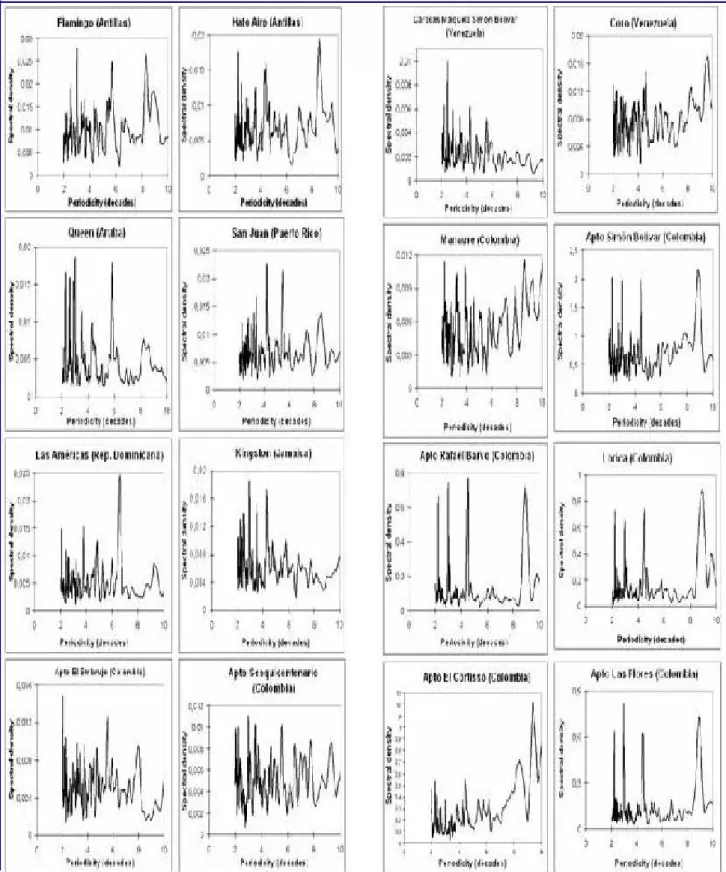
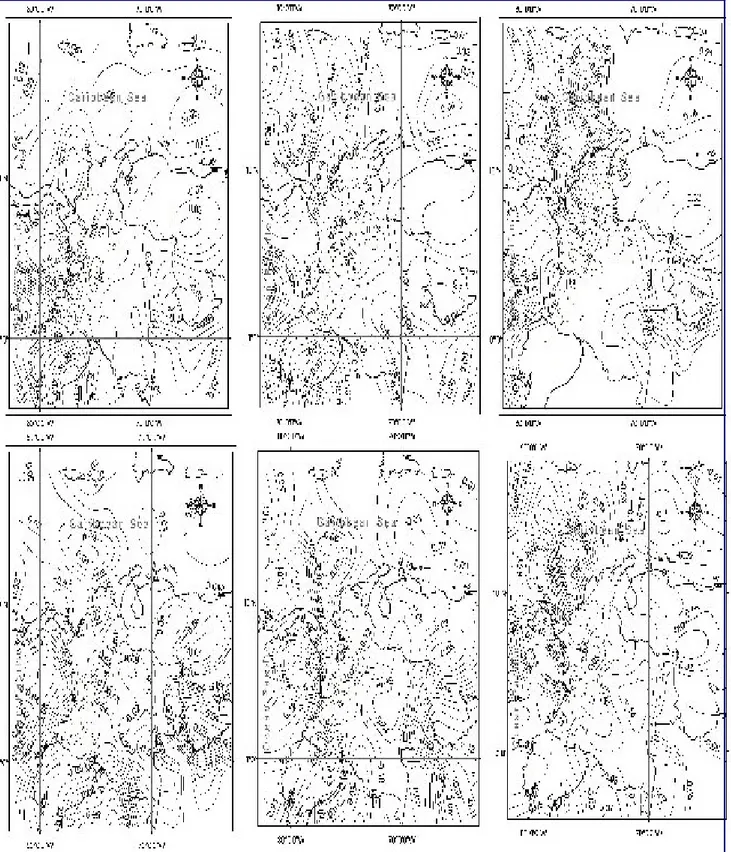
(7) Figure 3. Spectral density for DPI of stations located on the islands (left) and coastal sector (right) of Caribbean region. 32. Facultad de Ingeniería «EIDENAR». Ingeniería de Recursos Naturales y del Ambiente, - No. 7.
(8) Intraseasonal variability of rainfall over northern south America and caribbean region. Figure 4. Same as Figure 3, but for the stations located on Andean (left) and eastern plain (right) zone region. Ingeniería de Recursos Naturales y del Ambiente, - No. 7. Facultad de Ingeniería «EIDENAR». 33.
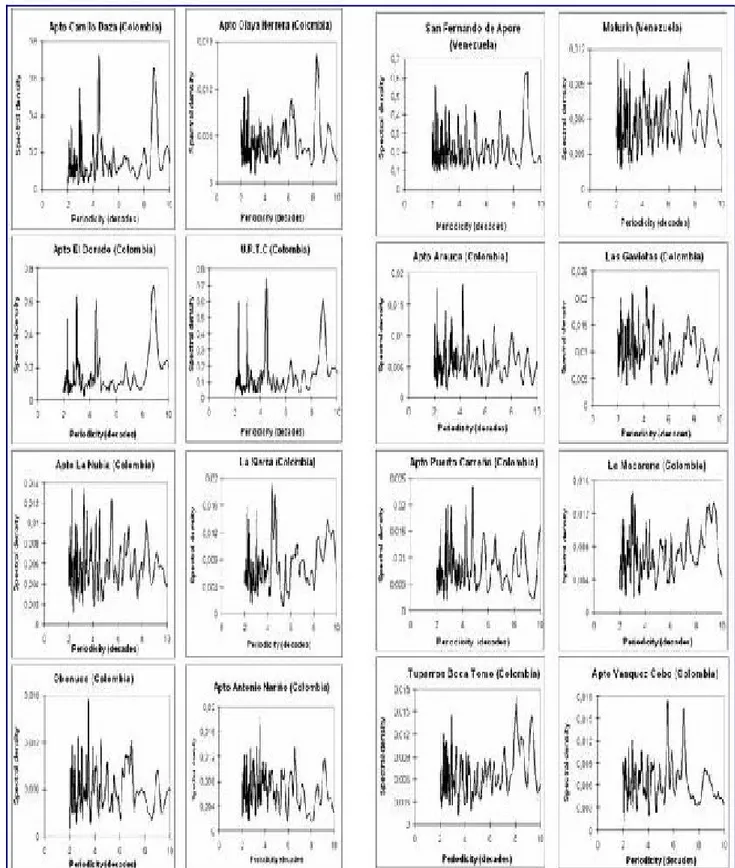
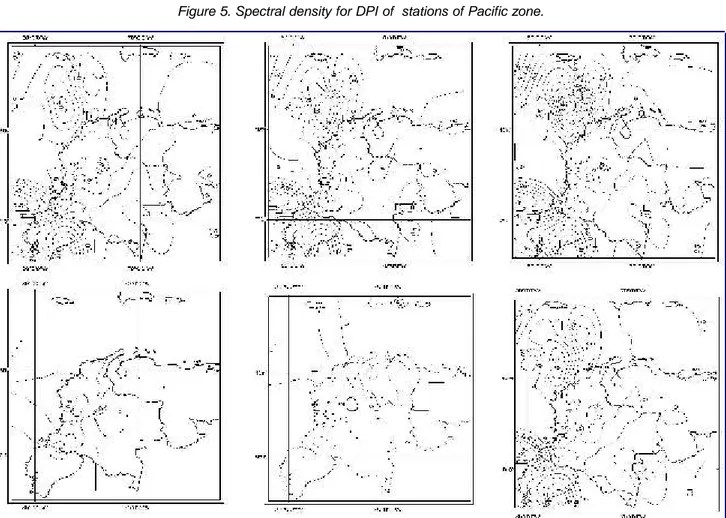
(9) (Niquist frequency), under which is not possible to represent the spectrum. These peaks are not marked and just the 20, 30 and 60 days period are slightly noticeable. In several spectra peaks are presented even over 80-90-days period, however this interval approaches to seasonal scale. The spectra over Caribbean coastal sector (Figure 3, right) show also peaks at 20, 30, and 45-days period, but the signal over 60-days period is very weak or is missing. In the mountainous sector of the region (Figure 4) there are some places were spectra did not presented an outstanding signal or the signals are weak (Airport La Nubia, Airport A Nariño and Obonuco in Pasto, Colombia), however many of them (Airport Camilo Daza – Cúcuta, UPTC and Eldorado, also in Colombia) have the 20, 30, and 45-days periods are well defined The Figure 4 (right side) shows spectra for meteorological stations of the eastern lowlands of Orinoco and Amazon basin. These spectra in the sector of intraseasonal frequencies are very noisy and it is difficult to identify clearly defined peaks at a given period. The analysis of Figure 3 (left side) shows that for East and Central Caribbean region the graphics are similar: all spectra have peaks at 20, 30, 45 and 60 days period. In the Western sector (Aepto El Embrujo – Providence Island, and Aepto Sesquicentenario – San Andres Island) regions analyzed in this paper (due to limitation of space, the interval of 50-60-days period in Panamericana and Buenaventura (Colombia) such as in Manta (Ecuador). Summarizing in a whole the region, the signals 20-25, 30and 45-days period are the most noticeable of the ISV of precipitation. A 50-60-days signal appears clearly in the Caribbean region, but is not important in others regions. The maps presented in Figure 6 show the spatial distribution of spectral density of 20-, 30-, and 45-days signals. It is possible to conclude that in spite the 20days signal is observed in all region, the major spectral density is observed over Western Caribbean and is not possible to present the spectra for all 78 stations). Also, it is necessary to consider that in these graphics the periods less than 2 decades (20 days) are not observed, because 2 decades coincide with 0.5 frequency (Niquist frequency), under which is not possible to represent the spectrum. The same situation occurs in several places in the Pacific sector (Figure 5), however there are points like Tocumen (Panama), Panamericana and Bonanza (Colombia) and. 34. Facultad de Ingeniería «EIDENAR». Manta (Ecuador) where peaks outstand over 20-25, 30 and 45-days period. Also, a marked peak appears over southwestern sector (Ecuador and Pacific ocean). For 30- and 45-days signals there is a similar distribution. The relationship between DPI and MJI was explored calculating the correlation coefficients. These coefficients are very low when the correlation is calculated for original (not smoothed) DPI time series, and increase as the high frequency modes are smoothing by moving averages. This fact suggests that the high frequency of ISV of regional precipitation is controlled by processes different from MJO. The spatial distribution of correlation coefficients are presented in Figure 7.. 4. CONCLUSIONS. The analysis made above shows that in the ISV of precipitation over Northern South America and Caribbean region there are signals with 20, 30, 45 and 60-days period. The three first are persistently observed in all the zones of the analyzed region, while the last is observed only in both the Caribbean islands and some places of Pacific sector. Searching the relationship between intraseasonal variability of regional precipitation and Madden-Julian Oscillation it did not find a defined association pattern and even the correlation coefficients between MJI and DPI were very low; however, was established that the heavy rainfall events are associated with low values of MJI. The low values of correlation coefficients and their increasing with smoothing of DPI suggest that the regional ISV is controlled not only by MJO. It is necessary to explore the nature of high frequency (20-days, for example) modes This paper partially reports the results of the research project “Analysis of colombian climate variability generated by processes different from El Niño-La NiñaSouthern Oscillation cycle” supported by both COLCIENCIAS (Colombian research support agency; grant No. 1118-05-16900, RC 178-2004) and Research Division of National University of Colombia (project numbers DIB-20100004448 (805253) and DIB20101004929).. Ingeniería de Recursos Naturales y del Ambiente, - No. 7.
(10) Intraseasonal variability of rainfall over northern south America and caribbean region. Figure 5. Spectral density for DPI of stations of Pacific zone.. Figura 6. Spatial distribution of spectral density for 20-, 30-, 45- (top, form left to right), 55-, 60- and 90-days (bottom) region. Ingeniería de Recursos Naturales y del Ambiente, - No. 7. Facultad de Ingeniería «EIDENAR». 35.
(11) Figure 7. Spatial distribution of correlation coefficients between MJI over 120°W (top) and 40°W (bottom) and the DPI original series (left), its 3-points smoothed DPI (center), and 5-points smoothed DPI (right).. 36. Facultad de Ingeniería «EIDENAR». Ingeniería de Recursos Naturales y del Ambiente, - No. 7.
(12) Intraseasonal variability of rainfall over northern south America and caribbean region. REFERENCES. Alfaro, E., Cid, L. & Enfield, D. (1998). Relaciones entre el inicio y el término de la estación lluviosa en Centroamérica y los Océanos Pacífico y Atlántico Tropical. Revista de Investigaciones Marinas 26, 5969. Baldwin, M.P., (2001) Gray, L. J., Dunkerton, T. J., Hamilton K., Haynes P. H., Randel, W. J., Holton, J. R., Alexander, M. J., Hirota, I., T. Horinouchi, T., Jones, D. B. A., Kinnersley, J. S., Marquardt, C., Sato, K., Takahashi, M.,The Quasi-Biennial Oscillation. Reviews of Geophysicis, 39,2, pp. 179229 Bantzer, C H., Wallace, J M.(1996) Intraseasonal Variability in Tropical Mean Temperature and Precipitation and their Relation to the Tropical 40-50 Day Oscillation. J. of Atmos. Sc., v. 53, No. 21 (Nov ), pp. 3032-3045. Barlow, M., Wheeler M., Lyon, B., Cullen H., (2005) Modulation of Daily Precipitation over Southwest Asia by the Madden–Julian Oscillation Monthly Wea. Review, 133 pp3579-3594. Bond, N.A., Vecchi, G.A.,(2003) The Influence of the Madden-Julian oscillation on precipitation in Oregon and Washington. Wea. Forecasting, v. 18, pp. 600613. COAPS, (2006) A Comprehensive Bibliography On The El Nino Phenomena, Center for Ocean-Atmospheric Prediction Studies (COAPS), . Florida State University, . URL: http://www.coaps.fsu.edu/lib/biblio/enso-bibintro.html (Accesed at december 2006). Chen, A.A., Stephenson, T.S., (2000) Analyzing and Understanding Climate Variability in the Caribbean Islands. University of the West Indies, Kingston 7, Jamaica. Chen, A. A., and M.Taylor, (2002) Investigating the link between early season Caribbean rainfall and the El Niño+1 year. Int. J. Climatology, v. 22 (1), pp.87-106. Enfield, D. B., (1996): Relationships of inter-American rainfall to tropical Atlantic and Pacific SST variability. Geophys. Res. Letters. 23, 3305-3308. Enfield, D. & Alfaro, E. (1999). The dependence of Caribbean rainfall on the interaction of the tropical Atlantic and Pacific Oceans. Journal of Climate 12, 2093-2103. Garreaud, R.D., (2000) Intraseasonal Variability of Moisture and Rainfall over the South American Altiplano. Monthly Wea. Rev., 128, pp. 337-3346.. Ingeniería de Recursos Naturales y del Ambiente, - No. 7. Giannini, A., Y. Kushnir Y., Cane M.A.,( 2000) Interannual Variability of Caribbean Rainfall, ENSO, and the Atlantic Ocean. Journal of Climate, 13, pp. 297– 311. Goswami, B. N., and R. S. A. Mohan, (2001) Intraseasonal oscillations and interannual variability of the Indian summer monsoon. J.Climate, 14, 1180–1198. Hastenrath, S., (1976) Variations in low-latitude circulation and extreme climatic events in the tropical Americas. J. Atmos. Sci., 33, 202-215. Hastenrath, S.,(1996) Climate Dynamics of the Tropics. Updated Edition from Climate and Circulation of the Tropics. Atmospheric Sciences Library. Kluwer Academic Publishers. Dordrecht, Netherlands, 488 p. Hendon, H.H., Liebmann B., Newman M., Glick J.D., (2000): Mediu-range Forecast Errors Associated with Actives Episodes of the Madden-Julian Oscillation. Mon. Wea. Review, v. 128, pp. 69-86. Janicot, S., Sultan B., (2001) Intra-seasonal modulation of convection in the West African monsoon. Geophys. Res. Lett., 28, 523–526. Jones, C., Carvalho L.M.V., Higgins, R.W., Waliser, D.E., Schem, J.K.E., (2004a) Climatology of Tropical Intraseasonal Convective Anomalies: 1979-2002. J. of Climate, v. 17, pp. 523-539. Jones, C., and Schemm J.-K. E., (2000) The influence of intraseasonal variations on medium-range weather forecasts over South America. Mon. Wea. Rev., 128, 486–494. Jones, C., Waliser, D.E., Lau K.M., Stern, W., (2004b) Global Occurrence of Extreme Precipitation and Madden-Julian Oscillation: Observations and Predictability. J. of Climate, v. 7, pp. 4575-4589. Jones, C., Waliser, D.E., Lau, K.M., Stern, W., (2004c) The Madden–Julian Oscillation and Its Impact on Northern Hemisphere Weather Predictability. Mon. Wea. Rev., 115, pp. 1462–1471. Kayano, M.T., Kousky, V.E., (1999) Intraseasonal (30– 60 day) variability in the global tropics: principal modes and their evolution. Tellus, 51A, pp. 373-376. Knutson, T. R., and K. M. Weickmann, (1987) 30–60 day atmospheric oscillations: Composite life cycles of convection and circulation anomalies. Mon. Wea. Rev., 115, pp. 1407–1436. Krishnamurti, V., Shukla J., (2000) Intraseasonal and interanual variability of rainfall over India. J. of Climate, v. 13, pp. 4366-4377. Krishnamurti, V., Shukla, J., (2007) Intraseasonal and Seasonally Persisting Patterns of Indian Monsoon Rainfall. J. of Climate, v. 20, pp. 3-20.. Facultad de Ingeniería «EIDENAR». 37.
(13) Liebmann, B., H. H. Hendon, and J. D. Glick, (1994) The relationship between tropical cyclones of the western Pacific and Indian Oceans and the Madden–Julian oscillation. J. Meteor. Soc. Japan, 72, 401–411. Madden, R.A., Julian, P.R., (1994) Observations of the 40-50-day tropical oscillation — a review. Mon. Weather Rev., v. 122, No. 5, pp. 814-837. Maloney, E.D., Hartmann, D.L., (2000a) Modulation of hurricane activity in the Gulf of Mexico by the Madden– Julian oscilllation. Science, 287, Issue 5460, pp. (2002–2004). Maloney, E.D., Hartmann, D.L., (2000b)Modulation of Eastern North Pacific Hurricanes by the MaddenJulian Oscillation. J. of Climate, v. 13, No. 9, pp. 1451-1460. Meehl, G.A., (1997) The South Asian monsoon and the tropospheric biennial oscillation (TBO). J. Climate, 10, p. 1921–1943. Misra ,V., (2005) Simulation of the Intraseasonal Variance of the South American Summer Monsoon., Monthly Wea. Rev., 133, pp. 663-676. Montealegre, J.E., Pabón J.D., (2000) La variabilidad climática interanual asociada al ciclo El Niño-La Niña-Oscilación del Sur y su efecto en el patrón pluviométrico de Colombia. Meteorología Colombiana, Nº 2, pp. 7-21. Mounier, F., and S. Janicot (2004), Evidence of two independent modes of convection at intraseasonal timescale in the West African summer monsoon, Geophys. Res. Lett., 31, L16116, doi:10.1029/ 2004GL020665. Nobre, P., Marengo, J.A., Calvacanti I,.F.A., Obregón, G., Barros, V., Camilloni, I., Campos, N., Ferreira, A.G., (2006): Seasonal-to-Decadal Predictability and Prediction of South American Climate. J. of Climate, 19, pp. 5988-6004. Nogués,Paegle, J., L. A. Byerle, and K. Mo, (2000) Intraseasonal modulation of South American summer precipitation. Mon. Wea. Rev., 128, 837–850. Pabón ,J.D., Montealegre, J.E., (1992) Interrelación entre el ENOS y la precipitación en el noroccidente de Suramérica. Boletín ERFEN, No. 31, p. 12. Pabón ,J.D., (2007) Improving Climate Prediction Schemes With Intraseasonal Variability: A Key Tool Toward Hydrometeorological Disasters Reduction in Tropical America. In Proceedings of International Roundtable Meeting on Lessons from Natural Disasters Policy Issues and Mitigation Strategies (Vellore, India, 8 – 12 January 2007), 10 p. Peel, M.C., McMahon, ., T.A., Finlayson B.L, (2002) Variability of Annual Precipitation and Its Relationship. 38. Facultad de Ingeniería «EIDENAR». to El Niño-Southern Oscillation. J. of Climate, 15 (6), pp. 545-551. Petersen, W.A., Nesbitt S.W., Blaskeslee, R.J., Cifelli, R., Hein P., Rutledge, S.A., (2002) TRMM Observations of Intraseasonal Variability in Convective Regimes over the Amazon. J. of Climate, 15, pp.12781294. Philander, S.G.H., (1990) El Niño, La Niña and Southern Oscillation. Academic Press, 291p Poveda, G., Mesa, O., Agudelo, P., Alvarez, J., Arias, P., Moreno, H., Salazar, L., Toro V.,Vieira, S.,( 2002) Ibfluencia de ENSO, oscilación Madden-Julian, ondas del Este, huracanes y fases de la Luna en el ciclo diruno de la precipitación en los Andes Tropicales de Colombia. Meteorología Colombiana. No. 5, pp.3-12. Poveda, G., (2004) La hidroclimatología de Colombia: una síntesis desde la escala inter-decadal hasta la escala diurna. Rev. Acad. Colomb. Cien., 28 (107): 201-222. Ropelewski, C. F., and M. S. Halpert, (1986) North American precipitation and temperature patterns associated with the El Niño/Southern Oscillation (ENSO). Mon. Wea. Rev., 114, 2352–2362. Ropelewski, C.F., Halpert, M.S., (1987) Global and regional scale precipitation patterns associated with the El Niño/Southern Oscillation. Mon. Wea. Rev., 115, pp. 1606-1626. Ropelewski, C.F., Halpert, M.S., X. Wang ,(1992) Observed Tropospheric Biennial Variability and its Relationship to the Southern Oscillation. J. of Climate, 5 (6), pp. 594-614. Sultan, B., Janicot, S., Diedhiou, A., (2003) The West African monsoon dynamics. Part I: Documentation of intraseasonal variability. J. of Climate, 16, pp. 33893406. Taylor, M.A., Enfield, D.B., Chen, A.A:, (2002) Influence of the tropical Atlantic versus the tropical Pacific on Caribbean rainfall. J. of Geoph. Res., v. 107, No. C9, 3127, doi:10.1029/2001JC001097, 2002 Walisser, D.E., Stern, W.,Schubert, S., Lau, K.M., (2003) Dynamic predictability of intraseasonal variability associated with the Asian summer monsoon. Q. J. R. Meteorol. Soc., 129, pp. 2897– 2925. Wang, X.L., Corte,Real J., Zhang, X., (1996) Intraseasonal oscillations and associated spatial-temporal structures of precipitation over China. J. of Geophysicar Research, v. 101, No. D14, pp. 1903519042. Webster, P.J., Hoyos, C., (2004) Prediction of monsoon rainfall and river discharge on 15-30-day time scales.. Ingeniería de Recursos Naturales y del Ambiente, - No. 7.
(14) This document was created with Win2PDF available at http://www.win2pdf.com. The unregistered version of Win2PDF is for evaluation or non-commercial use only. This page will not be added after purchasing Win2PDF..
(15)
Figure
+3
Documento similar
Area of the work and division into sectors: (1) Northwest Atlantic Littoral; (2) Cantabrian (Bay of Biscay) Littoral; (3) Galicia-Leon Sierras, Hills and Plains; (4)
On the other hand, sampling stations located in the northern part (SS9 and SS6) showed exogenous sediments resulting from the dredging of the seabed in other parts of the lagoon
Specifically, this tool allows (i) to obtain weather data in a place of interest, taking these data from a network of weather stations strategically installed in Murcia
Some of the WMO recognised global producing centres of decadal predictions contribute with the definition of standards for decadal predictions data and products, the evaluation of
Data extracted included: general information about the surveys (country, year, name of the survey, data collection strategy and sample age range); specific details about the
Therefore, the distribution that presented better adjusts to the Amdr data of most of the meteorological station was chosen to represent all studied region and, thus, the
Some propose that such marine incursions produced a northern South American biota that more closely resembled other equatorial biotas (e.g., northern Africa and southeast- ern
differs from the species of Pyreneplax Ossó, Domínguez and Artal, 2014 (Vultocinidae) (ex Eohalimede; ex Lobonotus) from the Eocene of South Carolina (USA), northern
