Effect of scanning direction, atmospheric oxygen and laser power on mechanical properties of selective laser sintering (SLS) of aluminium filled polyamide monolayers
83
0
0
Texto completo
(2) PONTIFICIA UNIVERSIDAD CATOLICA DE CHILE ESCUELA DE INGENIERIA. EFFECT OF SCANNING DIRECTION, ATMOSPHERIC OXYGEN AND LASER POWER ON MECHANICAL PROPERTIES OF SELECTIVE LASER SINTERING (SLS) OF ALUMINUM-FILLED POLYAMIDE MONOLAYERS. FERNANDO JOSE ALAMOS DOMEYKO. Members of the Committee: JORGE RAMOS GREZ LORETO M. VALENZUELA STEVEN R. SCHMID MARCOS SEPÚLVEDA FERNÁNDEZ. Thesis submitted to the Office of Research and Graduate Studies in partial fulfillment of the requirements for the Degree of Master of Science in Engineering Santiago de Chile, October, 2018.
(3) To God, my Parents, siblings and friends, who supported me and gave me the strength to accomplish this dream.. i.
(4) ACKNOWLEDGMENTS First, I am grateful to God for giving me the strength and perseverance to accomplish this mechanical engineer master degree. I would like to express my deepest appreciation to my adviser Jorge Ramos and his invaluable edification and guidance during graduate school and life. Without his encouragement and enlightenment, this dream would have been impossible. I have enjoyed working with him, especially because of his always positive attitude, constant help, and support. Also, I take this opportunity to express gratitude to all the members of the mechanical department for their help and support, specially to Patricio Pérez for his help and supervision during the tensile testing, to Luis Valdés, Marcelo, and Miguel Ángel for their advice and help during the experiment. I would like to thanks to the UND-PUC Seed Fund for supporting the SEM, EDS electronic microscope analysis. My sincerest appreciations go to Dr. Steven Schmid and Dr. Glen Neibur, who helped me to finish this thesis at the University of Notre Dame, with the access to the Micro CT and different labs. Finally, special thanks to my parents, siblings, and friends, who played a key role on my studies and life with their constant and unconditional help. Without your support behind me, I would never be able to accomplish this master degree and dreams.. ii.
(5) TABLE OF CONTENTS. ACKNOWLEDGMENTS ........................................................................................... ii LIST OF TABLES ....................................................................................................... v LIST OF FIGURES .................................................................................................... vi ABSTRACT ................................................................................................................ ix RESUMEN................................................................................................................... x 1.. Scientific Background ........................................................................................ 1 1.1. Introduction ................................................................................................ 1 1.2. Motivation .................................................................................................. 3 1.3. Hypothesis .................................................................................................. 4 1.4. Main Goals ................................................................................................. 4 1.5. Literature Review ....................................................................................... 5 Selective Laser Sintering ................................................................. 5 SLS Printing Parameters .................................................................. 6 Consolidation Phenomena ............................................................... 9 Energy Diffusion in SLS ............................................................... 13 Design of Experiment .................................................................... 14 1.6. Preliminary Investigation ......................................................................... 15 Material and methodology ............................................................. 15 Results and discussion ................................................................... 15 Conclusion ..................................................................................... 17. 2.. Main Article: Effect of scanning direction, atmospheric oxygen and laser power on mechanical properties of selective laser sintering (SLS) of aluminum-filled polyamide monolayers ...................................................................................... 18 2.1. Abstract .................................................................................................... 18 2.2. Introduction .............................................................................................. 18 2.3. Experimental Procedure ........................................................................... 21 SLS Set-up and Material ................................................................ 22 Fabrication Procedure .................................................................... 23 Characterization and Calibration ................................................... 25 iii.
(6) Analysis of the Design of Experiment ........................................... 27 2.4. Results and Discussion ............................................................................. 27 Tensile Testing............................................................................... 27 Delay Time .................................................................................... 32 Specimen Thickness ...................................................................... 33 2.5.3. Density and Porosity ...................................................................... 35 2.5.4. Optimized Response ...................................................................... 37 2.5.5. Morphology ................................................................................... 39 Microtomography .......................................................................... 45 2.5. Conclusions .............................................................................................. 48 2.6. Further Research ...................................................................................... 49 REFERENCES........................................................................................................... 51 A p p e n d i x ............................................................................................................. 54 A.. Stress-strain curves from tensile testing ........................................................... 55. B.. Descriptive statistic for the responses............................................................... 56. C.. ANOVA test residuals plots ............................................................................. 59. D.. Regresion equations .......................................................................................... 61. E.. SEM Micrographs ............................................................................................ 63. F.. Micro CT analysis............................................................................................. 69. iv.
(7) LIST OF TABLES Table 2-1: Properties of Alumide powder (EOS GmbH, 2012)....................................... 23 Table 2-2: Fixed printed parameters. ............................................................................... 24 Table 2-3: Ultimate tensile strength ANOVA test results. .............................................. 31 Table 2-4: Elongation at fracture ANOVA test results. ................................................... 32 Table 2-5: Specimen thickness ANOVA test results. ...................................................... 35 Table 2-6: Density ANOVA test results. ......................................................................... 37 Table 2-7: Optimum parameters of the experiment. ........................................................ 38 Table 2-8: Predicted optimized response compared with experimental results and EOS MDS values (EOS GmbH, 2012). .................................................................................... 38 Table B-1: Results of means and standard deviations (SD) for UTS and elongation. ..... 56 Table B-2: Results of means and standard deviations (SD) for density and specimen thickness. .......................................................................................................................... 57 Table B-3: Results of the porosity analysis...................................................................... 58. v.
(8) LIST OF FIGURES Figure 1-1: Rapid prototype machine saleswide (Wohler, 2001). ..................................... 1 Figure 1-2: Selective laser sintering schematics (Hopkinson et al., 2005). ....................... 6 Figure 1-3: SLS printed parameters schematic (Negi et al., 2015). ................................... 7 Figure 1-4: Tensile strength at various orientations based on delay time for EOS PA 2200 bars (Jain et al., 2009). .............................................................................................. 8 Figure 1-5: Yellowish discoloration of the material measured at different temperatures and oxygen levels (Kummert et al., 2017). ........................................................................ 9 Figure 1-6: Sintering process. (a) Particles prior to sintering. (b) Particles start to agglomerate creating necks between them. (c) Neck size increase and pore size decrease during the sintering (Gibson et al., 2015). ....................................................................... 10 Figure 1-7: Sintering phase of composite powder material (Eisen et al., 1998). ............. 11 Figure 1-8. Different materials used in liquid phase sintering. (a) Mixture of twocomponent powder. (b) Composite powder particles. (c) Coated particles. (d) Indistinct mixture. The black regions are the binder material and the light regions are the structural material (Gibson et al., 2015). .......................................................................................... 11 Figure 1-9: Main energy terms in the meltpool (Franco et al., 2010). ............................. 14 Figure 1-10: Isotherms causes by a linear source in the powder bed (Franco et al., 2010). ............................................................................................................................... 14 Figure 1-11: (a) Micrograph of the analyzed particle. (b) EDS analysis of a PA-12 particle. ............................................................................................................................. 16 Figure 1-12: (a) Micrograph of the analyzed particle. (b) EDS analysis of an aluminum particle. ............................................................................................................................. 17 Figure 2-1: Experimental set-up schematic...................................................................... 22 Figure 2-2: Chamber used to fabricate the specimens. .................................................... 23 Figure 2-3: Scanning direction angles (0º, 45º, and 60º). ................................................ 24 vi.
(9) Figure 2-4: Stress(𝜎)-strain (𝜀) curves for specimens printed at 11 W and nominal atmospheric conditions at 0º, 45º and 60º. ....................................................................... 28 Figure 2-5: Ultimate tensile strength (a) and elongation (b) versus scanning direction angle. ................................................................................................................................ 29 Figure 2-6: (a) Main effect plots, and (b) interactions plots for UTS. ............................. 30 Figure 2-7: (a) Main effect plots, and (b) interactions plots for elongation. .................... 31 Figure 2-8: UTS results versus delay time. ...................................................................... 33 Figure 2-9: Specimen thickness versus scanning direction angle. ................................... 34 Figure 2-10: (a) Main effect plots, and (b) interactions plots for specimen thickness..... 35 Figure 2-11: (a) Density versus scanning angle plots. (b) Porosity versus scanning angle plots. ................................................................................................................................. 36 Figure 2-12: Optimization plot maximizing the UTS, elongation, and density responses. ......................................................................................................................... 38 Figure 2-13: SEM images of Alumide powder. (a) Virgin powder sample (250x). (b) PA-12 particle (2500x). (c) Aluminum particle (2000x). ................................................ 40 Figure 2-14: Micrographs at the fractured surface. (a) Overall view of a specimen printed at 11 W, 21% oxygen, and 0º showing a ductile and a fragile fracture zones (250x). (b) Top area of a specimen printed at 11 W, 0.5% oxygen, and 0º (500x). (c) Ductile fracture zone at the middle of the specimens of specimen printed at 11 W, 0.5% oxygen, and 0º (1000x). (d) Fragile fracture zone at the top of a specimen printed at 11 W, 21% oxygen, and 0º (1000x). ..................................................................................... 42 Figure 2-15: Micrographs of the top surface of the specimens. (a) Overall view of a specimen printed at 10 W, 21% oxygen, and 60º (250x). (b) Amplification of the spherulites formed on the polyamide matrix having a diameter near to 10 𝜇m (5000x). 43 Figure 2-16: Micrographs of the bottom surface of the specimens. (a) Overall view of a specimen printed at 11 W, 21% oxygen, and 60º (250x). (b) Amplification of the image (1000x). ............................................................................................................................ 44 vii.
(10) Figure 2-17: Micrograph at the bottom area of the fractured surface. An unmelted PA-12 particle is adhered and surrounded by melted PA-12 (8000x)......................................... 44 Figure 2-18: Micro CT cross-section images. (a) Specimen printed at 10 W, 21% oxygen, and 60º. (b) Phantom evaluation of the specimen printed at 10 W, 21% oxygen, and 60º. (c) Specimen printed at 10 W, 0.5% oxygen, and 60º. (d) Phantom evaluation of the specimen printed at 10 W, 0.5% oxygen, and 60º. ..................................................... 46 Figure 2-19: 3-D Micro CT images of specimens at 11 W and 0.5% oxygen with different scanning angles. (a) Full specimen. (b) Analyzed volume of a specimen printed at 0º, (c) at 45º, and (d) at 60º. ......................................................................................... 47 Figure C-1: Residuals plots for ultimate tensile strength. ................................................ 59 Figure C-2: Residuals plots for elongation. ..................................................................... 59 Figure C-3: Residuals plots for specimen thickness. ....................................................... 60 Figure C-4: Residuals plots for density. ........................................................................... 60. viii.
(11) ABSTRACT In selective laser sintering (SLS) the quality and mechanicals properties of the final printed parts depend strongly on the printing parameters. Therefore, the purposes of this thesis are 1) to study the influence of scanning direction, atmospheric oxygen, and laser power on five responses: ultimate tensile strength (UTS), elongation at fracture, density, porosity, and layer thickness, and 2) to investigate the morphology and joint mechanism of lasersintered aluminum-filled polyamide-12 (EOS Alumide) monolayer specimens. The scanning angle, oxygen level, and laser power were the manipulated factors of a design of experiment (DOE) with three replicates. Tensile testing, measurement of densities and dimensions, a scanning electron microscopy (SEM), an energy dispersive X-ray spectroscopy (EDS), and a Micro CT were used to characterize the specimens. The results show that a higher scanning angle and higher laser power significantly increase the UTS, elongation, and layer thickness. However, the oxygen level only has a small effect on the elongation to fracture and on the other properties when combined with laser power or scanning angle. No changes in the morphology and internal structure in the specimens were observed using different sets of parameters. The morphology analysis revealed a composite structure formed by Al particles submerged in a molten polyamide matrix, where failure occurs at the polyamide. Two failure mechanisms were observed: a ductile failure that occurs when the particles are well-blended because the Al particles work effectively by obstructing crack propagations, and a fragile failure when the amount of Al particles is poor. As a conclusion, the laser beam has strong influence in SLS products. The scan path creates anisotropic parts, and the energy density has a significant effect on the mechanical properties. Additionally, oxidation and degradation of the material only have a small effect on the elongation to fracture of the specimens.. Keywords: Polyamide, aluminum, composite material, additive manufacturing, selective laser sintering, mechanical properties, anisotropy. ix.
(12) RESUMEN Los parámetros de impresión utilizados en el sintetizado láser selectivo (SLS) tienen un alto impacto en la calidad y propiedades mecánicas de los productos fabricados por este método. Por lo tanto, los propósitos de esta tesis son 1) estudiar el efecto del nivel de oxígeno, ángulo de escaneo y potencia del láser en cinco respuestas: resistencia última (UTS), elongación de fractura, densidad, porosidad y espesor de capa, y 2) investigar la morfología y mecanismos de adhesión de monocapas de aluminio y poliamida 12 (EOS Alumide) sintetizadas por láser. El ángulo de escaneo, nivel de oxígeno y potencia del láser fueron los factores en un diseño experimental (DOE) con tres réplicas. Para caracterizar las probetas fueron utilizados ensayos de tracción, medición de densidades y dimensiones, un microscopio electrónico (SEM), un espectrómetro de rayos X de energía dispersiva y un micro CT. Los resultados revelan un significativo aumento en UTS, elongación y espesor de capa para un ángulo de escaneo más amplio y mayor potencia del láser. Sin embargo, el nivel de oxígeno solamente causa un pequeño efecto en las propiedades cuando es combinado con la potencial del láser o el ángulo de escaneo. No se observaron efectos significativos en la morfología y estructura interna entre los diferentes parámetros. El análisis reveló una estructura compuesta formada por partículas de aluminio sumergidas en una matriz de poliamida fundida, donde la fractura ocurre en la poliamida. Dos mecanismos de fractura fueron observados: fractura dúctil en las zonas donde las partículas están bien mezcladas, debido a que las partículas de aluminio obstruyen las propagaciones de grietas, y fractura frágil cuando la cantidad de partículas de aluminio es escasa. En conclusión, las piezas fabricadas por SLS son altamente influenciadas por el láser. La trayectoria del láser genera piezas con anisótropa y densidad energética tiene un efecto significativo en las propiedades mecánicas. Adicionalmente, la oxidación y degradación del material solo tiene un pequeño efecto en la elongación hasta la fractura de las probetas. Palabras claves: poliamida, aluminio, material compuesto, manufactura aditiva, sintetizado de láser selectivo, propiedades mecánicas, anisotropía.. x.
(13) 1. 1.. SCIENTIFIC BACKGROUND. 1.1.. Introduction. Additive manufacturing (AM) operations can build parts by layers, allowing the fabrication of complex 3D-shaped parts. There are a variety of this processes such as, stereolithography, three-dimensional printing, selective laser sintering (SLS), electronbeam melting, and fused-deposition modeling (Kalpakjian & Schmid, 2014). One of the first commercialized AM process was SLS, developed in 1986 at the University of Texas, USA (Gibson et al., 2015). Sales took off exponentially after 1994 (Figure 1-1) and have been growing until today. The SLS process builds 3-D objects by selectively fusing together successive layers of powdered material. First, a 3-D CAD model (computer aided design) is sliced into discrete layers by a software. Second, a thin layer of powder from the supply chamber is spread over the powder bed area, usually the thickness of this layer is in order of microns which depends on the powder particle size. Third, a computercontrolled laser beam scans the cross-section area of the corresponding layer, heating and sintering the powder particles. This process is repeated multiple times until all layers are. RP machine sales worldwide. built, generating a 3-D object.. Year. Figure 1-1: Rapid prototype machine saleswide (Wohler, 2001). Additive manufacturing allows the construction of complex prototypes and reduces the number of tools and machines that are usually needed; this, in turn, considerably reduces.
(14) 2. the time and cost of fabricating prototypes and consequently accelerates the design process. Therefore, AM is also called rapid prototyping (RP) or rapid manufacturing. This is one of the most important advantages of AM, which has significantly contributed to the growth of this technology in the last decades. Today SLS applications are growing, and it is extensively used in many different industries such as automobile, aeronautics, biomedical, artistic and customer consumer products (Negi et al., 2013), (Negi et al., 2014). The main advantages of SLS are the variety of materials that can be used, including a wide range of polymers (i.e. ABS, PVC, polyester, polyamide, nylon, polystyrene, and epoxy), wax, metals, ceramics, and numerous types of composites (Kalpakjian & Schmid, 2014). Polymers are most commonly used because they are less expensive and not too complicated to sinter with a laser. Also, SLS does not usually require support structures, is a fully automatic process, is a speedy fabrication process in comparison with other technologies, and has an easy post-processing treatment (Steen & Mazumder, 2010), (Negi et al., 2015). Nevertheless, SLS has significant limitations. SLS parts have lower tensile strength, lower tensile modulus, lower elongation properties, and a shorter service life in comparison with conventional processing techniques, such as injection molding for polymers and machining for metals. Composites materials can be use in SLS. The inclusion of fillers usually improves the mechanical properties of polymers, maintaining their light weight and ductile nature. Therefore, composite materials are used in the polymer industry on specific applications, especially when stiff and strong parts are required. Nonetheless, the properties of lasersintered parts also depend significantly on the printing SLS parameters such as bed temperature, laser power, scan speed, scan spacing, scan count, layer thickness and delay time (Goodridge et al., 2012). In this thesis, an aluminum-filled polyamide composite material was laser-sintered to print monolayers specimens, and an analysis of the effect of different printing parameters in the mechanical properties is presented. The rest of this thesis is structured as follow: section 1.2 explains the motivation and relevance of this research, section 1.3 states the hypothesis of the thesis, section 1.4 presents the main objectives pursued in this work, section 1.5 is a literature review of the main theoretical framework about the fundamentals physics during the sintering process,.
(15) 3. and a description of the importance of the SLS printing parameters with a review of various studies of the effect of the scanning angle and oxygen level in the mechanical properties. Section 1.6 is a preliminary investigation of the material characterization. Section 1.7 present the conclusion of the thesis and section 1.8 recommendation for future research. Following this, chapter 2 contains the main article of this thesis, where section 2.1 presents the introduction of the article, section 2.2 contains the experimental set-up and used methodologies, section 2.3 present the obtained results and discussions, and finally section 2.5 are the conclusions of this work. The appendix includes all the stressstrain curves from tensile testing, the tables of the descriptive statistical analysis, the residual plots of responses of the DOE analysis, the regression equations obtained from the statistical analysis for each response, the SEM micrographs, and Micro CT images. 1.2.. Motivation. The results of the investigation should promote the study and development of additive manufacturing in Chile, specifically in the development of composite materials. Layer manufacturing allows rapid product development and production, and its capacity to design complex 3-dimensional geometries has revolutionized the manufacturing in the world, where the sales of this technology have been growing exponentially since 1994 (Wohler, 2001), as illustrated in Figure 1-1. The composite materials for SLS can be obtained with specific functional and mechanical properties; therefore, its study is important to characterize the material and be able to design news parts, where Chile can take an important role to develop the polymer and composites industry in the country. Additionally, the results of the research should give information of SLS parameters to print Alumide powders (EOS GmbH, 2012) and improve mechanical properties or decrease the cost of manufacturing. The anisotropy in SLS parts is a property that should be considered (Bassoli et al., 2012), (Jain et al., 2009), which is caused by the orientations of the layers and the scanning direction for each layer, and has significant effect in the mechanical properties of the parts. During the printing process, a low oxygen atmosphere is used, where nitrogen and argon are the most common gases used to displace the oxygen which is inside of the building chamber; however, the effect of atmospheric oxygen during.
(16) 4. the fabrication process of SLS polyamide parts is not clear yet, which means, for example, that maybe the cost of the gases can be reduced during the printing without compromising the quality of the parts. So far, our literature review has not shown any previous studies about this. SLS monolayers were printed in this thesis to study the properties of single layer bars. Multilayers objects were not studied in this research because there were not multilayer systems available in the facilities. Furthermore, the goal of the thesis is to examine the behavior and properties of a single layer instead of a bulk, to better understand the effects of SLS printing parameters and the join mechanism in an aluminum-filled polyamide composite laser-sintered layer. 1.3.. Hypothesis. The printing parameters of the selective laser sintering (SLS) such us scanning direction, atmospheric oxygen and laser power have an influence on the mechanical properties of the aluminum-filled polyamide monolayers. The modification of each parameter would change the mechanical properties of the specimens. 1.4.. Main Goals. The general goal of this research is to make an experimental study of the effect of atmospheric oxygen, scanning direction, energy density and other parameters of the selective laser sintering (SLS) on the microstructure and mechanical properties of aluminum-filled polyamide monolayers, and find the best printed parameters within the used rank parameters. Furthermore, the specific goals are the following: 1. Build a chamber able to establish a control atmospheric pressure about 0.8 to 6 bars, to vary the percent of atmospheric oxygen inside of the chamber. 2. Determine and adjust the process parameters to reach the optimal sintered condition for consistent results. 3. Select and determine the windows of the process parameters to investigate their influence on the mechanical properties..
(17) 5. 4. Build the same specimens combining the different parameters using one standard operating procedure, to ensure the repeatability and independence of the results. 5. Study and analyze the influence of the selected process parameters on the microstructure and mechanical properties of the specimens. 1.5.. Literature Review Selective Laser Sintering. The SLS process is a powder bed fusion (PBF) process which builds 3-D objects by melting and sintering powdered material layer by layer. SLS has different applications in various industries due to its versatility in processing a wide range of materials, where most of the materials that can melt or sinter can be used in this process. Most of the SLS machines basically consist of a thermal source which melts and sinters the powder, a chamber which contains the supply powder, a second chamber where the part is built, and a mechanism that moves the powder form the supply to the built chamber. Figure 1-2 shows the schematics of a two feed chamber SLS machine with counter rotation roller, typically use by 3D Systems. SLS basically consists of the process described below. First, the supply chamber is raised and provides a thin layer of powder, and simultaneously the build chamber is lowered below the bed level. Then a roller or a blade is used to move and spread the powder from the supply to the built chamber, forming a thin layer of powder, typically between 20 to 150 µm, depending the particle size of the powder. After the powder is spread, a laser beam is used to scan and melt the unfused powder particles, creating a thin solid layer of material. This process is repeated multiple times, fusing every new layer with the layer that is below until a solid 3-D object is complete. The laser beam comes from an external laser source which is focused on a local spot of the powder bed by special laser optics. The scanning path is generated by scanning mirrors and galvometers, which are moved by a controller connected to a CAD software..
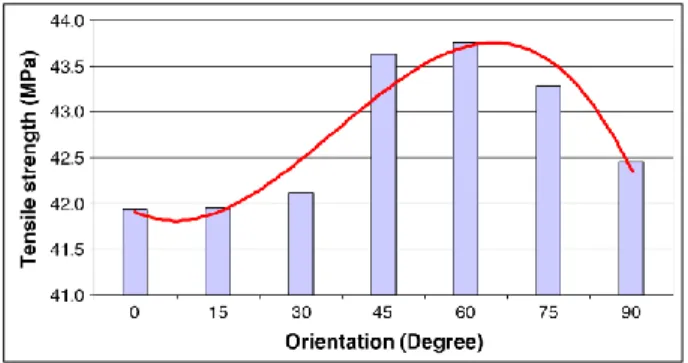
(18) 6. Additionally, during the process, specific environmental conditions inside of the built chamber have to been achieve. Typically, nitrogen or argon is used to create an inert atmosphere to reduce the oxidation and degradation of the materials, especially for metals and alloys. Also, in plastic materials infrared heaters are usually used to warm up the powder just below the melting point or the glass transition temperature of the material. This is used to minimize the laser requirements of the process and achieve better final products (Gibson et al., 2015).. Figure 1-2: Selective laser sintering schematics of a two feed chamber machine (Hopkinson et al., 2005). SLS Printing Parameters Various printing parameters are involved in SLS, and the quality and mechanicals properties of the final printed parts depend significantly on these parameters. The literature has covered extensively the effect of those parameters for different SLS materials. The main SLS printed parameters (Figure 1-3) are: laser power, scan speed, scan spacing (hatch distance), scan path, spot size, layer thickness, beam offset, and the scan count (number of times the laser beam traverses a scan vector per layer). Likewise, the following printed parameters also have significant influence: the sinter-scan (alternation of the x and y axes between layers), delay time, contour scan setting, skywriting, heat distribution, and thermal control of the powder bed (Goodridge et al., 2012)..
(19) 7. Figure 1-3: SLS printed parameters schematic (Negi et al., 2015). The printed orientation also has been seen to be substantial in the mechanical properties of specimens due to the anisotropy behavior of the parts. Bassoli et al., 2012 fabricated specimens by SLS using an aluminum-filled polyamide and an alumina-polyamide composite material to investigate the mechanical properties and failure mechanisms, in comparison with unfilled PA. The result proves a relevant anisotropy between the bars printed horizontally and vertically, which depend on the efficacy of the strengthening mechanisms during the crack propagation, where the horizontal specimens showed a bigger area of ductile failure. Moreover, the elastic modulus is considerably higher for the filled materials than for the plain PA. The energy density (ED) is a relevant parameter that is extensively used in SLS (Equation 2.1). The ED is function of the laser power (LP), laser speed (LS), and hatch distance (HD), which are the most influential and most common altered parameters in SLS. 𝐸𝐷 =. 𝐿𝑃 𝐿𝑆 ∗ 𝐻𝐷. (2.1). Caulfield et al., 2007 studied the effect of energy density (ED) and orientation during the building on the density and mechanical properties such as yield strength, tensile strength, elongation, and Young’s Modulus of laser sintered polyamide parts. They concluded that parts printed at high ED have better mechanical properties, and the orientation has significant effects on the tensile strength and elongation..
(20) 8. Jain et al., 2009 fabricated SLS polyamide specimens for different ranges of delay time, which depend on the orientation during building, to develop an algorithm to find the optimum value for tensile strength. The delay time (𝑇𝑑 ) is the time difference between any two adjacent points on successive scanning lines on a layer, and can be calculated using Equation 2.2, where 𝐷 is the distance travelled by the laser beam to scan the two consecutive points. Notice that the delay time depends on the scan path geometry, which can be varied by changing the scanning direction angles. 𝑇𝑑 =. 𝐷 𝐿𝑆. (2.2). They found that delay time influences the strength of parts significantly. The tensile strength improves significantly when the angle increases, reaching a optimum value at 60º, and then there is an abrupt drop between 60º and 90º (Figure 1-4).. Figure 1-4: Tensile strength at various orientations based on delay time for EOS PA 2200 bars (Jain et al., 2009). Degradation of polymers in air at high temperature is essentially oxidative in nature, and usually commercial machines use an inert atmosphere. However, so far our literature review has not shown studies about the effect of atmospheric oxygen during the fabrication process of SLS polyamide parts and its effect on SLS is not well known yet. In one investigation of injection molding, Nylon-6 and Nylon-66 yarns were exposed in air, nitrogen or vacuum to temperatures from 136 to 215ºC for different periods of time. The ultimate tensile strength of the specimens was reduced by the exposure in the presence of oxygen (Valkot & Chiklis, 1965). A similar study investigated the influence of degradation behavior of polyamide 12 powder for SLS at different building chamber.
(21) 9. temperatures and ambient conditions. The results showed that the process’ material properties such as melt volume and viscosity were reduced by storing the powder under vacuum during the powder coating process (Wudy et al., 2014). A recent study on a thermoplastic elastomer material called PrimePart ST showed that the yellowish discoloration of the material depends on the concentration of atmospheric oxygen and the temperature. The material turns more yellowish at a high temperature (136 °C) and higher concentration of oxygen (atmospheric air), (Figure 1-5). However, the oxygen and temperature did not show a significant influence on the tensile strength and the elongation to fracture of the printed specimens (Kummert et al., 2017).. Figure 1-5: Yellowish discoloration of the material measured at different temperatures and oxygen levels (Kummert et al., 2017). Consolidation Phenomena Different consolidation mechanism occurs during the scanning process in SLS, and these depends on the nature of the material and the printing parameters used during the printing process. Kruth et al., 2007 reported the following consolidation mechanism: -. Solid-state sintering: is a consolidation process where the governing force is the minimization of total free energy of the powder particles. When particles reach elevated temperatures, 0.5 Tm (absolute melting temperature), the total surface area decreases, and thus surface energy decreases. Therefore, a diffusion between the.
(22) 10. powder particles at solid stage creates necks between the adjacent particles, generating an agglomeration and voids between the particles, in order to reduce the total free energy of the powder (Figure 1-6). Then neck size increases and pore size decreases, reducing the total surface of the powder and consequently the sintering rate slows. To achieve very low porosity and dense parts longer sintering times, high sintering temperatures, or/and use of an external pressure are required. This can be done with hot isostatic pressing. Nevertheless, the diffusion rate also increases exponentially with higher temperatures and occurs rapidly when is close to the melting point. However, the solid-state sintering consolidation mechanism is the slowest, and usually is not fast enough to be the main mechanism in SLS. (Gibson et al., 2015). Ceramics powders are frequently governed by this consolidated mechanism.. Figure 1-6: Sintering process. (a) Particles prior to sintering. (b) Particles start to agglomerate creating necks between them. (c) Neck size increase and pore size decrease during the sintering (Gibson et al., 2015). -. Liquid phase sintering: is a partial melting of the powder where one part of the powder material is melted while the rest remains solid. This consolidation mechanism happens when the melted material, also called the binder or additive, has a considerable lower melting point than the one that remains solid, also called the structural or base material. When the laser beam scanning raises the temperature of the powder, the binder material particles melt and spread between the solid particles, as it is driven by intense capillary forces. Then the molten material cools down which generates a matrix that adheres the solid particles.
(23) 11. (Figure 1-7). The binder materials usually melt almost instantaneously, allowing much higher laser scan velocities. The binder and structural material can be combined in following ways: mixture of two-component powder (i.e. aluminum filled polyamide powder), composite powder particles where a micro structure contains both material, coated particles that have the binder material as a coating of the structural material, and indistinct mixture. In the case of this research a twocomponent powder is used (Figure 1-8).. Figure 1-7: Sintering phase of composite powder material (Eisen et al., 1998).. Figure 1-8. Different materials used in liquid phase sintering. (a) Mixture of twocomponent powder. (b) Composite powder particles. (c) Coated particles. (d) Indistinct mixture. The black regions are the binder material and the light regions are the structural material (Gibson et al., 2015)..
(24) 12. -. Partial melting: occurs when the powder particles only melts partially. This can happen with a single-phase material or a mixture of different powders but without similar binder and structural powder material. This consolidation mechanism can be classified in three ways. First, when the amount of energy from the laser beam is insufficient to melt the entire blinder particle, the core remains solid. The molten material will adhere to the solid cores and the structural material. Second, when the powders have multiple phases or when a mixture of different powder particles are only partially molten. Third, when using a single material powder having a bimodal distribution, where the small particles melt, while larger ones remains solid.. -. Full melting: is a consolidation mechanism that completely melts the powder particles, and it is also known as Direct Metal Laser Sintering (DMLS). During the scanning process, the laser melts completely the powder particles and the meltpool exceed the layer thickness. The energy provided by the laser is sufficient to re-melt the previous layer, which creates a well-bonded part. DMLS is typically used in metal alloys and semi-crystalline polymers to print fully dense parts without post-process densification (Gibson, et al, 2015), (Kruth et al., 2007). Kruth et al., 2003 printed metalic parts with densities of 99.9% by using DMLS and reaching high energy densities in a small spot with the laser beam.. -. Chemical induced binding: is not commonly used in commercial layer manufacturing, however is feasible for polymers, metals and ceramics. This consolidation mechanism binds the powder particles by a thermal activated chemical reaction. This exothermic reaction can be between two different types of powders or between atmospheric gases and the powder. Typically, the powders are pre-mixed and then heated up using low laser energies. Chemical induced binding is primary used in ceramic materials, and printed parts usually have low porosity; therefore, post-processes are needed, which increases the cost and time of fabrication. For this reason, the technologies that use this consolidation mechanism have not been commercialized successfully..
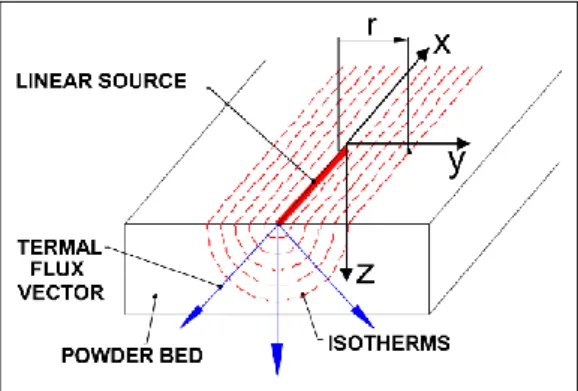
(25) 13. Energy Diffusion in SLS During the laser scanning process, the laser beam melts the powder particles producing the meltpool. Several analytical solutions of the unsteady state heat equation have been used to model this behavior. The one-dimensional heat equation is defined as: 𝜕𝑇(𝑧, 𝑡) 𝜕 2 𝑇(𝑧, 𝑡) =𝛼 𝜕𝑡 𝜕𝑧 2. (1.1). where 𝑇 is the temperature in function of the z-direction and time 𝑡 and 𝛼 is the thermal diffusivity of the material. Franco et al., 2010 analyzed the SLS from an energy perspective, identifying the main energy terms during the scanning process at the melt pool (Figure 1-9). The energy provided by the laser beam in form of radiation interacts with the surface of the powder bed, where the radiation is reflected, transmitted and absorbed by the powder. The absorbed energy will be transferred by conduction, and the particles melt. Then, the molten mass cools down by heat transfer via radiation and convection to the environment. Furthermore, their study presents a different time dependent conduction model, neglecting convection and radiation. In this model, the laser beam modeled as a line heat source Q generates semi-cylindrical isotherms across the powder bed that can be expressed as: 𝑄 𝑟2 𝑇(𝑟, 𝑡) − 𝑇0 = exp (− ) 4𝜋𝑘𝑡 4𝛼𝑡. (1.2). where 𝑟 is the radius, 𝑇0 the initial temperature of the powder bed and 𝑘 the thermal conductivity. Is important to notice that the temperature decrease exponentially over the radius; therefore, the energy does not penetrate deeply and only the particles close to the top surface will melt..
(26) 14. Figure 1-9: Main energy terms in the meltpool (Franco et al., 2010).. Figure 1-10: Isotherms causes by a linear source in the powder bed (Franco et al., 2010). Design of Experiment In order to quantify the effect of printed parameters in the mechanical properties of the specimen, an analysis of the variance (ANOVA) has to be performed for each response independently. The ANOVA test determines when the differences between the means are statistically significant, comparing the p-value with the significance level to assess the null hypothesis, which states that the means of the responses are all equal. Therefore, when the p-values are lower than 0.05 the factor can be considered significant for the response (Montgomery, 2012). The ANOVA assumptions. – independence of cases,. homoscedasticity, and normality of the residuals – have to be met to have a valid analysis. Main effects plots are used to examine the effect of different independent variables by plotting the means for each value of an independent variable. A steeper slope of the main.
(27) 15. effects line has a greater effect than the independent has on the dependent variable. Interaction plots are used to visualize possible interactions, showing when one independent variable could affect another. Parallel lines indicate no interaction. A greater difference between the slope indicates a higher interaction between the factors. Minitab 17 can calculate an optimized response maximizing the composite desirability of the responses. Individual and composite desirability are used to evaluate how well a combination of parameters satisfy a defined goal. Minitab 17 computes the individual desirability to evaluate every variable by itself using a utility transfer function, and the composite to evaluate how the settings optimize a set of responses overall, which is the weighted geometric mean of the individual desirability for the responses. 1.6.. Preliminary Investigation Material and methodology. A preliminary material characterization was performed to verify the chemistry of the powder particles and analyze the morphology of the EOS Alumide powder (EOS GmbH, 2012). A scanning electron microscopy (SEM) with an energy dispersive X-ray spectroscopy (EDS) was used to analyze a virgin powder sample. First, a virgin EOS Alumide sample powder was deposited on a small recipient. Second, an ultra-thin gold coating was applied on the sample to improve the imaging of the sample. Third, the sample was introduced into the SEM and two different types of particles were identified, images with different increments were taken. Finally, EDS analysis were applied on 4 different particles, two of each type, and the respective reports were compared. Results and discussion The EOS Alumide powder is a metallic grey, aluminum-filled polyamide 12 (PA-12) powder with particle sizes between 30 and 250 µm. The imaging revealed a twocomponent powder, where the aluminum is the structural material and the polyamide is the binder. Both types of particles have similar sizes but different shapes and roughness. The PA-12 particles show a spherical shape, rough surface, and are principally composed.
(28) 16. of carbon, hydrogen, iridium, oxygen, and nitrogen (Figure 1-11). Considering that the chemical composition of the PA-12 is [(CH2)11C(O)NH]n, the high concentration of iridium was reviewed. This could be some additive to improve the properties form the supplier. The aluminum particles instead show an extended shape, are smoother than the PA-12 particles, and are composed of pure aluminum only (Figure 1-12).. (a). PA-12 particles. cps/eV. (b). 6. 5. 4. 3 Ir. Ir. C. C. N. N. O. Al. O. Si. Al. Si. Ir. Ir. 2. 1. 0 0.5. 1.0. 1.5. keV. 2.0. 2.5. 3.0. Figure 1-11: (a) Micrograph of the analyzed particle. (b) EDS analysis of a PA-12 particle..
(29) 17. (a) Al particles. cps/eV. (b) 30. 25. 20. 15 Ir. Ir. C. C. N. O. Al. Al. O. N. Si. Si. Ir. Ir. 10. 5. 0 0.5. 1.0. 1.5. keV. 2.0. 2.5. 3.0. Figure 1-12: (a) Micrograph of the analyzed particle. (b) EDS analysis of an aluminum particle. Conclusion The EOS Alumide powder is two-component powder, with particles sizes between 30 and 250 µm. The aluminum (structural material) have a higher melting point than the polyamide (binder); therefore, during the scanning process the laser beam will melt the polyamide while the aluminum remains solid. The melted particles should spread between the solid particles by capillary force and a polyamide matrix might form. Additionally, the pores should not be bigger than 250 µm, because that is the maximum sizes of the particles. Bigger pores will suggest a degradation of the material..
(30) 18. 2.. MAIN. ARTICLE:. EFFECT. OF. SCANNING. DIRECTION,. ATMOSPHERIC OXYGEN AND LASER POWER ON MECHANICAL PROPERTIES OF SELECTIVE LASER SINTERING (SLS) OF ALUMINUM-FILLED POLYAMIDE MONOLAYERS 2.1.. Abstract. In selective laser sintering (SLS) the quality and mechanical properties of the final printed parts depend strongly on the printing parameters. To better understand SLS on composite materials, this study focusses on the influence of scanning direction, atmospheric oxygen, and laser power on mechanical properties (ultimate tensile strength (UTS), elongation, density, and porosity), morphology, and joint mechanisms of laser-sintered aluminumfilled polyamide-12 (EOS Alumide) monolayer specimens. The results show that a higher scanning angle and higher laser power significantly increase the UTS, elongation, and layer thickness. However, the oxygen level only has a small effect on the elongation to fracture. The oxygen level also shows small interactions with laser power or scanning angle. No changes in the morphology and internal structure in the specimens were observed using different sets of parameters. The morphology analysis revealed a composite structure formed by Al particles submerged in a molten polyamide matrix, where failure occurs at the polyamide. Two failure mechanisms were observed: a ductile failure that occurs when the particles are well-blended because the Al particles work effectively by obstructing crack propagations, and a fragile failure when the amount of Al particles is poor. As a conclusion, oxidation and degradation of the material only have a small effect on the elongation to fracture and a small effect on the other properties when combined with laser power or scanning angle. Additionally, as expected, the scan path creates anisotropic parts, and the energy density has a significant effect on the mechanical properties. 2.2.. Introduction. Selective laser sintering (SLS) is an additive manufacturing (AM) process that can build complex 3D-shaped parts. It consists of a laser beam that selectively sinters layer by layer.
(31) 19. a bed of powdered material. SLS is extensively used in many different industries such as automobile, aeronautics, biomedical, and artistic (Bernard et al., 2009), (Negi et al., 2014), (Negi et al., 2015). Compared to others AM processes, SLS can used a wide range of materials like various types of polymers, metals and composites. It also does not usually require support structures, is a fully automatic process, is a speedy fabrication process, and has an easy post-processing treatment (Steen & Mazumder, 2010), (Negi et al., 2015). However, the SLS process is limited, because specimens fabricated by this technology have inferior tensile strength, tensile modulus, elongation, and the service life in comparison to the conventional polymer-processing techniques, such as injection molding, extrusion, thermoforming, and machining processes (Kruth et al., 2007). The mechanical properties of polymers are lower compared to metals and ceramics; however, they can be improved by the inclusion of fillers, maintaining their lightweight and ductile nature. Therefore, composite materials are used in the polymer industry on specific applications, especially when stiff and robust parts are required. One of the advantages of SLS is the capability to process composite materials, like aluminumreinforced polyamide, which have higher stiffness, thermal conductivity, and dimensional accuracy than unfilled polyamide (EOS GmbH, 2012). However, the mechanical properties of fabricated SLS polyamide parts not only depend on the used material, they are also influenced by several process parameters such as bed temperature, laser power, scan speed, scan spacing, layer thickness, delay time and many others (Goodridge et al., 2012). Many research efforts have reported studies to improve the mechanical properties of parts produced by SLS. Mazzoli et al., 2007 characterized a new aluminum-filled polyamide powder developed for SLS application, and compared the new material to a commercial polyamide powder (DuraForm). They conclude that the material has a considerable high dimensional accuracy, strength and resistance to mechanical stress, and better finishing properties in comparison to the plain PA. Moreover, they show that the aluminum-filled polyamide is an opaque material to the X-rays and therefore can be used in biomedical applications (Mazzoli et al., 2007). Bazzoli et al., 2012 fabricated specimens by SLS using an aluminum-filled polyamide and an alumina-polyamide composite material to.
(32) 20. investigate the mechanical properties and failure mechanisms, in comparison with unfilled PA. The result proves a relevant anisotropy between the bars printed horizontally and vertically, which depend on the efficacy of the strengthening mechanisms during the crack propagation, where the horizontal specimens showed a bigger area of ductile failure. Moreover, the elastic modulus is considerably higher for the filled materials than for the plain PA (Bassoli et al., 2012). Caulfield et al., 2007 studied the effect of energy density (ED) and orientation during the building on the density and mechanical properties such as yield strength, tensile strength, elongation, and Young’s Modulus of laser sintered polyamide parts. They concluded that parts printed at high ED have better mechanical properties, and the orientation has significant effects on the tensile strength and elongation. The energy density (ED) that affects the part quality was calculated by equation 2.1, where 𝐿𝑃 is the laser power, 𝐿𝑆 the laser speed, and 𝐻𝐷 the hatch distance (Caulfield et al., 2007). 𝐸𝐷 =. 𝐿𝑃 𝐿𝑆 ∗ 𝐻𝐷. (2.1). Jain et al., 2009 fabricated SLS polyamide specimens for different ranges of delay time, which depend on the orientation during building, to develop an algorithm to find the optimum for tensile strength. The delay time (𝑇𝑑 ) is the time difference between any two adjacent points on successive scanning lines on a layer, and can be calculated using Equation 2.2, where 𝐷 is the distance travelled by the laser beam to scan the two consecutive points. Notice that the delay time depends on the scan path geometry, which can be varied by changing the scanning direction angles (Jain et al., 2009). 𝑇𝑑 =. 𝐷 𝐿𝑆. (2.2). A significantly influence of the delay time on the strength was found. The tensile strength improves significantly when the angle increases, reaching a optimum value at 60º, and then there is an abrupt drop between 60º and 90º. The further drop on the tensile strength for between 60º and 90º (higher delay time), can happen due to insufficient power to sinter the powder particles. As well, Sabelle et al., 2018 obtained a similar behavior for the UTS.
(33) 21. with respect to the scanning angle sintering Cu-Sn-Ni alloy metallic monolayers using different laser scanning speeds. Degradation of polymers in air at high temperature is essentially oxidative in nature. In one investigation of injection molding, Nylon-6 and Nylon-66 yarns were exposed in air, nitrogen or vacuum to temperatures from 136 to 215ºC for periods from 5 min. to 17.5 hr. The ultimate tensile strengths of the specimens were reduced in time by the exposure in air (Valkot & Chiklis, 1965). A similar study investigated the influence of degradation behavior of polyamide 12 powder for SLS at different building chamber temperatures and ambient conditions. The results showed that the process’ material properties such as melt volume and viscosity were reduced by storing the powder under vacuum during the powder coating process (Wudy et al., 2014). A recent study on a thermoplastic elastomer material investigated the aging effect caused by the temperature histories and oxygen atmosphere on the color and mechanical properties of printed specimens of this material. The result revealed that the yellowish discoloration of the material depends on the temperature and the concentration of atmospheric oxygen. A higher discoloration was reached using an air atmosphere, instead of a nitrogen atmosphere (0% oxygen), and at higher temperatures. However, the mechanical properties – tensile strength and elongation – did not change with using different atmospheres (Kummert et al., 2017). 2.3.. Experimental Procedure. To study the effects of the atmospheric oxygen, scanning direction and laser power on the mechanical properties and morphology of Alumide sintered monolayers, a chamber was built to vary the percent of atmospheric oxygen inside of it during the sintering process. To achieve successful and testable specimens, the printed parameters were adjusted, and the printed parameters windows were selected. Then, specimens were built combining the different parameters using one standard operating procedure, to ensure the repeatability and independence of the results, and different mechanical properties and morphology of the specimens were studied..
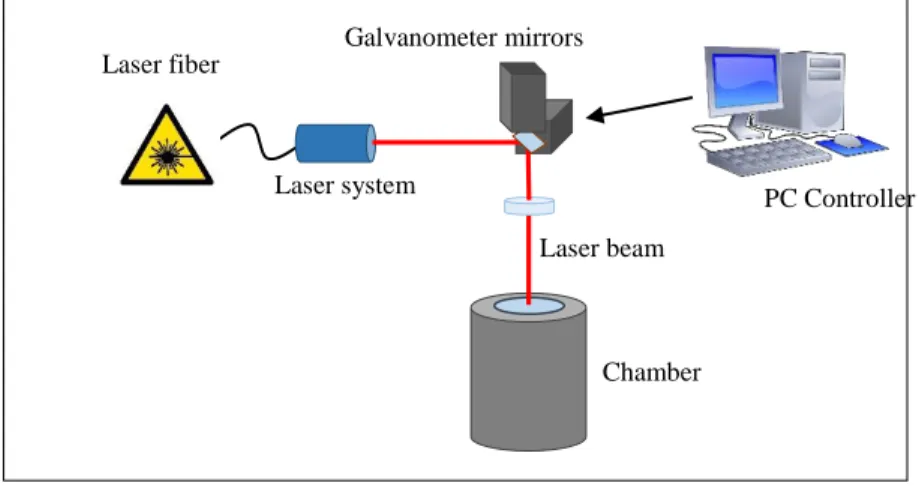
(34) 22. SLS Set-up and Material The set-up used on the experiment (Figure 2-1) consisted of a chamber able to establish a controlled atmospheric pressure of about 0.2 to 6.0 bars. This chamber allows the percent of atmospheric oxygen inside of it to be changed by connecting it to a mechanical vacuum pump and a pressurized argon line. A Nd:YAG fiber glass laser YLR-300-AC-MM from IPG Photonics corporation was used to sinter the powder; the instrument has a maximum power of 300 W and a wavelength of 1.07 µm. The galvanometers of the laser were controlled by a DE controller series form General Scanning INC. For the experiment, an aluminum-filled polyamide 12 powder material (Alumide) was used. The Alumide powder is a commercial material provided by EOS GmbH, which is characterized by its high stiffness, metallic grey appearance and good post-processing possibilities. In addition, laser sintered Alumide parts have excellent dimensional accuracy, well-balanced ratio of density stiffness, better thermal conductivity than parts fabricated from PA12, and good machinability. The surface of the parts can be refined by grinding, polishing and coating (EOS GmbH, 2012). Some properties of Alumide are listed on Table 2-1. Galvanometer mirrors Laser fiber. Laser system. PC Controller Laser beam. Chamber. Figure 2-1: Experimental set-up schematic..
(35) 23. Figure 2-2: Chamber used to fabricate the specimens. Table 2-1: Properties of Alumide powder (EOS GmbH, 2012). Properties Elastic modulus Tensile strength Melting temperature (20°C/min) Density (laser sintered). Values 3.8 GPa 48 MPa 176°C 1360 kg/m3. Fabrication Procedure A single layer of Alumide powder was sintered using a Nd:YAG fiber glass laser. The. printed specimens had a size of 4.1 mm x 56 mm (Figure 2-7), where the thickness varies depending on different printing parameters. A design of experiment (DOE) was implemented to analyze the effect of different parameters. The angle of the scanning direction was varied on 3 levels (Figure 2-3), the oxygen was varied on 3 levels, and the power on 2 levels, obtaining a 32x2 factorial design. Four replicates were printed for each combination of parameters (72 bars), three were used for tensile testing, and the other was used on the Micro CT porosity analysis. The DOE factors of interest were: -. Scanning direction angle (0º, 45º, and 60º). -. Laser Power (10 and 11 W). -. Oxygen inside the chamber (0.51%, 3.2%, and under atmospheric conditions).
(36) 24. The fixed printed parameters are shown on Table 2-2, and all the specimens were sintered at the same conditions, to ensure the repeatability of the experiment. It is important to highlight that the values used for the laser power, laser speed, and hatch distance are smaller than the usual values to laser sintered polyamide powders (Zarringhalam et al., 2006). This set of parameters were selected after a calibration process on the machine. Considering the limitation of the galvanometers and its controller, different specimens were printed and tested using a laser power between 9 and 24 W; however, only the specimens at 10 and 11 W were printed successfully. At 9 W the power was not sufficient to fused the powder particles and at 12 W the degradation of the powder began to be observed. Additionally, that set of parameters were the best in order to fabricate thin monolayers to later be used on the tensile testing and others post-analysis.. 0° 45° 60°. Figure 2-3: Scanning direction angles (0º, 45º, and 60º). Table 2-2: Fixed printed parameters. Fixed printed parameters Laser speed Hatch distance Laser focused spot size Room temperature. Values 78 mm/s 0.05 mm 0.24 mm 17 °C. To print the specimen, first, Alumide virgin powder was deposited in a receptacle 15 cm long, 4 cm wide, and 2 cm deep, forming a flat surface by spreading the top with a metallic spatula, where the laser will sinter the powder. Then the recipient was introduced inside of the chamber and the chamber was closed. The specimens were printed using two.
(37) 25. different percentages of oxygen inside of the chamber. For the specimens printed under atmospheric conditions (21% of oxygen approx.), the chamber was maintained at atmospheric condition. On the other hand, for the specimens sintered at 0.51% and 3.2% oxygen (estimated values), first the pressure of the chamber was reduced using a mechanical vacuum pump down to 0.2 bar (absolute), and then the pressure was raised up to 6 bar (absolute) with pressurized argon, decreasing the percent of oxygen inside of the chamber. The percent of oxygen inside of the chamber (𝑂2 ) was estimated assuming the ideal gas law and using the Equation 2.3, where 𝑂2 atm is the percent of oxygen on the atmosphere (20.95 %), 𝑃𝑖 is the initial pressure of the chamber (0.2 bar), 𝑃 is the pressure at some instant, 𝑀𝑊air is the molecular mass of the air (29 g/mol), and 𝑀𝑊Ar is the molecular mass of the argon (39.9 g/mol). 𝑂2 =. 𝑃𝑖 𝑀𝑊air 𝑂2 atm 𝑃𝑖 𝑀𝑊air + (𝑃 − 𝑃𝑖 ) 𝑀𝑊Ar. (2.3). A positive pressure was used inside of the chamber, to ensure that the outside air was not filtering inside the chamber. Second, the software which controls the galvanometer and the laser were configured with the printing parameters. Then, the piece was sintered, and finally the pressure of the chamber was released carefully, and the specimen and the unfused powder were removed. Characterization and Calibration A caliper was used to measure the dimension of all the specimens. The height and width were measured after the fabrication of each specimen to corroborate that the size of the bar was correct. The thickness and the width of the specimens were calculated as the average of the measurement on two different points of the specimen after tensile testing and fracture. Three specimen replicates were used for the tensile testing using a standard axial tensile tester (Instron), with a 4,900 N load cell and a crosshead speed of 1 mm/min to fracture, to obtain the ultimate tensile strength (UTS) and the elongation at fracture. The density of the bars sintered under atmospheric conditions was then measured applying the.
(38) 26. Archimedes’ method (Roman, et al., 1985). The bars were weighted under atmospheric conditions and then submerged in water. Equation 2.4 was used to calculate the densities of the specimens 𝜌, where 𝜌H2 0 is the density of the water (1000 kg/m3), 𝑊atm the weight of the specimen on the atmosphere, and 𝑊H2 0 the weight in the water. 𝜌=. 𝑊atm 𝜌H2 0 𝑊atm − 𝑊H2 0. (2.4). The porosity of the specimens was measured from the non-tensile-tested replicates, using a 3D density and geometry phantom evaluation procedure and a MicroCT 80 (Scanco Medical). The specimens were submerged in a contrast of Dulbecco’s phosphate buffered saline solution. The porosity of one specimen (printed angle 0°, laser power 10 W, and under atmospheric conditions) was estimated, to fix the parameters of the software used on the porosity evaluation. To calculate the porosity of the reference specimen, the system of equations 2.5 through 2.7 has to be solved, where 𝜌 is the density of the specimen, 𝜌PA the density of the PA-12 (1,010 kg/m3), 𝜌Al the density of the aluminum (2,700 kg/m3), 𝜌air the density of the air (1.225 kg/m3), 𝑥 is the volumetric percent of the PA-12, 𝑦 the volumetric percent of the aluminum, 𝑧 the volumetric percent of the air of the specimen (porosity), and the weight percentage of aluminum in the material is 52% (Bassoli et al., 2012). 𝜌 = 𝑥 𝜌PA + 𝑦 𝜌Al + 𝑧 𝜌air. (2.5). 𝑥+𝑦+𝑧 =1 𝑦 𝜌Al = 0.52 𝑦 𝜌Al + 𝑥 𝜌PA. (2.6) (2.7). A scanning electron microscopy (SEM) and an energy dispersive X-ray spectroscopy (EDS) were used to analyze a virgin Alumide powder sample and imaging some of the specimens. The upper and bottom surface, and the cross section on the facture area after the tensile testing were analyzed..
(39) 27. Analysis of the Design of Experiment In order to quantify the effect of printed parameters – laser power, scanning angle, and level of oxygen – in the mechanical properties – UTS, elongation, specimen thickness, and density – an analysis of the variance (ANOVA) was performed for each response independently, using the software Minitab 17. The results were analyzed by selecting order 3 model terms with a 95% confidence interval. The ANOVA assumptions – independence of cases, homoscedasticity, and normality of the residuals – were met for all the analysis. The assumptions were checked with different residuals plots (Montgomery, 2012) and using the Anderson-Darling test to verify the normality of the residuals. Main effects plots were used to examine the effect of different independent, and interaction plots were used to visualize possible interactions. An optimized response was calculated by the software Minitab 17 maximizing the composite desirability of the responses. Individual and composite desirability were used to evaluate how well a combination of parameters satisfy a defined goal. 2.4.. Results and Discussion Tensile Testing. A total of 54 test specimens were tensile tested. The ultimate tensile strength (UTS) and the elongation at fracture were measured for each bar. The tensile bars were printed with the same fixed parameters, and the scanning direction angles, laser power and the level of oxygen were modified factors of a 32 x 2 full factorial DOE. Three replicates were tested for each combination of parameters..
(40) 28. Figure 2-4: Stress(𝜎)-strain (𝜀) curves for specimens printed at 11 W and nominal atmospheric conditions at 0º, 45º and 60º. The stress-strain curves obtained from the tensile testing have a similar shape for all the specimens. The slope of the curve decreases slowly reaching a maximum strength, then there is a decay in the strength specimens, and it fails catastrophically (elongation at fracture). Some examples of the stress-strain curves are shown in Figure 2-4. Additionally, similar behavior has been achieved on previous work using 3-D printed polylactic acid (PLA) (Kim et al., 2017), polyamide, and aluminum-filled polyamide specimens (Bassoli et al., 2012). The results for the UTS and elongation are shown in Figure 2-5, and the ANOVA test for each response is presented on Table 2-3 and Table 2-4. The results for the UTS show a statistically significant effect for the scanning angle (p-value < 0.001) and the laser power (p-value = 0.002); however, the level of oxygen inside of the chamber has no effect on the UTS values..
(41) 29. (a). (b). Figure 2-5: Ultimate tensile strength (a) and elongation (b) versus scanning direction angle. Figure 2-6a shows how increasing the scanning angle causes a considerable increase on the UTS, where the maximum value is reached using an angle of 60º. An increase of 4.6% and 31.8% on the UTS means it is achieved using 45º and 60º angles respectively, with respect to the samples printed at 0º. In the same way, an increase of the laser power also increased the results for the UTS by 6.0%. The interaction between the angle and the laser power is the most significant (p-value = 0.004) but only between 0º and 45º. The interaction between the angle and oxygen is also statistically significant (p-value = 0.039), where the highest value of UTS is reached at nominal atmospheric conditions and 11 W..
(42) 30. The rest of the interactions between the factors do not show significant effects on the response (Figure 2-6b). For the elongation all the factors show a statistically significant effect. The scanning angle is the most influential, with a p-value < 0.001. Figure 2-7 shows a big increase of the mean from 0° to 45° and then a smaller increase from 45° to 60°. Then, the oxygen level has a significant effect on the elongation of the specimen (p-value=0.002). The elongation decreases by 13.0 % between 0º and 45º but then only by 5.0 % for 60º with respect to samples printed at 0º. Elongation is also proportional to the laser power, where the average elongation increased by 7.4% from 10 to 11 W. Similar behavior can be noticed in the plots in Figure 2-5, where the maximum values are reached using a laser power of 11 W with an angle of 60º. All interactions between two factors show an influence of the elongation, where the most important is the combination of laser power and angle, and the less significant is the combination of angle and oxygen level.. (a). (b). Figure 2-6: (a) Main effect plots, and (b) interactions plots for UTS..
(43) 31. (a). (b). Figure 2-7: (a) Main effect plots, and (b) interactions plots for elongation. Table 2-3: Ultimate tensile strength ANOVA test results. Degree of freedom 13 5 2 2 1 8 4 2 2 40 53. Model terms Model Linear Angle Oxygen Laser Power 2-Way Interactions Angle * Oxygen Angle * Laser Power Oxygen * Laser Power Error Total. Adjusted sum of squares 442.659 400.65 381.109 1.953 17.588 42.008 18.779 21.109 2.12 67.404 510.063. Adjusted mean square 34.051 80.13 190.555 0.977 17.588 5.251 4.695 10.555 1.06 1.685. F-Value. P-Value. 20.21 47.55 113.08 0.58 10.44 3.12 2.79 6.26 0.63. < 0.001 < 0.001 < 0.001 0.565 0.002 0.008 0.039 0.004 0.538. S. R2. R2 (adjusted). R2 (predicted). 1.29811. 86.79%. 82.49%. 75.92%. significant significant significant significant.
(44) 32. Table 2-4: Elongation at fracture ANOVA test results. Degree of freedom 13 5 2 2 1 8 4 2 2 40 53. Model terms Model Linear Angle Oxygen Laser Power 2-Way Interactions Angle * Oxygen Angle * Laser Power Oxygen * Laser Power Error Total. Adjusted sum of squares 0.000497 0.000296 0.000167 0.000093 0.000037 0.000201 0.000068 0.000068 0.000065 0.000259 0.000756. Adjusted mean square 0.000038 0.000059 0.000083 0.000046 0.000037 0.000025 0.000017 0.000034 0.000032 0.000006. F-Value. P-Value. 5.91 9.16 12.87 7.16 5.71 3.88 2.64 5.22 5.02. < 0.001 < 0.001 < 0.001 0.002 0.022 0.002 0.048 0.01 0.011. S. R2. R2 (adjusted). R2 (predicted). 0.0025432. 65.76%. 54.63%. 37.60%. significant significant significant significant significant significant. Delay Time The delay time is defined as the time difference between any two adjacent points on successive scanning lines on a layer and depends on the scan path geometry, which can be varied by changing the scanning direction angles. Jain et al., 2009 found that delay time influences the strength of PA-12 laser sintered bars significantly. The tensile strength improves significantly when the angle increases, reaching a optimum value at 60º. This can be at attributed to thermal degradation of polyamide due to the long exposure to the laser bean. The experimental results of the present study in Figure 2-8 show a similar behavior for Alumide monolayers bars, where the maximum UTS is reached at 60º. It can be seen in Figure 2-5a that at low delay time (low angle) the part strength is smaller. Moreover, the literature has reported for different materials (Kim et al., 2017), (Sabelle et al., 2018) that the anisotropy of the specimens has an important effect on the strength and elongation of the printed parts due to the scanning processes. The strength and elongation are more likely to be lower when scanning and loading directions are perpendicular to each other..
(45) 33. The energy density (ED) is 2.56 and 2.82 J/mm2 for the bars printed at 10 and 11 W, respectively. The values of tensile strength and elongation are related to the ED of each specimen, where the highest mechanical properties are measured from the specimens with the highest ED. When the laser power increases, ED also increases, and the melt starts to flow and filling the gaps between the aluminum particles, producing a stronger cohesion between the powder particles; therefore, the mechanical properties improve (Gibson et al., 2015). Therefore, as you get a larger meltpool due to higher ED, then the oxygen plays a role in degrading the polymer, so one should see two competing forces: polymer degradation vs more molten mass to resist tensile forces. Eventually the higher amount of degradation could be offset by a larger mass of molten polymer.. Figure 2-8: UTS results versus delay time. Specimen Thickness The thickness of each specimen was measured using a caliper three times in three different parts of the bars, and the mean values were used for the analysis, additionally, three replicates were used for each group of bars. Figure 2-9 and Figure 2-10a show how the thickness does not change significantly form 0º through 45º, however, it increases using a scanning angle of 60º. Furthermore, from the ANOVA test (Table 2-5) it can be seen that the angle has a statistically significant effect on the thickness, due to the higher values at 60º. As was expected, thicker bars were printed with the higher laser power setting. A.
(46) 34. higher laser power will provide a higher amount of energy to melt and sinter the powder particles, therefore, the melting pool will be bigger, cohering deeper and adjacent particles and producing a thicker layer. Figure 2-10 shows and increase on the means of 8.9 % from 10 to 11 W and the ANOVA test confirms a significant effect for the laser power. Sabelle et al., 2018 obtained similar results for Cu-Sn-Ni alloy metallic sintered monolayers, where thicker bars were fabricated by higher laser power. The statistical analysis suggests that the oxygen level has a significant effect on the specimen thickness; however, the calculated p-value is 0.043. Bearing in mind that a factor is considered significant when the p-value is lower than 0.05 and observing the results in Figure 2-9 and Figure 2-10, the oxygen level has no significant effect in the thickness of the bars. The interaction between the angle and laser power has the most significant effect on the thickness (p-value = 0.027), where the thinner bars are fabricated by 45º at with 21% of oxygen, and the thicker specimens at 60º with both atmospheres (Figure 2-10). The scanning angle – oxygen interaction has a significant effect as well (p-value = 0.031); however, the bars printed by 11 W do not vary in thickness with the changes in the oxygen level. The interaction between the level of oxygen and laser power can be considered insignificant since the p-value is only 0.043 and the interaction plots show no large difference between the slopes.. Figure 2-9: Specimen thickness versus scanning direction angle..
Figure


+7


Documento similar