THE ATACAMA COSMOLOGY TELESCOPE: LENSING OF CMB TEMPERATURE AND POLARIZATION DERIVED FROM COSMIC INFRARED BACKGROUND CROSS CORRELATION
9
0
0
Texto completo
(2) The Astrophysical Journal, 808:7 (9pp), 2015 July 20. van Engelen et al.. constraints on the late-time relationship between luminous and dark matter and to understand the evolution of large-scale structure (e.g., Bernardeau 1997; Seljak & Zaldarriaga 1999). Measurements of the lensing of the polarized CMB have become feasible only recently (Hanson et al. 2013; Polarbear Collaboration 2014b, 2014c), and with that has emerged a clean and powerful probe of neutrino properties and dark energy. In this work, we present a detection of lensing of the CMB polarization field using data from the Atacama Cosmology Telescope Polarimeter (ACTPol) in cross-correlation with the Cosmic Infrared Background (CIB) measured using Planck/HFI (Planck hereafter). Lensing of the CMB temperature field has rapidly progressed from first detections (Smith et al. 2007; Hirata et al. 2008; Das et al. 2011; van Engelen et al. 2012) to precision measurements (Planck Collaboration 2014e). While lensing measures from the CMB alone provide direct constraints on the evolution of gravitational potentials, cross-correlations with tracers of largescale structure have the advantage of being less sensitive to systematic errors and have potentially larger detection significance. Indeed, the first detections of CMB lensing were obtained through cross-correlation with radio and optical galaxies (Smith et al. 2007; Hirata et al. 2008). These have been followed more recently by cross-correlations with infrared-selected galaxies (Bleem et al. 2012; Planck Collaboration 2014e), submillimeter-selected galaxies (Bianchini et al. 2014), quasars (Sherwin et al. 2012; Geach et al. 2013; Planck Collaboration 2014e; DiPompeo et al. 2014), gamma rays (Fornengo et al. 2015), the cosmic shear from optical galaxies (Hand et al. 2015), galaxy clusters emitting in the X-ray (Planck Collaboration 2014e) and via the Sunyaev– Zel’dovich effect (Hill & Spergel 2014), and the emission from unresolved dusty galaxies comprising the CIB (Holder et al. 2013; Hanson et al. 2013; Planck Collaboration 2014f; Polarbear Collaboration 2014b). The CIB at submillimeter and millimeter wavelengths has a flux distribution that peaks around a redshift of z ~ 1.5–2 (e.g., Addison et al. 2013; Béthermin et al. 2013; Viero et al. 2013), and has substantial overlap with the redshift distribution of CMB lensing. Recent measurements suggest that the correlation between CMB lensing and the CIB at 545 GHz is as large as 80% (Planck Collaboration 2014f). Lensing of the polarized CMB can yield measurements of the projected matter density beyond the precision possible with lensing of the CMB temperature field. This is because measurements of lensing-induced B-mode polarization are not limited by cosmic variance from primordial temperature perturbations (Hu & Okamoto 2002). In addition, some sources of bias for CMB temperature lensing such as galaxies and galaxy clusters (Osborne et al. 2014; van Engelen et al. 2014) are expected to have smaller relative signals in polarization maps (Smith et al. 2009). Detections of polarization lensing have been reported by the SPTpol (Hanson et al. 2013), POLARBEAR (Polarbear Collaboration 2014b, 2014c), Planck (Planck Collaboration 2015), and BICEP2 (BICEP2 Collaboration 2014) teams. This work presents the first measurements of polarization lensing using ACTPol, in cross-correlation with maps of the CIB from Planck. These polarization lensing measurements are obtained from a wider composite sky area (206 deg2) than previous measurements. This paper also presents both CMB temperature and polarization lensing measurements at smaller angular scales than. previously reported, allowing for novel tests of both CIB models and standard ΛCDM cosmology. In this paper we use a fiducial cosmological model based on a fit to WMAP, SPT, and ACT data (Calabrese et al. 2013). 2. DATA 2.1. CMB Data ACT is located at an altitude of 5190 m in Parque Astronómico Atacama in northern Chile. The 6 m primary mirror provides arcminute resolution at millimeter wavelengths. Its polarization-sensitive camera, ACTPol, is described by Niemack et al. (2010) and Naess et al. (2014, N14 hereafter). ACTPol observed at 146 GHz from 2013 September 11 to December 14. Observations focused on four fields near the celestial equator at right ascensions of 150°, 175°, 355°, and 35°, which we call D1 (73 deg2), D2 (70 deg2), D5 (70 deg2), and D6 (63 deg2). The scan strategy allows for each patch to be observed in a range of different parallactic angles while the telescope scans horizontally. This aids in separating instrumental from celestial polarization. The white noise map sensitivities in temperature for the patches are 16.2, 17, 13.2, and 11.2 μK arcmin, respectively, with polarization noise levels roughly 2 larger. The beam size, measured as the full-width at half-maximum, is approximately 1′. 4. The patches were observed in sequence throughout day and night, with the nighttime data fractions being 50%, 25%, 76%, and 94% for D1, D2, D5, and D6, respectively. In this analysis we use only nighttime data from D1, D5, and D6, which amounts to roughly 600 hr of observations. The maximum-likelihood maps are made with 30 arcsecond resolution. Further details about the observations and mapmaking can be found in N14. To treat point sources, we filter the D1, D5, and D6 patches with an optimal filter matched to the ACTPol beam profile, and identify point sources in the temperature with a signal five times larger than the mean background uncertainty in the filtered maps. By measuring the flux of each source, a template of beam-convolved point sources is constructed for each patch, which is then subtracted from the corresponding ACTPol patch. In this way, point sources with fluxes above 8 mJy are removed from D1, and sources with fluxes above 5 mJy are removed from D5 and D6. We also identify galaxy clusters by using a matched filter technique; for each cluster identified at signal-to-noise ratio (S/N) greater than 4 we interpolate with a disk of radius 2′. 5 (or a diameter of 5′) using the inpainting technique described by Bucher & Louis (2012). The ACTPol patches are calibrated to the Planck 143 GHz temperature map (Planck Collaboration 2014a) following the method described in Louis et al. (2014). However, the patches are then multiplied by a factor of 1.012 to correspond to the WMAP calibration as in N14. We construct an apodization window for each patch by tapering, with a cosine taper of width of 200′, the corresponding smoothed inverse variance weight map of that patch. We multiply the T, Q, and U maps of each patch by this apodization window, effectively downweighting the noisier regions of the map. We then transform the Q and U maps into E and B maps following the pure-EB transform (Smith 2006; Smith & Zaldarriaga 2007; Louis et al. 2013). The weighting and apodization leaves effective areas in the CMB maps of 43.0, 31.5, and 41.6 square degrees for D1, D5, and D6, respectively, defined as the areas that would give 2.
(3) The Astrophysical Journal, 808:7 (9pp), 2015 July 20. van Engelen et al.. where g is a filtering function that optimizes the estimator, A (l ) is a function that normalizes the estimate, and l ¢ and l are vectors in two-dimensional Fourier space. This estimator yields a convergence map derived from the X and Y fields. In this analysis, we use only CMB modes above l min = 500 and below l max = 3000 for the T, E, and B fields. The l min limit is chosen to minimize bias from Galactic dust, and to match the choice made in N14. The l max limit is chosen to maximize signal-tonoise without introducing significant bias in the cross-power spectrum from dusty galaxies correlated with the convergence field (Smith et al. 2007). We discuss the choice of l max further in Section 6. We also remove a vertical strip in twodimensional CMB Fourier space with ∣ lx ∣ < 90, and a horizontal strip with ∣ ly ∣ < 50 , as in N14. We formulate a similar estimator for a field of “curl” (L) (Cooray et al. 2003; Hirata & Seljak 2003). deflections, w These curl deflections are expected to be more than two orders of magnitude smaller than the standard gradient-like deflections. Cross-correlation of the reconstruction of this field with the CIB thus acts as an effective null test. To validate the lensing pipeline, for each ACTPol patch we construct 2048 Monte Carlo simulations of the lensed CMB at 146 GHz. To lens simulated Gaussian T, Q, and U maps by the projected matter field we follow the procedure described in Louis et al. (2014). Random realizations of the noise are then added to the lensed CMB simulations. Gaussian noise realizations are generated from a template based on the twodimensional power spectrum of the noise, obtained by splitting the observations into four parts and differencing the resulting maps. To model the correct spatial inhomogeneity of the noise level, the noise realizations are then scaled according to the number of observations in each region of the map. We use these simulations to construct a map of the windowinduced mean field for each patch (Hanson et al. 2009; Namikawa et al. 2013), which we then subtract from both simulated and data-derived reconstructed convergence maps prior to any cross-correlation. By cross-correlating the reconstructed convergence maps with the input convergence maps, we use the same simulations to obtain small l-dependent amplitude corrections due to the windowing, of <5%, for which we correct.. approximately equal errors in the estimate of the CMB power spectrum for a top-hat window (Pearson et al. 2014). 2.2. CIB Data For CIB maps, we use data obtained at 545 GHz using the Planck satellite that overlap the ACTPol D1, D5, and D6 survey regions. The Planck maps for the nominal mission were retrieved from the Planck Legacy Archive (Planck Collaboration 2014a). We clean these maps of bright point sources by masking extragalactic sources identified in the Planck point-source catalog as being above 5σ at 545 GHz. Dusty Galactic emission is also cleaned from the Planck maps by masking the maps based on HI maps obtained from the Leiden/Argonne/Bonn survey (Land & Slosar 2007). We choose an HI density threshold of 3.6 ´ 10 20 cm−2. We choose this dust threshold to reduce the dust-induced power in the maps, particularly D1, while leaving an appreciable area for cross-correlation. Specifically, this dust mask level reduces the amplitude of the autospectrum of the 545 GHz map in the D1 patch by a factor of roughly 2, while reducing the area available for cross-correlation by a factor of roughly 61%. This cut leaves effective areas in the 545 GHz maps of 29.8, 26.1, and 44.8 square degrees for D1, D5, and D6, respectively, compared with 48.6, 33.0, and 44.8 square degrees in the absence of any dust masking. We examine biases due to the dust three-point function in Section 6 for this choice of masking, finding any biases to be significantly smaller than the statistical errors in the measurement. We also deconvolve the Planck maps with a beam which we take to be a Gaussian profile with width qFWHM = 4.84 ¢ (Planck Collaboration 2014b), and apply the same apodization window that we apply to the ACTPol data. Taking into account the differing masks for the CIB and CMB, the effective areas available for lensing-CIB crosscorrelation are 26.0, 25.1, and 41.6 square degrees for D1, D5 and D6, respectively, again defined as the area that would give the same error bars for a top-hat window (Pearson et al. 2014). We have verified this by comparing our simulation-derived error bars, described below, with theoretical expectations (Knox 1995; Song et al. 2003) based on these areas. 3. LENSING AND CROSS-CORRELATION PIPELINE. 4. PREDICTED CROSS-CORRELATION. Gravitational lensing by large-scale structure deflects the paths of CMB photons by the angles given by the gradient of the projected gravitational potential (i.e., d = f where d is the deflection field and ϕ is the projected potential). This remapping of the primordial CMB correlates previously independent pairs of modes, and also converts E-modes into B-modes. This creates correlations between E- and B-modes which would otherwise be independent. The lensing of the CMB can be detected by measuring the lensing-induced correlation between modes via an optimal quadratic estimator (Bernardeau 1997; Seljak & Zaldarriaga 1999; Zaldarriaga & Seljak 1999; Hu & Okamoto 2002) for the convergence field κ given by - 12 · d . This estimator can be constructed from any pair of T, E, and B, denoted by X and Y. In the flat-sky limit, the estimator is given by kˆ XY (l ) = A XY (l ). ò. The CMB lensing convergence and the intensity of the CIB are expected to be correlated because both are tracers of the large-scale density fluctuations in the universe. We model the cross power as an integral over redshift (Song et al. 2003): ClkI =. ò dz. æ dc 1 k l W (c) W I (c) P çç k = , çè dz c 2 c. ö z÷÷÷ . ÷ø. (2). Here P (k , z ) is the matter power spectrum including the effects of nonlinear growth (Smith et al. 2003). We take the window function for the galaxies, as a function of radial comoving distance χ, to be W I (c ) = b. d 2l ¢ XY g ( l ¢, l - l ¢) X ( l ¢) Y ( l - l ¢) (1) (2p )2. dI , dc. (3). with a linear bias factor set to b = 2.2, which we assume to be independent of redshift, and with the CIB intensity distribution I (c ) at 500 μm given by Béthermin et al. (2013). The window 3.
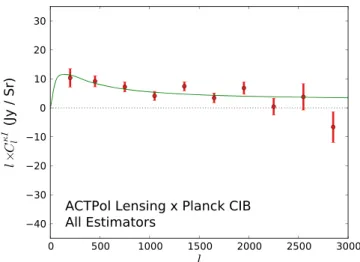
(4) The Astrophysical Journal, 808:7 (9pp), 2015 July 20. van Engelen et al.. function for CMB lensing is given by W k (c ) =. 3 c cCMB - c W m H02 , 2 a (c) cCMB. (4). where Wm and H0 are the matter density and the Hubble parameter today, a (c ) is the scale factor at comoving radial distance χ, and cCMB 13 Gpc is the comoving distance to CMB recombination. This linear bias model is an excellent match to the model that fits the recent CIB-lensing cross power measured by Planck (Planck Collaboration 2014f). The Planck best-fit curve is based on a halo model which includes both the one and twohalo terms. We note that our linear bias model, particularly the independence of the bias on redshift, is not meant to be a complete description of the CIB; it mainly serves as a simple model that matches existing data.. Figure 1. Cross-power spectrum of the reconstructed lensing convergence map from ACTPol data with a map of the CIB as measured by Planck at 545 GHz. The power spectra from the combination of the TT, TE, EE, and EB estimators have been coadded for the D1, D5, and D6 sky regions. The errors for each patch and estimator are determined from the cross power of 2048 simulated reconstructed lensing convergence maps with the appropriate Planck 545 GHz CIB map, and neighboring errors are less than 5% correlated. The detection significance of this lensing signal is 9.1s . The green curve shown is not a fit to these data, but rather to the Planck Collaboration (2014f) data. We find a best+0.12 fit amplitude of A = 1.020.08 , with a chi-square statistic of 37.2 for 29 degrees of freedom, and a probability to exceed the observed chi-square of 0.14.. 5. RESULTS We obtain estimated convergence maps for each patch using the TT, TE, EE, and EB lensing estimators, yielding 12 estimates of lensing. We also obtain an equal number of estimates of the curl deflection field for the same data. We additionally form combined estimates: a “polarization-only” combination, consisting of the EB and EE estimates combined; and an “all” combination, with all four estimates combined. To obtain these combinations, we weight by the inverse variance of each estimator. We then cross-correlate each of these reconstructed lensing and curl fields with the Planck CIB maps. We obtain bandpower covariances from the 2048 Monte Carlo simulations discussed above, which we correlate with the same Planck CIB maps. We test for convergence of the covariance matrix by using half the simulations and checking that we obtain stable results. The estimators are correlated (Hu & Okamoto 2002): the simulated maps are generated from realizations of T, E, and B including the expected amount of TE cross power, and each simulated T, Q, and U map is lensed by the same lensing field. When combining estimators, we form the same linear combination with each of the 2048 simulations that we form with the data. The inter-band covariance matrix which we obtain for each of these combinations thus includes all expected sources of correlation. In Figure 1, we show the result for the “all” combination of estimators, with error bars representing the on-diagonal part of the corresponding covariance matrix. Neighboring bins are correlated by roughly 2%–5%. We fit to the model described in Section 4 with a free overall amplitude, A. We find a best-fit +0.12 amplitude of A = 1.020.08 , corresponding to a detection S/N. We run the same pipeline for the curl reconstructions. As shown in Table 2 and Figure 4, the curl estimates are consistent with null. In Table 2, we quote amplitudes relative to the usual scalar lensing curve. 6. SYSTEMATIC ERROR TESTS The statistical uncertainties on our results for the crosscorrelation amplitude are approximately 10% for the TT estimator and 30% for the EB estimator; we will show here that no known sources of systematic uncertainty are comparable in size. Possible instrumental systematics include calibration and beam uncertainty. The largest known beam uncertainty is the overall (monopole) beam profile, for both the ACTPol and Planck surveys. For ACTPol, we estimate the effect of the beam and calibration errors together on the lensing reconstruction by computing effective error bands as functions of CMB multipoles, as described in N14. This yields an effective error band across the CMB power spectrum of about 3%. We then perform reconstruction on the temperature maps, scaling the maps in the Fourier domain by +1 and −1σ. This yields an offset of approximately ±4% in the best-fit cross-correlation amplitude for D6. We thus assign a systematic uncertainty of 4% to our final result. The Planck fractional map-level beam error has amplitude 0.3% to l = 3000 (Planck Collaboration 2014b), and is thus negligible for this analysis. Leakage from temperature to polarization could potentially affect our polarized lensing signal. To estimate the effect, we simulate leakage by adding 1% of the temperature map to Q and U, as well as 10% of Q to U (and vice versa). We then propagate these new maps through the lensing estimator and cross-correlate them with simulated, correlated CIB maps. We find only a small contamination, of order 2% of the signal amplitude for all the polarized lensing channels. This is consistent with previous results (Polarbear Collaboration. 2 2 corresponds to the value (cnull - cbf2 ) = 9.1. Here, cnull 2 2 of c for A = 0, cbf is the value for the best-fit point at which the c 2 is minimized, and we have summed the c 2 (A) curves over the three patches. These results, together with those for each estimator and patch separately, are summarized in Table 1. We show the co-added cross power derived from the EE and EB estimators combined in Figure 2. Here the lensing of the CMB polarization is detected at S/N of 4.5. The cross power derived from the EB estimator alone is shown in Figure 3. This yields a detection of B-mode polarization from lensing at a S/N of 3.2.. of. 4.
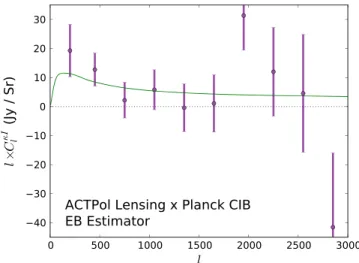
(5) The Astrophysical Journal, 808:7 (9pp), 2015 July 20. van Engelen et al.. Figure 2. Same as Figure 1, using only the EE and EB lensing estimators. Measurements from the D1, D5, and D6 patches are combined here as well. The polarization lensing signal is detected at a significance of 4.5s . Here we +0.28 find a best-fit amplitude of A = 1.260.24 , with a chi-square statistic of 30.4 for 29 degrees of freedom, and a probability to exceed the observed chi-square of 0.39.. Figure 3. Same as Figure 2, using only the EB lensing estimator. The B-mode lensing signal is detected at a significance of 3.2s . Here we find a best-fit amplitude of A = 1.30 0.40 , with a chi-square statistic of 25.9 for 29 degrees of freedom and a probability to exceed the observed chi-square of 0.63.. Table 1 Fits and c 2 Values For The Lensing Convergence Field. Table 2 Fits and c 2 Values For The Lensing Curl Field. Estimator and Patch. S/N. A. cbf2 (ν). Estimator and Patch. PTE. cbf2 (ν). PTE. −0.14±0.24 +0.16 0.020.12. 17.2 (9) 6.7 (9) 8.8 (9). 0.05 0.67 0.46. A. TT, D1 TT, D5 TT, D6. 2.4 3.3 7.2. 0.90±0.36 +0.24 0.820.20 1.06±0.12. 9.6 (9) 11.5 (9) 13.7 (9). 0.39 0.24 0.13. TT, D1 TT, D5 TT, D6. S N 0.0 0.5 0.2. TE, D1 TE, D5 TE, D6. 1.5 0.2 2.0. 2.10±1.40 +0.80 0.220.84 0.90±0.44. 4.6 (9) 13.5 (9) 4.1 (9). 0.87 0.14 0.91. TE, D1 TE, D5 TE, D6. 1.1 0.2 1.1. −1.46±1.32 0.18±0.80 +0.40 −0.500.44. 11.9 (9) 5.7 (9) 5.6 (9). 0.22 0.77 0.78. EE, D1 EE, D5 EE, D6. 1.3 0.5 4.0. +1.60 −2.141.56 0.46±0.88 +0.44 1.740.40. 4.3 (9) 5.2 (9) 11.5 (9). 0.89 0.82 0.24. EE, D1 EE, D5 EE, D6. 0.1 0.5 1.6. +1.96 0.261.92 +1.04 0.54-1.00 +0.48 −0.780.52. 3.9 (9) 7.2 (9) 11.5 (9). 0.92 0.62 0.24. EB, D1 EB, D5 EB, D6. 0.1 1.3 2.9. +1.92 0.261.88 +0.88 1.26-0.92 +0.44 1.380.48. 9.8 (9) 3.8 (9) 12.0 (9). 0.37 0.92 0.21. EB, D1 EB, D5 EB, D6. 1.9 1.1 0.1. 2.26±1.16 0.66±0.56 +0.28 0.020.24. 10.9 (9) 5.5 (9) 17.3 (9). 0.28 0.79 0.04. EB, all. 3.2. 1.30±0.40. 25.9 (29). 0.63. EB, all. 1.0. +0.24 0.220.20. 37.8 (29). 0.13. Pol. estimators, all. 4.5. +0.28 1.260.24. 30.4 (29). 0.39. Pol. estimators, all. 0.5. 0.10±0.20. 32.7 (29). 0.29. All estimators, all. 9.1. +0.12 1.020.08. 37.2 (29). 0.14. All estimators, all. 0.1. +0.08 0.020.12. 36.3 (29). 0.16. Note. Fit results for the cross power between the lensing field from ACTPol maps and Planck maps at 545 GHz, for each field and estimator. The first column shows the S/N calculated using the method described in the text. The second shows the best-fit amplitude A, and associated uncertainty, relative to the model which fits the Planck data. The third column shows the values of c 2 at this best-fit point and the number of degrees of freedom. The fourth shows the probability to exceed the given value of c 2 . The rows marked “all” are obtained by adding the c 2 functions and performing new fits for A.. +0.36 0.020.40. Note. Null check for the cross power between the curl lensing field obtained from ACTPol maps and Planck maps at 545 GHz, for each field and estimator. Columns are as in Table 1, where quantities are quoted relative to the same (scalar) model.. in simulated maps and propagating the maps through our lensing reconstruction and cross-correlation pipeline, we find a change of only 2% in the cross-correlation signal measured. Given that our bound on the angle error is 0 ◦. 5 from measurements of null cross power (N14), we conclude that this source of error is negligible for our purposes. We now turn to estimates of astrophysical systematic errors. An important source of possible systematic contamination is. 2014b), where the effect of leakage was shown analytically to be zero in the EB channel, and the effects of leakage in other channels were found to be subdominant. Errors in the polarization angles might have an impact on the measurement. Performing a 1° rotation of the polarization angle 5.
(6) The Astrophysical Journal, 808:7 (9pp), 2015 July 20. van Engelen et al.. cross-correlating the result with the unscaled 545 GHz map from our nominal analysis. This approach is valid because other cross-terms in the three-point function are proportional to a single factor of the primordial (unlensed) CMB field and hence are zero on average. For D6, the cleanest patch, the shift is <1%; for D5 it is 8%; and for D1, the dustiest patch, the shift is 40%. Since a CIB bias should be uniform across fields, whereas dust is much less isotropic, we attribute this to the higher dust levels in D1 compared to the other fields, rather than to the CIB bispectrum. A similar argument was presented by the Planck Collaboration (2014f). We conclude that the clustered CIB bispectrum should be negligible for our analysis. To estimate the impact of Galactic dust, we use two templates: the high-frequency, beam-deconvolved Planck maps, as well as the maps of Finkbeiner et al. (1999). We again scale the maps from 545 to 146 GHz, but here we assume a dust spectral index of α = 3.18 (Planck Collaboration 2014h), as we have argued that the CIB portion of these maps does not cause a bias. We assume a polarization fraction of 20%, commensurate with some of the most polarized regions of the mm-wave sky at high Galactic latitude. We thus set Q = 0.2T545 and U = 0, where T545 is the rescaled Planck map. The resulting shifts for the TT estimator are 12% for D1, 4% for D5, and <1% for D6. The total shift in the TT estimators, using our weighting, is 4%. The polarized estimators show small biases, of 8% for the EB estimator (compared with a 30% statistical error bar), and <1% for the TE and EE estimators. Using the Finkbeiner et al. (1999) maps, and the same treatment for polarization, we find a ∼3% bias for the EB estimator in D1, and 1% for the other fields and estimators, including TT. This difference may be due to the lower angular resolution of the Finkbeiner et al. maps. Given the difference between these two results, we assign a systematic uncertainty on our measurement due to dust contamination of 4%. We add this in quadrature to the beam and calibration uncertainty, yielding a 6% systematic uncertainty.. Figure 4. Cross-power spectra between estimates of the curl deflection field and the CIB. Estimator combinations are the same as in Figures 1–3. All are consistent with null.. flux from dusty sources in the CMB maps, which propagates through the lensing estimator and forms a non-zero bispectrum when the lensing estimator is correlated with the Planck maps. This signal is proportional to the áI150 (l1 ) I150 (l2 ) I545 (l3 ) ñ threepoint function for three multipole vectors l1, l2 , and l3. For spatially uncorrelated sources, the associated bispectrum is constant in l and is small (<1%) with the point-source flux threshold we have applied (Planck Collaboration 2014f; van Engelen et al. 2014). The clustered CIB bispectrum can also give spurious lensing signals (Planck Collaboration 2014f). The first detections of clustering in the CIB bispectrum have recently been made (Planck Collaboration 2014g; Crawford et al. 2014), and simulations give varying levels of clustered bispectra (e.g., van Engelen et al. 2014). A bias term arising from a three-point function of the form ák (l1 ) I (l2 ) I (l3 ) ñ was shown by van Engelen et al. (2014) and Osborne et al. (2014) to affect crosscorrelation analyses at the level of a few percent. Preliminary analysis of the full CIB bispectrum using the simulations analyzed by van Engelen et al. (2014), including those of Sehgal et al. (2010), appears to yield large biases (tens of percents), depending on the bispectrum level, the flux threshold, the masking method, and the maximal CMB multipole l max . Given the dependence of this signal on these variables, and the uncertainties of CIB modeling, we take an empirical approach in determining this source of bias for our measurement. Given that extragalactic foreground biases arise from structure in the CMB maps at high l, we rerun our entire analysis with l max = 2000 . We find that the best-fit crosscorrelation amplitude for all estimators combined shifts to +0.16 A = 1.260.20 . Conversely, setting l max = 4000 leads to a bestfit amplitude of A = 0.94 0.08. While we note the trend that A shifts down as l max increases, given our current errors we cannot claim direct evidence of a foreground bias. To further investigate the potential bias from CIB, including clustering, we construct an estimate of the CIB at 146 GHz by scaling down the beam-deconvolved 545 GHz Planck map assuming a spectral index of α = 2.75 (Gispert et al. 2000). We then calculate the expected bias by first performing lens reconstruction on this map using the TT estimator, and then. 7. CONSISTENCY WITH OTHER SURVEYS The cross-power spectrum between the CIB and CMB lensing has now been measured by several groups. In Figure 5 we include results from the Planck lensing reconstruction cross-correlated with the Planck maps at 545 GHz (Planck Collaboration 2014f), an SPT temperature-based lensing map cross-correlated with a Herschel-SPIRE (Herschel hereafter) map at 500 μm (Holder et al. 2013), an SPTpol polarizationbased lensing map cross-correlated with Herschel at 500 μm (Hanson et al. 2013), and the POLARBEAR polarization-based lensing maps cross-correlated with Herschel at 500 μm (Polarbear Collaboration 2014b). To estimate the consistency of the data, we fit the bandpowers of the four data sets that have a detection significance greater than 5σ to the model curve considered in this paper, which is an excellent fit to the Planck bandpowers. We scale all Herschel-SPIRE 500 μm (600 GHz) results down by a color-correction factor of 1.11 (Gispert et al. 2000; Planck Collaboration 2014g) for comparison with Planck results at 545 GHz. We assume a simple c 2 likelihood, and do not include any correlations between bands. We do not include calibration errors for Herschel 500 μm or Planck 545 GHz data as the relative calibration between these maps was shown to be within 3% (Planck Collaboration 2014c). The results are shown in Figure 6. Using this color-correction factor (as 6.
(7) The Astrophysical Journal, 808:7 (9pp), 2015 July 20. van Engelen et al.. Figure 5. Comparison with other surveys. The left panel shows the temperature bandpowers from this work (red) together with those from the Planck lensing reconstruction cross-correlated with the Planck CIB maps at 545 GHz (purple), and the SPT lensing maps correlated with flux maps from Herschel at 500 μm (blue). The right panel shows polarization results, with the results from this work (red), the POLARBEAR Collaboration (2014b, blue; with EE and EB estimators combined), and Hanson et al. (2013, orange; SPTpol, EB only). All Herschel results have been color-corrected by a factor of 1.11 to compare them to Planck CIB results which are at a different frequency. The green solid curve is as in Figures 1–3. The dotted green curve shows the prediction using the linear matter power spectrum.. opposed to the factor 1.22 used by Hanson et al. 2013), the surveys are generally consistent; the SPT result is in mild tension with the Planck result at the ∼2σ level. The best-fit amplitude found in this work is broadly consistent with all the surveys. 8. EFFECTIVE ACTPOL B-MODE LEVEL The measurements of ClkI shown in Figures 1 through 4 represent one way of showing the lens-induced three-point function between measured CMB E-modes, CMB B-modes, and the CIB intensity field. Since the fluctuation amplitudes of both the CMB E-modes and the CIB intensity field are already well measured, specifically to amplitudes of 2.6% (N14) and 0.5% (Planck Collaboration 2014g) respectively, a detection of the cross-correlation using the EB estimator can be cast as a detection of lens-induced B-modes. Indeed, Hanson et al. (2013) interpreted their measurement of this bispectrum as the first evidence for B-modes induced by lensing (Smith et al. 2007). Our EB lensing estimator shows B-mode lensing at a significance of 3.2s . This result is shown, together with other recent measures of the B-mode power spectrum, in Figure 7. We have treated the ACTPol measurement as a single effective bandpower in the B-mode power spectrum with amplitude relative to fiducial of A = 1.30 0.40 . We place this single effective bandpower at l = 1000, near the center of the distribution for lensing information with the EB lensing estimator (Pearson et al. 2014).. Figure 6. Amplitude comparison of cross-correlation of CMB lensing with CIB emission at 545 GHz (Planck) and 500 μm (600 GHz; Herschel) from different experiments. Shown are fits to bandpowers from Figure 5. We only treat statistical uncertainties in this plot. All Herschel results have been scaled downwards by a factor of 1.11.. comprising the CIB. Using the first 600 hr of data from the ACTPol survey, we have demonstrated lensing of the CMB polarization at 4.5s , and a 9.1s detection including the temperature data. Lensing cross-correlations are thus emerging as strong probes of the manner in which galaxies trace mass in the Universe. The CIB is also promising as a proxy for the lensing field for the purpose of removing the lens-induced Bmodes in searches for primordial gravitational waves (Simard et al. 2014). The second season of the ACTPol survey has recently been completed, using an upgraded receiver. As more CMB. 9. SUMMARY We have presented the first large-scale lensing results from ACTPol, a polarization-sensitive camera on the ACT telescope, using the cross-correlation between the lensing field and another tracer of large-scale structure, the unresolved galaxies 7.
(8) The Astrophysical Journal, 808:7 (9pp), 2015 July 20. van Engelen et al.. Computations were performed on the GPC supercomputer at the SciNet HPC Consortium. SciNet is funded by the CFI under the auspices of Compute Canada, the Government of Ontario, the Ontario Research Fund—Research Excellence; and the University of Toronto.. REFERENCES Addison, G. E., Dunkley, J., & Bond, J. R. 2013, MNRAS, 436, 1896 Barkats, D., Aikin, R., Bischo, C., et al. 2014, ApJ, 783, 67 Bernardeau, F. 1997, A&A, 324, 15 Béthermin, M., Wang, L., Doré, O., et al. 2013, A&A, 557, A66 Bianchini, F., Bielewicz, P., Lapi, A., et al. 2014, arXiv:1410.4502 BICEP2 Collaboration 2014, PhRvL, 112, 241101 BICEP2, Keck, & Planck Collaboration 2015, PhRvL, 114, 101301 Bleem, L. E., van Engelen, A., Holder, G. P., et al. 2012, ApJL, 753, L9 Bucher, M., & Louis, T. 2012, MNRAS, 424, 1694 Calabrese, E., Hlozek, R. A., Battaglia, N., et al. 2013, PhRvD, 87, 103012 Cooray, A., Melchiorri, A., & Silk, J. 2003, PhLB, 554, 1 Crawford, T. M., Schaffer, K. K., Bhattacharya, S., et al. 2014, ApJ, 784, 143 Crites, A. T., Henning, J. W., Ade, P. A. R., et al. 2015, ApJ, 805, 36 Das, S., Marriage, T. A., Ade, P. A. R., et al. 2011, ApJ, 729, 62 Das, S., Louis, T., Nolta, M. R., et al. 2014, JCAP, 4, 14 DiPompeo, M. A., Myers, A. D., Hickox, R. C., et al. 2014, MNRAS, 446, 3492 Finkbeiner, D. P., Davis, M., & Schlegel, D. J. 1999, ApJ, 524, 867 Fornengo, N., Perotto, L., Regis, M., & Camera, S. 2015, ApJL, 802, L1 Geach, J. E., Hickox, R. C., Bleem, L. E., et al. 2013, ApJL, 776, L41 Gispert, R., Lagache, G., & Puget, J. L. 2000, A&A, 360, 1 Hand, N., Leauthaud, A., Das, S., et al. 2015, PhRvD, 91, 062001 Hanson, D., Rocha, G., & Górski, K. 2009, MNRAS, 400, 2169 Hanson, D., Hoover, S., Crites, A., et al. 2013, PhRvL, 111, 141301 Hill, J. C., & Spergel, D. N. 2014, JCAP, 2, 30 Hinshaw, G., Larson, D., Komatsu, E., et al. 2013, ApJS, 208, 19 Hirata, C. M., Ho, S., Padmanabhan, N., Seljak, U., & Bahcall, N. A. 2008, PhRvD, 78, 043520 Hirata, C. M., & Seljak, U. 2003, PhRvD, 68, 083002 Holder, G. P., Viero, M. P., Zahn, O., et al. 2013, ApJL, 771, L16 Hu, W., & Okamoto, T. 2002, ApJ, 574, 566 Keisler, R., Hoover, S., Harrington, N., et al. 2015, arXiv:1503.02315 Knox, L. 1995, PhRvD, 52, 4307 Land, K., & Slosar, A. 2007, PhRvD, 76, 087301 Louis, T., Næss, S., Das, S., Dunkley, J., & Sherwin, B. 2013, MNRAS, 435, 2040 Louis, T., Addison, G. E., Hasselfield, M., et al. 2014, JCAP, 7, 16 Naess, S., Hasselfield, M., & McMahon, J. 2014, JCAP, 10, 7 Namikawa, T., Hanson, D., & Takahashi, R. 2013, MNRAS, 431, 609 Niemack, M. D., Ade, P. A. R., Aguirre, J., et al. 2010, Proc. SPIE, 7741, 77411S Osborne, S. J., Hanson, D., & Doré, O. 2014, JCAP, 3, 24 Pearson, R., Sherwin, B., & Lewis, A. 2014, PhRvD, 90, 023539 Planck Collaboration, 2014a, A&A, 571, A1 Planck Collaboration, 2014b, A&A, 571, A7 Planck Collaboration, 2014c, A&A, 571, A8 Planck Collaboration, 2014d, A&A, 571, A16 Planck Collaboration, 2014e, A&A, 571, A17 Planck Collaboration, 2014f, A&A, 571, A18 Planck Collaboration, 2014g, A&A, 571, A30 Planck Collaboration, 2014h, A&A, 571, A11 Planck Collaboration, 2015, arXiv:1502.01591 Polarbear Collaboration, 2014a, ApJ, 794, 171 Polarbear Collaboration, 2014b, PhRvL, 112, 131302 Polarbear Collaboration, 2014c, PhRvL, 113, 021301 QUaD Collaboration 2009, ApJ, 705, 978 QUIET Collaboration 2012, ApJ, 760, 145 Sehgal, N., Bode, P., Das, S., et al. 2010, ApJ, 709, 920 Seljak, U., & Zaldarriaga, M. 1999, PhRvL, 82, 2636 Sherwin, B. D., Das, S., Hajian, A., et al. 2012, PhRvD, 86, 083006 Simard, G., Hanson, D., & Holder, G. 2014, arXiv:1410.0691 Smith, K. M. 2006, PhRvD, 74, 083002 Smith, K. M., Zahn, O., & Doré, O. 2007, PhRvD, 76, 043510 Smith, K. M., & Zaldarriaga, M. 2007, PhRvD, 76, 043001. Figure 7. Recent measures of B-mode power at 150 GHz. The solid green curve is the expectation for lens-induced B-modes. Shown are direct measures of the B-mode power spectrum ClBB , including those by the POLARBEAR Collaboration (2014a, orange stars), SPTpol collaboration (Keisler et al. 2015, light blue diamonds), and the joint work between the BICEP2/Keck and the Planck collaborations (2015, dark brown triangles). For the latter, we show the linear combination of the BICEP2/Keck auto-spectra at 150 GHz and the crossspectra between the BICEP2 and Planck 353 GHz data, scaled to 150 GHz assuming a dust-like spectrum (the dark blue points of Figure 12 in BICEP2/ Keck & the Planck Collaborations 2015). Also shown are indirect B-mode measures obtained from the amplitude of B-modes arising from the CMB lensing-CIB correlation, including results from SPTpol (Hanson et al. 2013, blue squares) and this work (red circle). The orange circle is a similar result using lensing autospectra from B-mode estimates, from Polarbear Collaboration (2013). Arrows indicate 2σ upper limits on negative points. The ACTpol point reflects the measured amplitude A = 1.30 0.40 relative to the fiducial model. We also note that measurements of the lensing power spectrum from the EB estimator have recently been presented by the SPTpol team (Story et al. 2014) and by the Planck team (Planck Collaboration 2015).. polarization data are obtained in the near future, lensing of the CMB polarization will become a powerful probe of precision cosmology. We thank Duncan Hanson for discussion and clarification regarding Section 7. We additionally thank Olivier Doré, Gil Holder, Guilaine Lagache, and Marco Viero for useful correspondence. This work was supported by the U.S. National Science Foundation through awards AST-0408698 and AST0965625 for the ACT project, as well as awards PHY-0855887 and PHY-1214379. Funding was also provided by Princeton University, the University of Pennsylvania, Cornell University, the University of Michigan, and a Canada Foundation for Innovation (CFI) award to U.B.C. A.K. is supported by NSF grant AST-13122380. We gratefully acknowledge support from the Misrahi and Wilkinson research funds. We acknowledge Oxford ERC grant 259505. The development of detectors and lenses was supported by NASA grants NNX13AE56G and NNX14AB58G. We also acknowledge support from CONICYT grants QUIMAL-120001 and FONDECYT-1141113. ACT operates in the Parque Astronómico Atacama in northern Chile under the auspices of the Comisión Nacional de Investigación Científica y Tecnológica de Chile (CONICYT). 8.
(9) The Astrophysical Journal, 808:7 (9pp), 2015 July 20. van Engelen et al.. Smith, K. M., Cooray, A., Das, S., et al. 2009, in AIP Conf. Ser. 1141, Gravitational Lensing, ed. S. Dodelson, D. Baumann, A. Cooray et al. (New York, NY: AIP), 121 Smith, R. E., Peacock, J. A., Jenkins, A., et al. 2003, MNRAS, 341, 1311 Song, Y.-S., Cooray, A., Knox, L., & Zaldarriaga, M. 2003, ApJ, 590, 664 Spergel, D. N., Verde, L., Peiris, H. V., et al. 2003, ApJS, 148, 175. Story, K. T., Hanson, D., Ade, P. A. R., et al. 2014, arXiv:1412.4760 Story, K. T., Reichardt, C. L., Hou, Z., et al. 2013, ApJ, 779, 86 van Engelen, A., Bhattacharya, S., Sehgal, N., et al. 2014, ApJ, 786, 13 van Engelen, A., Keisler, R., Zahn, O., et al. 2012, ApJ, 756, 142 Viero, M. P., Moncelsi, L., Quadri, R. F., et al. 2013, ApJ, 779, 32 Zaldarriaga, M., & Seljak, U. 1999, PhRvD, 59, 123507. 9.
(10)
Figure


Documento similar