Understanding performance of concrete using natural pozzolans against corrosion
168
0
0
Texto completo
(2) PONTIFICIA UNIVERSIDAD CATOLICA DE CHILE ESCUELA DE INGENIERIA. IMPROVING PERFORMACE OF CONCRETE USING NATURAL POZZOLANS AGAINST CORROSION. FERNANDO JAVIER BUSTOS RODRÍGUEZ. Members of the Committee: MAURICIO LOPEZ C. CARLOS VIDELA C. PATRICIA MARTÍNEZ H. RAFAEL RIDELL C.. Thesis submitted to the Office of Research and Graduate Studies in partial fulfillment of the requirements for the Degree of Master of Science in Engineering Santiago de Chile, October, 2011.
(3) A mis Padres, hermana, familiares y amigos, que nunca han dejado de apoyarme.. ii.
(4) ACKNOWLEDGEMENTS. I would like to thank my advisor, Mauricio Lopez C., for the opportunity of being part of his research group, for his guidance and advices. The support he gives me all this two years was completely un-conditional and very important to inspiration needed to achieve a serious research. I think that the disposition and availability to his students, even when his time was very limited, shows to compromise and dedication to teaching. I would also like to think all FONDEF D07I1076 participants who where indispensable to conduct this part of the research in good terms, especially to Carlos Videla and Patricia Martínez for their advices outside the project. Members of Mauricio Lopez research group and other students involve in this research area where also important and I can not be without thanks them: Álvaro Paul, Ariela Astorga, Daniel Moreno, Ricardo Serpell, Franco Zunino, Claudia Stuckrath, Gastón Espinoza, Juan Pablo Cancino and Eugenia Carrillo. The work would not be possible without the people who helped me in take most of measurements. Mauricio Guerra from ICC laboratory and all the people from RESMAT concrete and cement area, especially Claudio Valdés. I also wish to thank the financial and logistic support given by FONDEF, ICH and University of Valparaiso. Finally, all of this could not be possible without the continuous support given by my family and all my closest friends who never had a doubt on me. All of them were the main part of this travel, specially my mother and father who are the best example to me of hard work and perseverance and always pushing me to be a better person.. iii.
(5) TABLE OF CONTENTS Pág. DEDICATION ............................................................................................................. ii ACKNOWLEDGEMENTS ........................................................................................ iii LIST OF TABLES ..................................................................................................... vii LIST OF FIGURES ................................................................................................... viii RESUMEN ................................................................................................................... x ABSTRACT ................................................................................................................ xi 1.. INTRODUCTION .............................................................................................. 1 1.1. Reinforced concrete durability context and relevance ............................... 1 1.2. Concrete Pathologies .................................................................................. 4 1.2.1. Alkali-silica reaction ........................................................................ 4 1.2.2. Freeze/thaws cycles ......................................................................... 5 1.2.3. Sulfate attack .................................................................................... 6 1.3. Reinforcement Corrosion ........................................................................... 6 1.3.1. Carbonation ...................................................................................... 8 1.3.2. Chloride ingress ............................................................................. 10 1.4. Factors controlling durability ................................................................... 12 1.4.1. Pore structure ................................................................................. 12 1.4.2. Permeability ................................................................................... 13 1.4.3. Transport mechanisms ................................................................... 15 1.4.4. Environmental aggressiveness ....................................................... 16 1.5. Supplementary cementitious materials..................................................... 17 1.6. Context in Chile ....................................................................................... 18. 2.. RESEARCH CONTEXT .................................................................................. 19 2.1. Hypothesis ................................................................................................ 19 2.2. Objectives ................................................................................................. 19 2.3. Experimental methodology ...................................................................... 20. 3.. PERFORMANCE EVALUATION OF EXISTING STRUCTURES .............. 22 3.1. Structures selection .................................................................................. 22 3.2. Reinforced concrete structures characterization ...................................... 23.
(6) 3.3. Compressive Strength .............................................................................. 29 3.4. Durability Assessment.............................................................................. 29 3.5. Deterioration Assessment ......................................................................... 32 3.6. Carbonation effect in permeability of concrete ........................................ 34 4.. LONG-TERM MONITORING ........................................................................ 39 4.1. Walls scheme............................................................................................ 39 4.2. Materials and Mixtures............................................................................. 40 4.3. Cementitious materials ............................................................................. 41 4.4. Results summary and analysis.................................................................. 42. 5.. REDUCING. CONCRETE. PERMEABILITY. BY. USING. NATURAL. POZZOLANS AND REDUCING AGGREGATE-TO-PASTE RATIO ......... 45 5.1. Abstract .................................................................................................... 45 5.2. Introduction ................................................................................................ 46 5.2.1. Relevance of Durability ................................................................. 46 5.2.2 Supplementary Cementing Materials (SCM) in durability of concrete 47 5.2.3 Factors affecting permeability ......................................................... 48 5.3. Research Significance ................................................................................ 50 5.4. Experimental Method ................................................................................ 50 5.4.1. Materials and Mixtures................................................................... 51 5.4.2 Test Methods ................................................................................... 52 5.5. Results and Discussion .............................................................................. 55 5.5.1. Cementitious materials ................................................................... 56 5.5.2. Concrete mixtures .......................................................................... 57 5.5.3. Effect of natural pozzolans ............................................................. 59 5.5.4. Effect of ITZ................................................................................... 63 5.5. Concluding Remarks.................................................................................. 71 5.6 Acknowledgements ..................................................................................... 72 6.. CONCLUSIONS .............................................................................................. 72. REFERENCES ........................................................................................................... 76 APPENDICES ............................................................................................................ 79 APPENDIX A: STRUCTURE TESTING ................................................................. 80 APPENDIX B: MONITORING STATIONS .......................................................... 124.
(7) APPENDIX C: MATERIALS AND DOSE SELECTION ..................................... 133 APPENDIX D: JORNADAS CHILENAS DEL HORMIGON PAPER ................. 138.
(8) LIST OF TABLES Pág. Table 1: Selected structures............................................................................................ 20 Table 2: Methods of assessment used ............................................................................ 23 Table 3: Deterioration assessment results ...................................................................... 33 Table 4: Permeability results with and without carbonation .......................................... 37 Table 5: Concrete mixtures design (amounts in kg per cubic meter of concrete) .......... 40 Table 6: Cement characterization ................................................................................... 41 Table 7: Walls measurement at 28 and 90 days ............................................................. 42 Table 8: Corrosion potential at different covers............................................................. 44 Table 9: Concretes mixture design (amounts in kg per cubic meter of concrete).......... 51 Table 10: Cements characterization ............................................................................... 56 Table 11: Chemical composition of natural pozzolans (Espinoza, Paul & Lopez, 2010) ........................................................................................................................................ 57 Table 12: Mechanical properties of mixtures under investigation ................................. 57 Table 13: Durability properties of mixtures under investigation ................................... 58 Table 14: Standard deviation of air permeability ........................................................... 62 Table 15: Aggregate surface density .............................................................................. 64 Table 16: Standard deviation of compressive strength .................................................. 66 Table 17: Standard deviation of sorptivity ..................................................................... 67 Table 18: Standard deviation of air permeability ........................................................... 69 Table 19: Standard deviation of chloride ion permeability ............................................ 70. vii.
(9) LIST OF FIGURES Pág. Figure 1: Relationship between concrete performance and service life (CEB, 1997) .... 2 Figure 2: Relationship between durability and performance (CEB, 1997) ...................... 3 Figure 3: Effect of Alkali-Silica reaction (CEB, 1997) ................................................... 5 Figure 4: Freeze/thaw effect (CEB, 1997) ....................................................................... 6 Figure 5: Reinforced concrete column showing delamination due reinforcement corrosion ........................................................................................................................... 8 Figure 6: Carbonated front in concrete (Richardson, 2004)............................................. 9 Figure 7: Corrosion in chloride environment ................................................................. 11 Figure 8: Pore types (Richardson, 2004) ........................................................................ 12 Figure 9: ITZ representation .......................................................................................... 14 Figure 10: Diffusion principle ........................................................................................ 16 Figure 11: Experimental methodology........................................................................... 22 Figure 12: Concrete simple with phenolphthalein ......................................................... 25 Figure 13: GeCor 8 equipment ....................................................................................... 26 Figure 14: Air permeability testing principle ................................................................. 27 Figure 15: Permea-Torr equipment ................................................................................ 27 Figure 16: Sorptivity test ................................................................................................ 28 Figure 17: Structures compressive strength ................................................................... 29 Figure 18: Air permeability (log scale) vs. years of exposure ....................................... 30 Figure 19: Chloride ion permeability vs. years of exposure .......................................... 31 Figure 20: Sorptivity vs. years of exposure.................................................................... 32 Figure 21: Examples of corrosion potential maps .......................................................... 34 Figure 22: Air permeability (log scale) vs. carbonation................................................. 35 Figure 23: Sorptivity vs. carbonation ............................................................................. 36 Figure 24: Chloride ion permeability vs. carbonation.................................................... 37 Figure 25: Carbonation effect in chloride ion permeability and sorptivity .................... 38 Figure 26: Wall elevation and measurement plan .......................................................... 39 Figure 27: Walls position in field ................................................................................... 40 Figure 28: Schematic of sorptivity test .......................................................................... 53 Figure 29: Schematic of air permeability test ................................................................ 54 viii.
(10) Figure 30: Schematic of chloride ion permeability test ................................................. 55 Figure 31: Strength gain of C1, C2, C3 and C4 concrete mixtres.................................. 59 Figure 32: Sorptivity change in time of C1 and C2 concrete mixture normalized by paste content volume ...................................................................................................... 61 Figure 33: Air permeability change in time of C1 and C2 concrete mixture ................. 62 Figure 34: Micrographs from C2, C3 and C4 concrete mixtures ................................... 64 Figure 35: Comparison between spherical approximation and stereology .................... 65 Figure 36: Compressive strength vs. surface density of aggregate (Sv) ........................ 66 Figure 37: Sorptivity vs. surface density of aggregate (Sv) ........................................... 67 Figure 38: Air permeability (log scale) vs. surface density of aggregate (Sv)............... 68 Figure 39: Chloride ion permeability vs. surface density of aggregate (Sv).................. 69 Figure 40: Effect of the use of natural pozzolans and change in amount of ITZ in compressive strength ...................................................................................................... 70 Figure 41: Effect of the use of natural pozzolans and change in amount of ITZ in sorptivity......................................................................................................................... 71 Figure 42: Effect of the use of natural pozzolans and change in amount of ITZ in air permeability.................................................................................................................... 72 Figure 43: Compressive strength vs. air permeability (log scale) .................................. 73. ix.
(11) RESUMEN. Estructuras de hormigón armado durables pueden hacer una contribución a la sustentabilidad al evitar la pérdida de recursos innecesariamente. La corrosión de las barras de acero embebidas en el hormigón es una de las principales preocupaciones e implica el ingreso de diferentes elementos que pueden iniciarla. Esto hace que la permeabilidad del recubrimiento sea la propiedad de interés y un completo entendimiento de ella es necesario. Para entender el desempeño de estructuras de hormigón armado en términos de su durabilidad se midió la resistencia a compresión, permeabilidad al aire, absorción capilar, permeabilidad ión cloruro, profundidad de corrosión, ingreso de cloruros y potencial de corrosión. Se observó que estructuras consideradas nuevas no tienen necesariamente un mejor desempeño que estructuras antiguas. Además, para establecer de buena manera el daño presente en una estructura se necesitan comparar diferentes indicadores, sin embargo, la resistencia a la compresión no es uno de ellos. Se demuestra que la absorción capilar y permeabilidad a los iones cloruros no es influenciada por presencia de carbonatación. La permeabilidad del hormigón es influenciada por el uso de puzolanas naturales como material cementicio suplementario y diferentes cantidades de agregado. El uso de puzolanas naturales reduce la permeabilidad al aire y a los iones cloruro en un 84 y 66% respectivamente, pero incrementa la absorción capilar más de dos veces. Se demuestra que la zona de interfase agregado-pasta (dependiente del contenido de agregado) tiene una importante influencia en la permeabilidad. Un incremento en el contenido de agregado en volumen de 0.64 a 0.69 y de 0.69 a 0.75 incrementa la permeabilidad al aire en un 35 y 91% respectivamente.. Palabras claves: durabilidad, permeabilidad, corrosión, puzolanas naturales, interfase. x.
(12) ABSTRACT. Reinforced concrete structure being durable can make a contribution in sustainability, avoiding the waste of resources unnecessarily. Corrosion of steel bars embedded in concrete is of great concern and imply the ingress of different components to induce it. This makes permeability of cover the property of interest and a whole understanding of it is necessary. To understand the performance of concrete structures in terms of it durability compressive strength, air permeability, sorptivity, chloride ion permeability, carbonation depth, chloride ingress and potential of corrosion were measured. It is noticed that structures considered as new do not have a better performance than old ones. Also, a good damage assessment needs comparing different measurements but compressive strength is not related to it. It is demonstrated that sorptivity and chloride ion permeability results are not influenced by carbonation. Permeability of concrete is influenced by use of natural pozzolans as supplementary cementitious materials and different amount of aggregates. Use of natural pozzolans reduces air and chloride ion permeability by 84 and 66% respectively but increase sorptivity rate more than two times. The interfacial-transition-zone (dependent of the aggregate content) is probed to have an important influence in permeability. An increase in the aggregate content by volume from 0.64 to 0.69 and from 0.69 to 0.75 increases the air permeability in 35 and 91% respectively.. Keywords: durability, permeability, corrosion, natural pozzolans, ITZ. xi.
(13) xii.
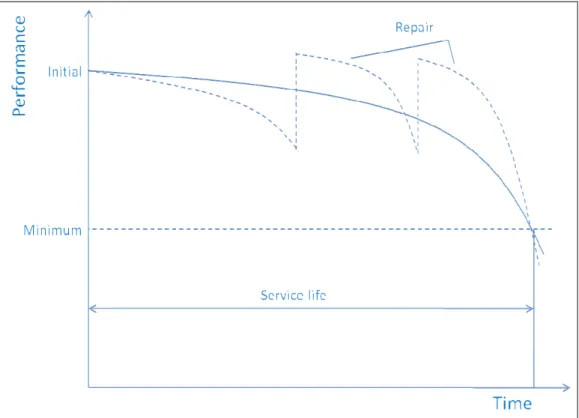
(14) 1. 1. INTRODUCTION. 1.1. Reinforced concrete durability context and relevance. One of the most important challenges in construction nowadays is sustainability. Construction industry consumes high amounts of materials and energy sources and has an important impact in environment: the extraction of fine and coarse aggregate implies to modify the conditions of a hill or a bank of river. Clinker production, the main cement component, is one of the biggest sources of carbon dioxide emissions (Mehta & Monteiro, 2006), producing a tone of carbon dioxide per ton of clinker and its production requires high levels of energy (1700 Jules per gram of clinker). This is not friendly with the environment; therefore, something must be done in order to attenuate the negative impacts. Durability of materials is another concern of construction industry. The lack of durability of construction materials implies structures will not have the design performance along its service life, needing more maintenance and rehabilitation, as shown in Figure 1. However, it is not clear how structures need to be specified to be durable. For instance, over-specification is both wasteful of resources and unfair to the client while underspecification leads to premature and costly repair work (Richardson, 2004), and none of the alternatives are sustainable. Further, materials deterioration can make a structure not able to resist structural solicitations during its service life which is also pose as a sustainability concern. Thus, durability of materials, especially reinforced concrete durability has acquired a main role nowadays as way to get a sustainable concrete construction; however, specifications for durable concrete are still a challenge..
(15) 2. Figure 1: Relationship between concrete performance and service life (CEB, 1997). Richardson (2004) proposed that the main challenge for concrete professionals in XXI century is specification and achievement of durable concrete. The infrastructure investment as well as conservation and reposition cost could be decreased if infrastructure would have an acceptable performance during its lifetime, but it is not always the case. As regards to durability of concrete, reinforced concrete corrosion is now the greatest cause of different infrastructure and building durability failures around the world (Richardson, 2004), therefore requires special attention. Long-term studies showing chlorides penetration and corrosion of steel bars in concrete are rarely found (Uddin Mohammed, Hamada, & Yamaji, 2004); and it is lower in concrete with blended cement with high content of natural pozzolans (most used in Chilean construction industry). Also environmental conditions do not follow a steady regimen; hence, it is even more difficult to improve concrete structures performance affected by the environmental conditions by just improving materials characteristics (CEB, 1997) and considering a.
(16) 3. steady regimen as test method does. However, the understanding of deterioration processes and its parameters involved is needed to relate different factors affecting durability. A whole understanding of factors affecting durability and relations between them is shown in the Comite Euro-International Du Beton (1997). In this scheme, durability is linked with performance and all parameters affecting each one are listed.. Figure 2: Relationship between durability and performance (CEB, 1997). The first step to understand the structure durability is analyzing the steps involving its construction, since the structural design and materials selection and the execution in field and curing treatment applied. Above determine pore structure and it distribution.
(17) 4. and this in turn will explains transport mechanisms present during the structure service life. As each deterioration process implies the ingress of agents, the transport mechanisms will determine the ease of deterioration development. Finally, structural performance is dependent by mechanical properties like concrete resistance and rigidity and reductions on these compromise the safety and serviceability. Therefore, long term studies are still necessary and environmental effects should be considered to understand different scenarios and processes of deterioration related to durability of concrete. Some of the most important pathologies in reinforced concrete are alkali-silica reaction, freeze/thaw cycles, sulfate attack, carbonation, chloride ingress, and corrosion of reinforcement. Since corrosion of reinforcement is a deterioration process affecting the steel bars and it can be induced by carbonation and/or chloride ingress, it will be considerate in a separate section.. 1.2. Concrete Pathologies. 1.2.1. Alkali-silica reaction. Although aggregates in concretes are considered to be inert, under certain conditions siliceous components in aggregates react with sodium and potassium hydroxides in the alkaline pore solution of concrete, forming a gel that can expand upon wetting increasing pressure due the expansion of hardened concrete (Richardson, 2004). Such pressure may crack the concrete if tensile strength is exceeded..
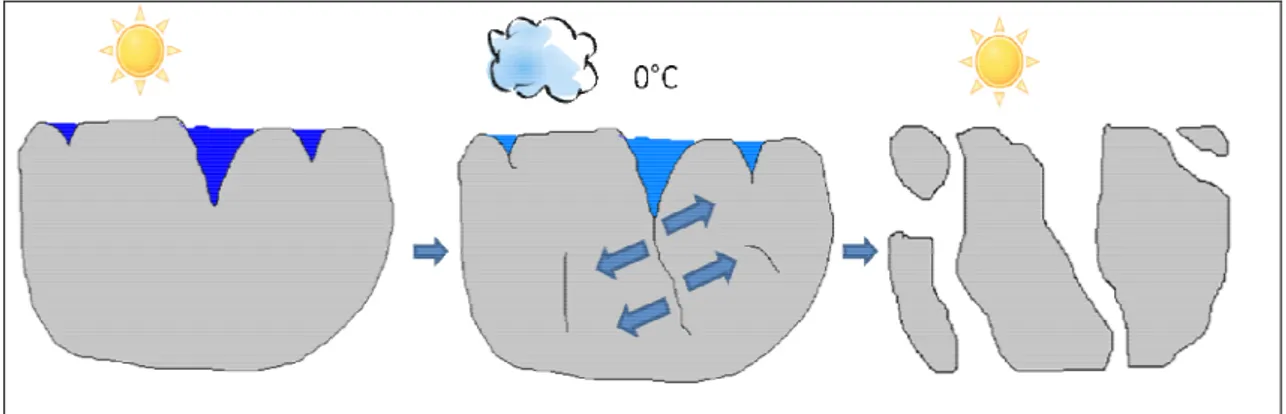
(18) 5. Figure 3: Effect of Alkali-Silica reaction (CEB, 1997). 1.2.2. Freeze/thaws cycles. In solid state, water occupies a volume 9% greater than liquid water. So, if water in concrete pores froze an expansion will occur that will generate internal pressures. Cracks may form which fill of water upon thawing, allowing new expansion and further cracking upon the next freeze cycle..
(19) 6. Figure 4: Freeze/thaw effect (CEB, 1997). 1.2.3. Sulfate attack. Sulfate attack is characterized by the chemical reaction of sulfate ions with the aluminates components of cement, forming mainly ettringite and to a lesser extent gypsum. The resulting compounds cause expansion of concrete, leading to cracking with an irregular pattern (CEB, 1997).. All previous pathologies imply cracking, so they will facilitate the further ingress (access) of damaging agents.. 1.3. Reinforcement Corrosion. Corrosion of metals is an electrochemical process whereby a metal undergoes a reaction with oxygen and moisture in the environment to form a compound. Mehta & Montero (2006) consider that corrosion cells may be generated by having two dissimilar metals embedded in concrete, when exits significant variations in surface of the steel or when appears differences in concentration of dissolved ions, such as alkalis and chlorides, in the vicinity of the reinforcement. Concrete possesses high pH (between 12 and 13) due to the calcium hydroxides form upon hydration of cement present in the pore liquid phase. Reinforcement begin to.
(20) 7. corrode in fresh concrete through a reaction between iron andwater, forming corrosion products consisting of Fe2O3 or Fe3O4 which prevents the dispersal of ferrous ions and is a conductor of electricity (Richardson, 2004). This corrosion products forms a layer on the surface of the reinforcement and became it in a “passive” state. This “passive” state prevents corrosion by avoiding contact between steel bars and oxygen and moisture. The passive film may be broken down in time through carbonation or chloride ingress reaching the steel (Richardson, 2004), enabling chemical reactions to produce corrosion. When the passive layer is broken down, corrosion occurs in the voids that contains water by reactions of ferrous ions (from anodic reaction) with hydroxide ions (from cathodic reaction), producing ferrous hydroxide which will react with oxygen and water again to produce ferric hydroxide (El-Reedy, 2008). Chemical reactions are shown next.. Fe. Fe2+ + 2e-. 2e- + H2O + ½ O2 Fe2+ + 2OH-. Fe(OH)2. 4Fe(OH2) + O2 + 2H2O 2Fe(OH)3. 2OH-. 4Fe(OH)3. Fe2O3.H2O + 2H2O. Iron hydroxides react with oxygen and water molecules forming oxides with lower density, occupying more volume. As it was seen in other concrete pathologies, this increase of volume creates pressures exceeding tensile strength, which generates cracking and delamination in concrete surface..
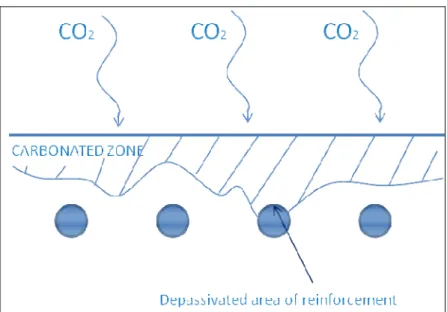
(21) 8. Figure 5: Reinforced concrete column showing delamination due reinforcement corrosion. Corrosion occurs if concrete’s moisture is high enough to act as an electrolyte and the concrete cover has to be permeable to allow the ingress of oxygen and elements that may destroy the passive film on the reinforcement, i.e. carbon dioxide and/or chlorides. Hence, it is of interest to understand how carbonation and chloride ingress allow the occurrence of corrosion.. 1.3.1. Carbonation. Carbonation is a chemical reaction between carbon dioxide (CO2) present in air with calcium hydroxide (Ca(OH)2) present in the hydrated cement paste. Ca(OH)2 gives the alkaline nature to concrete, having a pH between 12 and 13. The reaction occurs in presence of moisture and involves the production of calcium carbonate (CaCO3), decreasing the surrounding pore fluid pH at 8-9 (Richardson, 2004)..
(22) 9. The high pH of concrete without carbonation creates the passivation of steel; therefore reinforcement corrosion will not start in this state.. However, when pH drops,. reinforcement is vulnerable to corrosion.. Figure 6: Carbonated front in concrete (Richardson, 2004). Carbonation rate depends on the diffusivity and permeability of concrete; if concrete is more permeable CO2 diffuse easily. However, as calcium hydroxide (Ca(OH)2) reacts with CO2 forming calcium carbonate (CaCO3), which has greater volume, porosity of carbonated concrete is reduced (Neville, 2000) affecting permeability of concrete.. Ca(OH)2 + CO2 Ca2+ +2OH- + CO2. Ca2+ + 2OHCaCO3 + H2O. Further, as CO2 reacts with Ca(OH)2, the lower calcium hydroxide content, the less amount of CO2 needed to remove the remaining Ca(OH)2 to produce CaCO3 (Neville, 2000; Richardson, 2004). In this context, blended cements are more susceptible to carbonation and so do concretes with low cement contents..
(23) 10. Additionally, calcium carbonate and hydrated silica can be formed when carbon dioxide is combined with calcium oxide (CaO) present in un-hydrated and calcium silicate hydrate.. 3CaO.SiO2 + 3CO2 + yH2O. SiO2.yH2O + 3CaCO3. 2CaO.SiO2 + 2CO2 + yH2O. SiO2.yH2O + 2CaCO3. Also, there are many mathematical models to predict the rate of carbonation, accepting that the square root of time provides a good basis. The square root of time relationship is stated as follow: , where x = depth of carbonation, t = time and a factor “k”. Sophisticated models improve the factor “k”, establishing that is dependent of the water-to-cement ratio, diffusivity carbon dioxide concentration, exposure conditions, among others.. 1.3.2. Chloride ingress. The passivity of reinforcement depends on the stability of the alkaline nature of the concrete. An excessive level of chlorides makes the protection afforded by the passive layer around the steel bars ineffective. When critical level is exceeded, chloride induced corrosion may occur (Richardson, 2004) in a small area affected acting as the anode..
(24) 11. Figure 7: Corrosion in chloride environment. Chemical reaction goes as follow: 2Fe2+ + 4e-. 2Fe. 2Fe2+ + 4Cl2FeCl2 + 4H2O. 2FeCl2. 2Fe(OH)2 + 4H+ + 4Cl-. 2FeOCl + 2H2O. 2Fe(OH)2 + 2Cl-. There are model to predict the chloride ingress too, they are governed by Fick´s second law of diffusion. Both, carbonation and chlorides ingress facilitates corrosion and are dependent of the ease at which carbon dioxide and chlorides penetrates concrete. In this context, as occurrence of corrosion implies ingress of different elements at the level of reinforcement, permeability is of great concern. Concrete cover needs to be impermeable enough to avoid the ingress of these elements, and thick enough to prevent reaching the reinforcement at early ages. Moreover, cement content, cement type and environment are of consideration to facilitate or delay reinforcement corrosion..
(25) 12. 1.4. Factors controlling durability. From above, chemical and physical processes affecting durability of concrete depend on the transport of elements that enable that processes (if they are not in concrete). For the case of corrosion, what is matter of interest in this research, the elements involved are oxygen, water, carbon dioxide and chlorides. The rate at which particles and fluids pass through the concrete depends mainly on the permeability of concrete (Carcasses & Ollivier, 1999; Mehta & Monteiro, 2006). Permeability depends on many factors such as pore structure and its connectivity, transport mechanisms, environmental aggressiveness among others (Neville, 2000).. 1.4.1. Pore structure. The water filled spaces in fresh concrete become filled by hydration products forming a gel with greater bulk volume than unhydrated cement grains (Richardson, 2004) that makes hardenedconcrete more impermeable. The different spaces created between crystals of hydrated products are the pore structure, and it is classified depending on its pore radius range. Richardson (2004) and CEB (1997) classified the pores as gel pores (or micropores) if its diameter is between 1 and 8nm, in capillary pores between 0.01 and 5µm and air voids in a range from 100µm (entrained air) to 2mm (entrapped air).. Figure 8: Pore types (Richardson, 2004).
(26) 13. Even though the size pores is relevant, its distribution also has great influence. If a concrete “A” has more volume of gel pores than capillary pores compared with a concrete “B”, concrete “A” should be less impermeable (assuming that all other factors remain constant).Hence, the pore network of the bulk paste, as well as the interface between aggregate and cement paste, are matter of concern. Pore network means that pores are connected; the more connected and less tortuous they are, high levels of permeability will be obtained.. 1.4.2. Permeability. The permeability of concrete is influenced by permeability of the cement paste, especially the quality of paste in cover concrete structures and at the interface with aggregate particles (Richardson, 2004). If concrete is considered as a material with different phases, its permeability will be influenced by permeability of each phase. In a three-phase model, the phases involved are: cement paste, aggregates and interfacial transition zone (ITZ) (Mehta & Monteiro, 2006; Carcasses & Ollivier, 1999)..
(27) 14. Figure 9: ITZ representation. Permeability of hardened cement paste is mainly dependent on water-to-binder ratio (w/b). As w/b is the main factor influencing mechanical properties such as compressive strength, many people specify compressive strength to ensure durability, which is a big mistake (Mehta & Monteiro, 2006; Neville, 2000). High w/b produce a high capillary porosity, due to weak and less dense chemical bonds in the hydration process. Mixing water is indirectly responsible for this (Mehta & Monteiro, 2006), since it determines total and unfilled space in the cement paste microstructure after water has been consumed either by cement hydration or by evaporation, resulting in large and well-connected capillary pores when too much water is added. In theory, all capillary voids could be filled with a w/b low enough (Richardson, 2004); however, in practice this is rarely achieved because full hydration is not possible. With respect to aggregates, its permeability depends on their own characteristics; for example, for porous and permeable aggregates, hydration products can penetrate external pores decreasing permeability to that of cement paste or ITZ. For non-porous aggregates the tortuosity (as many paths that are generated by including an aggregate).
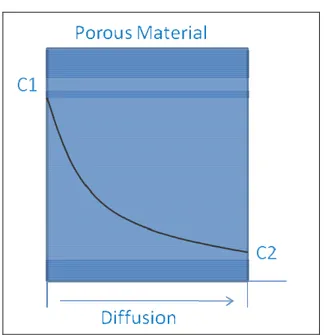
(28) 15. of the pore structure increases importantly decreasing intrinsic permeability to values lower than that of cement paste or ITZ (Carcasses & Ollivier, 1999). If aggregates are considered as impermeable (at least with very low permeability), it can be assumed that more aggregate present in concrete will decrease permeability. Nevertheless, permeability does not decrease because cement paste located at the aggregate surface (ITZ) is more porous, permeable, and weaker compared to bulk cement paste. Therefore, an increase in the aggregate content increases this detrimental effect of the ITZ. One of the reasons of ITZ being weaker is that a thin water film is formed around large aggregate particles increasing w/b locally (Mehta & Monteiro, 2006). ITZ is addressed deeper in Chapter 3.2 Besides w/b, curing and consolidation has an influence in permeability of concrete (CEB, 1997). An adequate curing process decrease permeability of concrete surface by providing better hydration in the zone exposed to environmental condition, reducing the porosity and pore connectivity.. 1.4.3. Transport mechanisms. The main transport mechanisms in concrete are: gas and water diffusion, ionic diffusion, absorption and liquid flow under pressure (Richardson, 2004). When transport of gas trough concrete is result of a concentration gradient rather than pressure differences, the transport mechanisms would be diffusion (Neville, 2000); molecules move from areas of high concentration to areas of low concentration. Diffusing molecules move randomly and independently from each other, having constant collisions (Richardson, 2004) what makes that only a fraction of those molecules cross a given section. The ionic diffusion, as that present in sulfates and chlorides, follows a similar pattern to gas diffusion, but in addition to a concentration gradient, saturated conditions are needed..
(29) 16. Figure 10: Diffusion principle. Absorption is referred to the ingress of a fluid into the spaces within the concrete by capillary action (Neville, 2000; Richardson, 2004), because is related to the pore structure and not necessarily depends on permeability. This transport mechanism takes place when the concrete surface is affected by rain or splash water and is partially unsaturated. Finally, the liquid flow under pressure appears when an element is under a hydrostatic head produced by a column of water, for example. Saturation is not needed for it existence but will have great importance if the element is saturated. In un-immersed structures, gas diffusion takes place predominantly. If rain starts, capillary pores will catch water particles by absorption, making more dificult the gas diffusion. This will continue until concrete surface get saturated with water, where water and ionic diffusion may take place. If the structure, or part of it, is immersed, the liquid flow under pressure will dominate.. 1.4.4. Environmental aggressiveness.
(30) 17. Agents involved in any concrete pathology are immersed in the environment surrounding the structure, and its concentration will determine the risk of triggering a deterioration process. Also the structure can be exposed to the environment at different levels, such as mild, moderate and severe. Different categories for environmental pollution and potential to develop corrosion of atmospheres are given in ISO 9223. To estimate the durability risk and to incorporate it at the design stage, an evaluation guide for a given structure in a given environment was developed. According to Comite Euro – International Du Beton (CEB, 1997) the factors that have dominant influence in determining the aggressiveness of a particular environment are the presence of aggressive substances in moisture, moisture and temperature. As was mentioned in Chapter 1.2, some substances causing deterioration process are oxygen, carbon dioxide, chlorides, sulphates, alkalis, among others. The higher concentration of any of these agents, at a same level of relative humidity and temperature, the higher is the risk of start a deterioration process or make it more severe. Water is present in all deterioration processes and it is found in moisture (in unimmersed structures) and can be measured by the relative humidity. Richardson (2004) state that rate of carbonation is highest in the range of 50 to 75 percent of relative humidity (RH). For reinforcement corrosion concrete moisture is more important than moisture in the environment; 80 percent of RH is critical, below this level there is insufficient water and over it, is saturated; therefore no oxygen is present to react. Finally, as deterioration processes involve chemical reactions, they will be accelerated by increasing the temperature. Hence, average temperatures and variations of it will determine the ease at which the chemical reactions are produced.. 1.5. Supplementary cementitious materials. A review through the most relevant issues involved in durability of concrete has been made, now is time to make an approach of how improve it. One way to obtain a more durable concrete is using supplementary cementitious materials (SCM). This occurs because SCM particles are finer than Portland cement,.
(31) 18. improving the particle packing and with an adequate good curing, SCM reduce permeability of concrete (Neville, 2000), improving its durability. The use of SCM improves durability of concrete, providing additional benefits such as improvement in workability, reduction of the heat of hydration, reduction in permeability, increase in ultimate strength, increase in resistance to sulphate attack and reduction in alkali-silica expansion (Rodríguez-Camacho & Uribe-Afif, 2002; Uzal & Turanli, 2003; Papadakis & Tsimas, 2002). A method that helps to reduce the impact of cement industry on energy and carbondioxide emissions is to produce blended Portland cements containing less than 95 percent Portland clinker (Mehta & Monteiro, 2006), giving another path to get a sustainable concrete construction. Also, among the SCM, natural pozzolans have gain more attention because they might be widely available. Some clays and volcanic ashes and do not depend on the presence of other industries such as silica fume, fly ash and ground granulated blast furnace slag. As any other SCM with high SiO2 contents, natural pozzolans react with calcium hydroxide produced by the hydrating Portland cement, forming new calcium silica hydrates (C-S-H) (Neville, 2000), having a great impact in concrete performance (CEB, 1997) by improving concrete mechanical properties, such as compressive strength and concrete physical properties such as permeability.. 1.6. Context in Chile. Why is all of this relevant to Chile? According to Infrastructure Committee Report, Chile (2010), infrastructure deficit reaches USD 22,700 million, while infrastructure investment is USD 24,100 million and the minimum conservation and reposition cost is about USD 723 million. In this context, there is a significant amount of money that could be invested in other projects with national interest, being durability of concrete one way to make a contribution in this but durability specification have an outstanding debt. Blended cement (OPC with natural pozzolans) is the most used cement in Chile. Its production and internal consumption are growing up. According to Minería Chilena (2006) cement local production arise 4.7 million tons, representing a per capita.
(32) 19. consumption of 274 kilograms of cement. It has increased because the Chilean economy have had a sustained growth and natural events, like the earthquake on February of 2010, has triggered an explosive cement demand due to reconstruction needs. Also, this growth in cement production means an increase in carbon dioxide emissions. This may become another problem of national interest, unless appropriate measures are applied, which gives another plus to durability concerns. All of this implies that construction of durable structures needs to be done to avoid future maintenance and reconstruction due bad performance among structure service life.. 2. RESEARCH CONTEXT. 2.1. Hypothesis. The hypotheses of this research are: • Permeability, porosity, and chemical composition of concrete using blended cements (OPC + natural pozzolans) have an adequate performance in terms of it durability, independently of the environmental conditions of exposure. • An adequate design of the concrete mixture (constituent’s material selection and their proportion) determines its permeability, and the use of natural pozzolans are as important as amount of ITZ in controlling permeability.. 2.2. Objectives. According to the first hypothesis, the main objective is characterizing the structures in terms of it durability. The specific objectives are: (1) Evaluate the most appropriate test(s) to evaluate durability of reinforced concrete. (2) To determine the effect of carbonation in permeability of concrete..
(33) 20. It is considered a specific objective to determine the most appropriate test(s) to evaluate durability of reinforced concrete. For the second hypothesis the main objective is to establish a relationship between concretes design parameters explaining it permeability. The specific objectives are: (1) To determine the effect in sorptivity (capillary absorption), air permeability and chloride ion permeability. (2) To determine the amount of ITZ, by estimating the aggregate surface, that minimizes the values of sorptivity, air permeability and chloride ion permeability. (3) To establish if using natural pozzolans is more important than the amount of ITZ to decrease the values of sorptivity, air permeability and chloride ion permeability.. 2.3. Experimental methodology. In order to reach the best understanding of the performance of concrete made with blended cement (OPC + natural pozzolans), in Chile, three complementary approaches were considered: The first approach consisted of evaluating different structures in terms of its mechanical properties, permeability and deterioration. This was applied to eight structures in two different environments: urban (characterized by high CO2 concentrations), and marine (characterized by high chloride contents). In each environment, a structure ranging between 5 to 50 years in age was considered.. The structures selected are shown in Table 1.. Table 1: Selected structures.
(34) 21. Unfortunately, there was not enough information on the projects (specifications) and results from quality control available; therefore, the second step was to evaluate their mechanical properties, permeability, and deterioration. The second approach consisted of building four concrete walls , two in Santiago and two in Valparaíso, using water to binder ratio (w/b) of 0.6 and 0.4 and with cement content of 270 kg/m3 a 400 kg/m3 respectively to each w/b; which correspond to the minimum and a relatively high cement content allowed in Chile. Also, steel reinforcement was disposed having three different covers: 1.5, 2.5 and 5 cm, to determine cover effectiveness in each environment. The steel bars used were 18 mm in diameter. The objective is to perform a long-term monitoring (app 40 years) in order to determine the environmental aggressiveness and its effect in mechanical properties, permeability and deterioration processes. So far, only results at 28 and 90 days have been taken. These two approaches were part of FONDEF project D07i1076 called “Definition and Implementation of a Durability Specification System for Reinforced Concrete Structures”. Only part of the results from structures tests and walls built are analyzed because the whole analysis is protected as results of FONDEF project D07i1076. Results are summarized in Appendix 1 and 2 respectively. Finally, the third approach consisted on conducting research aimed to understand the effect of the use of natural pozzolans as SCM, and the amount of ITZ present in permeability of concrete.. It is generally accepted that permeability of concrete decreases when using natural pozzolans; however, the effect of ITZ it is not clearly understood yet..
(35) 22. The experimental methodology is summarized in Figure 11.. Figure 11: Experimental methodology. 3. PERFORMANCE EVALUATION OF EXISTING STRUCTURES. 3.1. Structures selection. The concrete specimens used were structural elements (columns, beams and walls) of structures located in two cities of Chile: Santiago, with yearly averages temperatures and relative humidity rates of 16.8°C and 61.2 respectively (Troconis et al., 2009) and Valparaíso, a coastal location where the chosen elements where at 600m or less from the sea, under yearly averages temperatures and relative humidity rates of 14.8°C and 82% respectively (Wikipedia, 2008). These cities were selected because they represent: a zone with a high concentration of CO2, expecting corrosion induced by carbonation, and a zone severally affected by chlorides. Considering that a specific aggressive environment have different effects in the deterioration processes depending on the exposure period, the selected structures were.
(36) 23. classified in two ranges: “young” structures (YS), between 5 and 15 years of age and “old” structures (OS), between 20 and 50 years of age. A total of eight structures were selected, four under urban conditions and four under marine conditions with two YS and two OS in each case. This also allowed for studying the effect of the age of construction, considering that nowadays less cement is used compared to that in the past (Neville, 2001).. In each structure, west and south fronts were tested, representing the worst scenarios of environment exposure, compared to north and east face. The west face was selected because it has a wet and dry cycle during the day; it was wet in the morning due to morning frost and shadow, and dry from noon to sunset because of the sun path. Additionally, in marine environments, the west front faces the wind and so high exposure to chlorides. In the other hand, the south face in chile is usualy moist because sun never hits it.. 3.2. Reinforced concrete structures characterization. In the context of FONDEF project D07i1076, in each structural element, sixteen concrete cores were extracted according to NCh 1171/1. The different tests were separated in three categories in terms of the property measured.. Table 2: Methods of assessment used.
(37) 24. In Chapter 3.2 results shows compressive strength, carbonation depth, chlorides penetration depth, corrosion potential and rate of corrosion as a deterioration index; and air permeability, chloride ion permeability and sorptivity (capillary absorption) as durability index. Only compressive strength was considered as mechanical property and it was measured on cores according to ASTM C39 / C39M - 10. Carbonation depth was measured by applying phenolphthalein to concrete cores. The uncolored zone represents de zone affected by carbonation as is shown in Figure XX..
(38) 25. Carbonated zone. Figure 12: Concrete simple with phenolphthalein. Chlorides penetration depth was measured by applying silver nitrate at 0.1N (Otsuki, Nagataki, & Nakashita, 1992) to one half of a concrete core obtained by from the spliting test. Corrosion potential and rate of corrosion was measured using GeCor-8 equipment, which used the Cu/CuSO4 electrode recommended by ASTM C876. The test consists of determining the potential difference between steel bars and the concrete surface in contact with the electrode. A reinforcement grid is made prior to apply the test and a map by testing potential corrosion in several points. Corrosion rate was tested in zones with great risk, detected by corrosion potential. When an important section of the wall had high corrosion potentials the average result is shown, but when there are a few points with corrosion potentials of consideration, just those values are presented..
(39) 26. Figure 13: GeCor 8 equipment. Air permeability was measured on concrete cover at three heights, and six measures were taken at each height, according to SN EN 206-1, 2003 (Swiss standard). The test method consists of estimating air permeability by applying a known vacuum and measuring the air influx from within concrete. Saturated or partially saturated pores will affect the air permeability; therefore, the results need to be corrected by moisture (Torrent). Moisture was estimated by measuring concrete electrical resistivity. Figures 14 and 15 shows the air permeability test principle, and equipment, espectively..
(40) 27. Figure 14: Air permeability testing principle. Figure 15: Permea-Torr equipment. Chloride ion permeability was measured on 100x50-mm cylinder samples according to ASTM C1202-05. In this test, an electrical potential of 60 V is maintained across the.
(41) 28. flat ends of the saw-cut cylinder (previously conditioned), during 6 hours. One end is immersed in a NaCl solution and the other end is immersed in a NaOH solution. Chloride ions travel across the specimens and the current is measured periodically. At the end of the test, the total charge passed, in coulombs, is calculated, and the permeability of concrete is obtained. Sorpitivity was measured on 100 x 50-mm cylinder samples according to ASTM C1585-04. The test consists of measuring the change in mass over time of a concrete specimen, previously conditioned. One flat side of the specimen is in contact with water and a change of mass is produced by capillary absorption. Water loss is prevented by sealing the side and the top surface of the specimens. Figure 16 shows a schematic of the test.. Figure 16: Sorptivity test. Data collected during the first 6 hours of the test corresponds to the “initial absorption” while that collected between 1 to 7 days correspond to the “secondary absorption”. Results are plotted as the cumulative change in mass divided by the exposed area and density of water, versus the square root of time. This method calculates the slope of the initial absorption and the secondary absorption, each one independently. As each stage represents different effects (i.e., capillary absorption for the initial and diffusion for the secondary), a unique coefficient is calculated from the intersection of the two slopes..
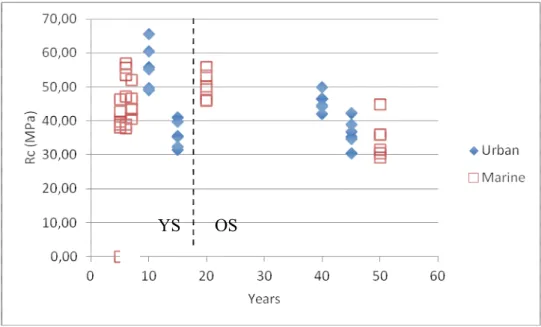
(42) 29. 3.3. Compressive Strength. Compressive strength is the mechanical property most used to specify concrete structures. Concrete used in the structural elements tested are within the range commonly used in Chilean construction industry, as shown in Figure 17.. YS. OS. Figure 17: Structures compressive strength. According to these values, concrete structures should have a good performance in terms of it durability as was believed in the past (Neville, 2001).. 3.4. Durability Assessment. Because it is not expected that concrete durability is assured just by a certain compressive strength, , other tests must be applied to get a whole understanding about the durability state of a structure..
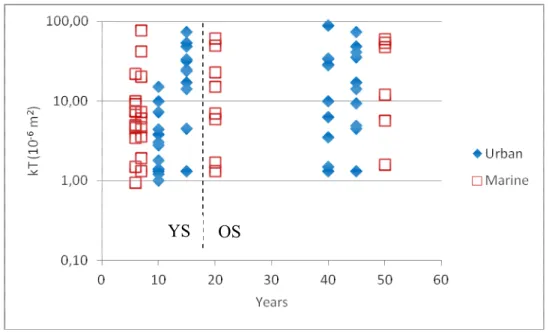
(43) 30. From values shown in Figure 18 for air permeability, there are no significant differences at any age ranges and exposure conditions. The above is attributable to high sensibility to cracks and micro-cracks presence (i.e. cracks from thermal strains, shrinkage strains) of the equipment used, even when the intention was avoid them. Therefore, it is not considered as a good index to evaluate structures, but can be adequate for testing concrete at early ages (see Chapter 3.2).. YS. OS. Figure 18: Air permeability (log scale) vs. years of exposure. Chloride ion permeability (see Figure 19), decreases with time reaching its minimum value over 20 years of age, becoming relatively constant, independently the conditions of exposure. Although the rate of hydration plays an important role in explaining the decrease in permeability with time, other factors such as mixture design and exposure conditions might have an effect on the results. According to the age, OS concretes have great performance in terms of its chloride ion permeability. These concretes have less amount of cement and are more finely graduated..
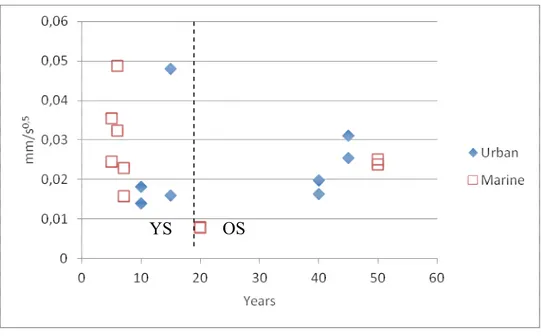
(44) 31. YS. OS High. Moderate Low. Very Low. Figure 19: Chloride ion permeability vs. years of exposure. In terms of sorptivity values, they did not follow any appreciable pattern as Figure 20 shows. Capillary pores are of great concern in this test (Castro, Bentz, & Weiss, 2011) and since concrete surface condition varies from sample to sample (due different exposure conditions aggressiveness), results will not be comparable if they do not have a common surface treatment..
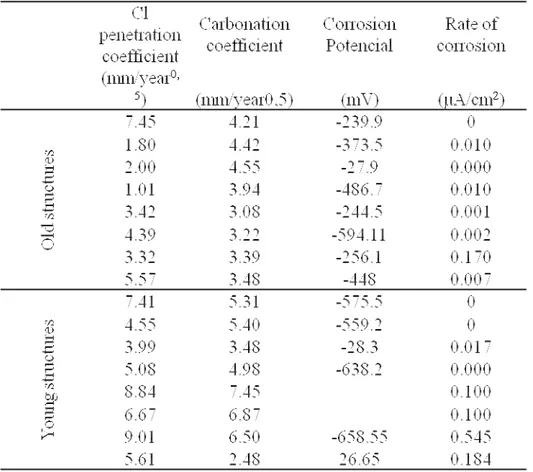
(45) 32. YS. OS. Figure 20: Sorptivity vs. years of exposure. 3.5. Deterioration Assessment. An analysis of different concrete properties is necessary to establish the real corrosion risk of the structures, by measuring carbonation depth, chloride ingress depth, corrosion potential and rate of corrosion. It is not enough to measure just the depth of carbonation or depth and chloride penetration because the time needed to reach that depth it is also of interest; therefore, the coefficient of diffusion should be measured. It is accepted that this coefficient depends on the square root of time and can be estimated using the following equation: K = X (t0)-0,5 (mm/year0,5). (1),. where X is the chloride penetration or carbonation depth and t0 is the age in years. The values obtained for this property are summarized in Table 3. The categories used to evaluate the results are shown in Appendix 3..
(46) 33. Table 3: Deterioration assessment results. Results show very low values of corrosion potential, under -350mV, considered high risks of corrosion. Also, structures with these values of corrosion potential have high values of diffusion coefficient, and in some of them have reached the reinforcement. Even when these results make the possibility of corrosion occurrence more feasible, rate of corrosion shows very low values. The rate of corrosion values presented confinement problems at the moment of the test; hence they are not considered. Therefore, high diffusion coefficients with corrosion potential values under -350mV are considered as relevant when a deterioration assessment is made. Also the categorization of the structures in terms their age seems to affect the diffusion coefficient. This fact is related to the cement content and its composition used in different periods of time, and is further discussed in the Chapter 3.1.5..
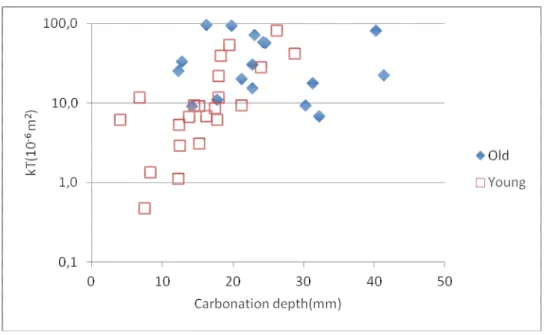
(47) 34. Finally, from the corrosion potential maps, zones with values of consideration are detected at medium or low heights. Hence, it is relevant to ensure durability condition at these points.. Figure 21: Examples of corrosion potential maps. 3.6. Carbonation effect in permeability of concrete. As was explained before, carbonation affects durability of reinforced concrete, destroying the layer at bars surface lowering its pH. This is an indirect way to promote deterioration of concrete and it is a concern only if reinforcement exits. The question is, does carbonation affect any concrete property by its own? It was mentioned in Chapter 1.3 that carbonation reduces the pore size of concrete, decreasing its permeability at surface level of a structure. To understand the performance of concrete with blended cement used in Chile (OPC + natural pozzolans), air, water (by sorptivity) and chloride ion permeability were.
(48) 35. measured in samples extracted from the structures, and results were related to carbonation depth.. Figure 22: Air permeability (log scale) vs. carbonation. All the OS had a similar performance in terms of it air permeability. They are in the same range, independently of the carbonation present. However YS increase its air permeability as carbonation depth rises. However, since an overlapping exits between OS and YS values above kT = 10x10-6 m2, air permeability do not reach limit, this means air permeability does not become constant at any carbonation depth. An explanation of this rise in concrete differences among time, doses has change as well as cement composition, which implies different responses to deterioration processes. Nowadays, cements are more finely ground and the chemical composition has more tricalcium silicate, making hydration process faster (Neville, 2001) and enabling to use less cement content than before the 80´s. According this, less cement content allows faster carbonation, because less carbon dioxide is needed to become calcium hydroxide in calcium carbonate. If we consider that water-to-binder ratio (w/b) is one of the main factor affecting carbonation, more than cement content (Neville, 2000); comparing a concrete from the past with one from the present, both with the same strength, it will result that the.
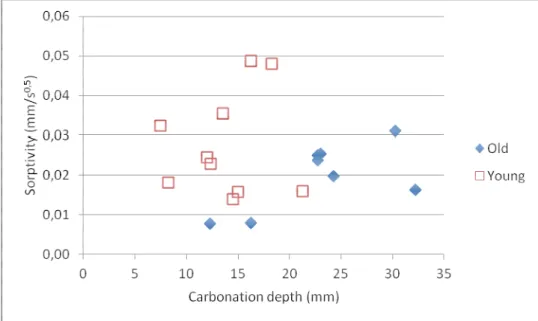
(49) 36. concrete from the present will have less cement content resulting in a high w/b. This could be another reason why YS are more affected by carbonation than OS if we assume that every element tested has a similar strength. These arguments do not apply to high strength concretes because they use an important amount of cement, which is not the case of structures tested. In terms of sorptivity and chloride ion permeability, the performance of YS it is not better than OS.. Figure 23: Sorptivity vs. carbonation.
(50) 37. Figure 24: Chloride ion permeability vs. carbonation. These results may have two possible explanations: carbonation products occupies more volume; therefore, a more compact surface is obtained in OS, decreasing permeability, and/or, less cement content in YS implies more water per unit of cement; hence, more capillary pores are generated at early ages, decreasing the permeability (Mills, 1987).. To establish if carbonation has a significant effect in permeability of concrete, samples extracted with a length higher than 100mm were cut in half order to obtain two specimens: an outer region affected by carbonation and an inner region no affected (no carbonation depth over 50mm were detected). Sorptivity and chloride ion permeability were tested in each sample and a statistical analysis was made.. Table 4: Permeability results with and without carbonation.
(51) 38. Results are presented as relative percentage of outer zones in the next Figure.. Figure 25: Carbonation effect in chloride ion permeability and sorptivity.
(52) 39. Results show no significant differences between the two samples of the same concrete. Carbonation does not affect sorptivity and chloride permeability with a 95% of confidence level; comparing different ages, environments.. 4. LONG-TERM MONITORING. 4.1. Walls scheme. The walls where built and disposed in field according the next planes. Figure 26 also shows the measurement plan trough time.. Figure 26: Wall elevation and measurement plan.
(53) 40. Figure 27: Walls position in field. 4.2. Materials and Mixtures. “Blind” cement (OPC with natural pozzolans) was used in the mixtures. The coarse aggregate had a saturated surface dry (SSD) density of 2673 kg/m3 and absorption of 1.1%, and the fine aggregate has a SSD density of 2767kg/m3 and absorption of 1.0%. Mixture design is summarized in the next Table:. Table 5: Concrete mixtures design (amounts in kg per cubic meter of concrete).
(54) 41. 4.3. Cementitious materials. Oxides analysis, specific weight and Blaine fineness was made for both, OPC and blended cement. The results are summarized in Table 6.. Table 6: Cement characterization.
(55) 42. The relatively high insoluble residue in the blended cement represents the natural pozzolans.. 4.4. Results summary and analysis. So far, mechanical properties, air permeability, sorptivity and chloride ion permeability results at 28 and 90 days have been taken and are summarized in the next Table:. Table 7: Walls measurement at 28 and 90 days.
(56) 43. Comparing mechanical properties, there are no significant differences between field and laboratory conditions. Nevertheless, even when materials and mixture design where the same for walls built in Santiago and Valparaiso, mechanical property values are higher.
(57) 44. in Valparaiso for laboratory and field conditions which means that execution plays and important role in achieve a target value. Air permeability grows with time and its impact is w/b dependent. With a w/b of 0.4, air permeability increases 24 times from 28 to 90 days, while with a w/b of 0.6, the increase is 3.5 times. For all ages, wall with w/b of 0.4 shows less air permeability than the wall with w/b of 0.6, but differences are closer at 90 days. Sorptivity results shows no big differences between different w/b in Santiago at 90 days. Chloride ion permeability seems to be more sensitive to different w/b. Also, with a w/b of 0.4 there are no big differences between the two environmental conditions but with w/b of 0.6 the differences may be of consideration. Even when important differences are detected between the two environmental conditions in terms of mechanical properties, air permeability, sorptivity and chloride ion permeability do not follow the same pattern.. Corrosion potential was also measured and results are shown in Table xx:. Table 8: Corrosion potential at different covers. At 90 days, none wall shows corrosion potential values of consideration. Electrical resistivity was also measured, values are too high to consider any risk, so it is possible to establish that corrosion process have not started yet..
(58) 45. 5. REDUCING CONCRETE PERMEABILITY BY USING NATURAL POZZOLANS AND REDUCING AGGREGATE-TO-PASTE RATIO Fernando Bustos1; Patricia Martinez2; Carlos Videla3; Mauricio Lopez4 1. Pontificia Universidad Catolica de Chile; Avda. Vicuña Mackenna 4860, Department of Construction Engineering and Management, E-mail:[email protected] 2 Universidad de Valparaiso; Gran Bretaña 1041, School of Engineering; E-mail:[email protected] 3 Pontificia Universidad Catolica de Chile; Avda. Vicuña Mackenna 4860, Department of Construction Engineering and Management; E-mail:[email protected] 4 Pontificia Universidad Catolica de Chile; Avda. Vicuña Mackenna 4860, Department of Construction Engineering and Management; E-mail:[email protected]. 5.1.. Abstract. Durability of reinforced concrete structures is mainly achieved with a low-permeability concrete. Permeability of concrete depends on both permeability of the bulk paste and that of its interfacial transition zone (ITZ). Even though permeability of bulk cement paste can be adequately controlled, the effect of ITZ on the permeability of concrete is not well understood yet and can be a key to improving the durability of concrete. This paper shows that minimizing permeability of concrete requires minimizing permeability of the bulk paste by using a supplementary cementing material (SCM) such as natural pozzolans (NP) and minimizing ITZ by reducing aggregate content. This was done by comparing performance of concrete mixtures made with ordinary portland cement (OPC) and blended cement (OPC+NP) at the same water-to-binder ratio (w/b) and by comparing performance of concrete mixtures with different aggregate contents (different amount of ITZ) at the same w/b. All of this was performed through testing of mechanical properties, air permeability, sorptivity (capillary absorption), chloride ion permeability, and aggregate specific surface. Results shows that NP in concrete reduced air permeability by 84% and chloride ion permeability by 66%, but increased sorptivity by 50 to 140%. ITZ has an important.
(59) 46. effect in every property tested; especially in air permeability where sensitive reduction of more than a 90% was achieved at every age. ITZ effect seems to be as important as using SCM´s in reducing permeability of concrete.. Keywords: Durability, natural pozzolans, SCM, permeability, chlorides.. 5.2. Introduction. 5.2.1. Relevance of Durability. Sustainability one of the most important challenges that construction industry faces nowadays, and it is still not clear how to specify structures for sustainability. Overspecification is both wasteful and unfair to the client while under-specification leads to premature and costly repair work (Richardson, 2004), and neither of these practices are sustainable. Further, deterioration of materials makes structures unsafe which also poses a sustainability concern. Durability of materials, specifically that of reinforced concrete, has gained a main role in advancing sustainable construction by increasing safety and reducing maintenance and rehabilitation of structures (Shen, Li Hao, Wing-Yan Tam, & Yao, 2007). Nevertheless, specifications for durable concrete are still a challenge. Compressive strength is the main, and most of the time the only, property used to specify hardened concrete. Therefore, traditionally mixture designs focus on achieving the specified strength without considering other concrete properties affecting durability. Although compressive strength and durability depend on similar factors, achieving one of them does not guarantee achieving the other, so special care needs to be taken to achieve both. Since there is no a recipe to ensure durability (Neville, 2001), there is the need to investigate different ways to improve concrete durability without affecting compressive strength. Even when some designers are more aware of the importance of evaluating durability of structures to ensure the mechanical properties during service life and to estimate the.
(60) 47. actual cost of the structure (Mehta & Monteiro, 2006), contractors usually do not have a thorough knowledge about how to ensure durability. The problem becomes more complex because the information from durability tests is fragmented and cannot be easily synthesized to understand durability from a broad point of view (Mehta, 1991). Four deleterious agents have been identified as critical to concrete durability because their potential to produce corrosion in reinforced concrete. They are: water, chlorides, carbon dioxide, and oxygen. Thus, the ease with which these agents enter into and move through concrete, referred to as permeability (Neville, 2004), needs to be measured to assess concrete durability. Concrete permeability testing cannot be replaced by using the many probabilistic models developed to explain concrete deterioration, as proposed by Ferreira (2010) and Kliukas et al. (2004), despite their recent considerable improvements.. 5.2.2 Supplementary Cementing Materials (SCM) in durability of concrete. The addition of SCMs is an effective way to decrease the permeability of concrete (CEB, 1997; Mehta & Monteiro, Concrete: Microstructure, Properties and Materials, 2006; Neville, 2004). Silica fume and fly ash are among the most widely used SCMs, but natural pozzolans has proven to greatly impact concrete performance (CEB, 1997). Pozzolans are natural or artificial materials containing silica in a reactive form (Neville, 2004). Pozzolans react with the calcium hydroxide, derived from cement hydration, and water forming new calcium silicate hydrates (C-S-H) that increase compressive strength and reduce permeability. The use of SCMs have proven to improve durability of concrete and provide additional benefits such as improvement in workability, reduction of the heat of hydration, reduction in permeability, increase in ultimate strength, increase in resistance to sulphate attack, and reduction in alkali-silica reaction (Rodríguez-Camacho & UribeAfif, 2002; Uzal & Turanli, 2003; Papadakis & Tsimas, 2002) . Among many types of. SCMs, natural pozzolans have gain more attention lately. because they might be widely available, such as some clays and volcanic ashes. These materials do not depend on other industries, unlike SCMs such as silica fume, fly ash and ground granulated blast furnace slag..
(61) 48. As other SCMs, the use of natural pozzolans modifies concrete microstructure, improving concrete properties such as strength and permeability (Colak, 2002; Sabir, Wild, & Bai, 2001). Even more, the improvement in permeability appears to be very significant when compared to that in strength (Lopez & Castro, 2010).. 5.2.3 Factors affecting permeability. Permeability of concrete depends on the permeability of the cement paste, aggregate, and interfacial transition zone (ITZ). However, according to many (for example, (Richardson, 2004), permeability of concrete is predominantly controlled by the permeability of cement paste and that of ITZ. For porous and permeable aggregates, hydration products can penetrate superficial pores “sealing” the aggregate and restricting the overall permeability to that of the cement paste or ITZ. For non-porous aggregates the tortuosity of the pore structure increases drastically, decreasing intrinsic permeability to values lower than that of cement paste or ITZ (Carcasses & Ollivier, 1999). Water-to-binder ratio by weight (w/b) appears to be the main factor controlling permeability of cement paste (CEB, 1997; Neville, 2004), since it determines the initial space between unhydrated cement and the porosity and ultimately depercolation of pore structure (Powers, Copeland, & Mann, 1959; Powers, 1960). Mixing water is indirectly responsible for the permeability of hydrated cement paste (Mehta & Monteiro, 2006), since it determines total and unfilled space in the cement paste microstructure after water has been consumed either by cement hydration or by evaporation. Thus, lower mixing water contents will decrease permeability of cement paste. On the other hand, very high cement contents do not necessarily decrease permeability; there seems to be an optimum cement content for decreasing permeability (Zhang & Gjorv, 1991), since increasing cement content makes concrete more prone to heating and thermal cracking. Microcracks, normally present in the ITZ, increase permeability of concrete above that of the corresponding cement paste. From this perspective, ITZ effects on permeability become more important as aggregate volume increases (Carcasses & Ollivier, 1999)..
Figure
+7
Documento similar