Three essays on peripherality and
economic development
Paulino Montes-Solla
Doctoral Thesis
2015
Thesis Supervisor:
Dr. Jesus Lopez-Rodriguez
Universidade da Coruña
Acknowledgments
During these years, there are many people and institutions that have participated in this work. To all of them I want to express my gratitude for the support and confidence they have given to me so selflessly.
I would like firstly to thank the Department of Economic Analysis and Business Administration at the University of A Coruña for giving me the opportunity to complete my graduate studies.
I am grateful in a very special way to my supervisor, teacher and friend Jesus Lopez-Rodriguez. To him, I must first thank the path, the indications and the aid to develop this thesis. I consider myself a privileged person to have your friendship and supervision during this research. His academic expertise has given me the resolution of the difficulties encountered in the course of the investigation. Thank you also for your great generosity in the effort you have shown to me during these three years we have worked together sacrificing some of your free time to make this project go ahead and made me feel at home even if we were far away. Therefore, I will permanently be in debt with you Jesus.
I also appreciate the lessons and support from my teachers and all of my colleagues of the Jean Monnet Group on Competition and Regional Development in the EU of the University of A Coruña, and very especially from Emma Iglesias for her time devoted to help me out to solve the problems that often occur with running econometric programs.
I also thank to Professor Matilde Mas at Universitat de València and Director of International Projects at Ivie (The Valencian Institute of Economic Research) for providing me her support, reports and dataset used to develop this thesis. I appreciate the comments and suggestions from professors Geoffrey J.D. Hewings (Regional Economics Applications Laboratory of the University of Illinois at Urbana-Champaign), Frank van Oort (Utrecht University), Juan Ramón Cuadrado-Roura (University of Alcalá), and Associate Professors Adolfo Maza (University of Cantabria), Miguel Marquez-Paniagua (University of Extremadura), and other PhD Candidates at the workshops held at the Faculty of Economics and Business at the University of A Coruña.
Paulino Montes-Solla, University of A Coruña
Finally thanks to all who showed interest and participated in the presentation of the various chapters of this thesis in the VI Workshop in honour of Geoffrey J.D. Hewings (Santiago de Compostela, 2015), 8th Summer Conference in Regional Science (Kiel, 2015), XLI International Conference on Regional Science (Reus, 2015), XL International Conference on Regional Science (Zaragoza, 2014), XXXIX International Conference on Regional Science (Oviedo, 2013).
To my friends of A Coruña, Glasgow and Austin and of course those of Pontevedra that despite the distance they were always by my side.
Abstract
Chapter 1 derives a panel data econometric specification which relates the different factors that explain the pattern of economic growth in Spain along the 1989-2010 period. The growth of GDP per capita (GDPpc) in Spain up until the crisis of 2008 was characterised by strong job creation and productivity stagnation. Unlike other European countries, Spain did not experience the phenomenon of capital deepening with increasing productivity, as the GDPpc intense growth in Spain was of a rather extensive growth, mainly based on a capital widening process. After the crisis, the situation was dramatically reversed with productivity increases resulting from a brutal contraction of employment.
Chapter 2 analyse the main features which characterize the regional development in Spain since the launching of the European Cohesion Policy (1989) to the present. Over the last twenty years, Spain has stood out for the rapid growth of per capita income, capital accumulation and creation of employment. However, the most important structural phenomenon of growth of the Spanish economy, especially in the decade from 1998-2007, was the limited growth in terms of output per worker and total factor productivity (TFP), which in combination with wage increases has led to a loss of competitiveness for Spain both at global level and as at EU.
Paulino Montes-Solla, University of A Coruña
Resumen
El capítulo 1 se deriva una especificación econométrica de datos de panel que relaciona los diferentes factores que explican el patrón de crecimiento económico en España en el periodo 1989-2010. El crecimiento del PIB per cápita (PIBpc) en España hasta la crisis de 2008 se caracterizó por una fuerte creación de empleo y el estancamiento de la productividad. A diferencia de otros países europeos, España no ha experimentado un fenómeno de intensificación del capital con aumento de la productividad, ya que el fuerte crecimiento del PIBpc en España fue más bien un crecimiento de tipo extensivo, principalmente basado en un proceso de ampliación de capital. Después de la crisis, la situación se revirtió drásticamente con aumento de la productividad debido a una contracción brutal del empleo.
El capítulo 2 analiza los principales rasgos que caracterizan el desarrollo regional en España desde la puesta en marcha de la Política Europea de Cohesión (1989) hasta la actualidad. Durante los últimos veinte años, España ha destacado por un rápido crecimiento de la renta per cápita, acumulación de capital y creación de empleo. Sin embargo, el fenómeno estructural más importante de fuerte crecimiento de la economía española, especialmente en la década 1998-2007, fue el limitado crecimiento en términos de producción por trabajador y la productividad total de los factores (PTF), y en combinación con los aumentos salariales ha llevado a una pérdida de competitividad de España a nivel mundial y dentro tanto a la UE.
Resumo
O capítulo 1 derívase unha especificación econométrica de datos de panel que relaciona os diferentes factores que explican o patrón de crecemento económico en España no período 1989-2010. O crecemento do PIB per cápita (PIBpc) en España ata a crise de 2008 caracterizouse por unha forte creación de emprego e o estancamento da produtividade. A diferenza doutros países europeos, España non experimentou un fenómeno de intensificación do capital con aumento da produtividade, xa que o forte crecemento do PIBpc en España foi máis ben un crecemento de tipo extensivo, principalmente baseado nun proceso de ampliación de capital. Logo da crise, a situación se reverteu drasticamente con aumento da produtividade debido a unha contracción brutal do emprego.
O capítulo 2 analiza os principais trazos que caracterizan o desenvolvemento rexional en España desde a posta en marcha da Política Europea de Cohesión (1989) ata a actualidade. Durante os últimos vinte anos, España destacou por un rápido crecemento da renda per cápita, acumulación de capital e creación de emprego. Con todo, o fenómeno estrutural máis importante de forte crecemento da economía española, especialmente na década 1998-2007, foi o limitado crecemento en termos de produción por traballador e a produtividade total dos factores (PTF), que en combinación cos aumentos salariais ten levado a unha perda de competitividade de España a nivel mundial e dentro tanto á UE.
Introduction
El objetivo de la presente tesis doctoral es triple: a) Analizar los factores que influyen en el crecimiento económico y la productividad laboral de las regiones españolas a lo largo del periodo 1989-2010, b) Analizar si los patrones de localización geográfica de la actividad económica debido a las diferencias en la dotación de infraestructuras y acumulación de capital humano tienen influencia para el desarrollo en el caso español y c) analizar en qué medida los patrones de crecimiento observados en las regiones españolas pueden vincularse a la ayuda de los Fondos de la Política de Cohesión de la UE.
La investigación que se presenta en esta tesis doctoral se inicia (capítulo 1) con un análisis mediante datos de panel de la evolución de la productividad de la economía española para el periodo 1989-2010 y su explicación a través de la ecuación del modelo de Solow (1956) ampliado con las aportaciones de Aschauer (1989) sobre las infraestructuras, la cual ha recibido tanto elogios como críticas en la literatura reciente, y de Barro y Lee (1994) sobre el capital humano.
La evolución favorable de la economía española desde mediados de los años 90 hasta el inicio de la crisis de 2008 ha permitido una mejora notable de los niveles de desarrollo económico. El crecimiento del PIB per cápita (PIBpc) en España en la época de expansión se caracterizó por una fuerte creación de empleo y estancamiento de la productividad. A diferencia de otros países europeos, España no ha experimentado un fenómeno de intensificación del capital con aumento de la productividad, ya que el fuerte crecimiento del PIBpc en España fue más bien un crecimiento de tipo extensivo, principalmente basado en un proceso de ampliación de capital. Después de la crisis, la situación se revirtió drásticamente con aumento de la productividad debido a una contracción brutal del empleo.
A pesar de que el patrón de crecimiento de la economía española en la década de los años 2000 era frágil e insostenible en el largo plazo (capítulo 2) basado en una excesiva confianza en la integración económica en la UE, la evolución del crecimiento de las diferentes regiones españolas ha sido desigual. Para estudiar el comportamiento general de la economía española y de cada una de sus regiones se analizan los principales patrones de crecimiento en España y su desarrollo diferente respecto de la UE-15.
Para hacer frente a esta fragilidad de la economía española se proponen medidas necesarias para el aumento de la productividad: 1) mayor tamaño de las empresas para competir en un mundo cada vez más globalizado. 2) reorientación del patrón productivo español hacia actividades de mayor valor añadido y un uso más intensivo de las TIC. 3) Fomentar la comercialización de los resultados de la economía del conocimiento y la innovación tecnológica.
Paulino Montes-Solla, University of A Coruña
explicarán los principales aspectos y funciones que las inversiones comunitarias, principalmente de los Fondos de Cohesión y del FEDER, en infraestructuras de transporte y servicios públicos (telecomunicaciones, energía, agua, saneamiento...) si han supuesto un progreso de las regiones de los países del sur de Europa menos desarrolladas (Grecia, España y Portugal) para la unificación del mercado interno europeo.
TABLE OF CONTENTS
Acknowledgments ... 1
Abstract ... 3
Resumen ... 4
Resumo ... 5
Introduction ... 7
Chapter 1 - Regional development in Spain 1989-2010: Capital widening and productivity stagnation ... 11
1.1. Abstract ... 11
1.2. Introduction ... 13
1.3. Brief literature review ... 15
1.4. Empirical strategy ... 16
1.5. Data and descriptive statistics ... 19
1.6. Results ... 22
1.7. Conclusions ... 25
Chapter 2 - Regional development and structural change: The productivity paradox of Spanish peripheral regions ... 27
2.1. Introduction ... 27
2.2. Peripherality and backwardness in the Spanish regions ... 29
2.3. Economic Growth in Spain ... 31
2.3.1. A growth policy heavily based on investment ... 31
2.3.2. The contrast between per capita GDP and productivity ... 32
2.4. Productivity Drivers in Spanish Economy ... 34
2.5. Regional Disparities: Productivity and GDPpc in Spanish Regions ... 38
2.5.1. Regional GDPpc levels ... 38
Paulino Montes-Solla, University of A Coruña
2.5.3. Main patterns of evolution ... 41
2.5.4. Growth models ... 42
2.5.5. Spanish Regional Puzzle ... 44
2.5.6. Regional impact of economic crisis ... 44
2.6. Conclusions ... 46
Chapter 3 - Cohesion policy and transportation ... 49
3.1. Introduction ... 49
3.2. Cohesion Policy and Transport Infrastructure Networks ... 51
3.3. Growth Models and Development policy ... 54
3.3.1. Growth and Development synergies ... 54
3.3.2. Cohesion Policy and Growth Models ... 55
3.4. Spatial Structure and Agglomeration ... 57
3.4.1. Spatial Structure and Market Potential ... 57
3.4.2. Agglomeration economies and urban hierarchy ... 58
3.4.3. New Economic Geography and spatial structure trend ... 58
3.5. Accessibility ... 60
3.5.1. Transport infrastructures and accessibility ... 60
3.5.2. Substitution effects in transport networks ... 61
3.5.3. The new Europe 2020 Strategy and the TEN-T Network effects ... 62
3.6. Peripheral areas ... 62
3.6.1. Will peripheral areas ever be reach? ... 62
3.6.2. Infrastructures and growth enhancing regional policies ... 63
3.6.3. Innovation, distance and knowledge networks ... 65
Conclusions and Contributions of the Thesis ... 67
Conclusions ... 67
Contributions ... 71
Chapter 1 - Regional development in Spain 1989-2010: Capital
widening and productivity stagnation
1.1.
Abstract
This paper analyses the different factors that explain the pattern of economic growth in Spain along the 1989-2010 period. The results of our analysis provide strong evidence of stagnation in productivity throughout most of the period under study. The large investments and the strong growth in capital stocks were practically absorbed by an intense process of job creation. As a consequence, the capital/labour ratio and labour productivity levels remained almost constant whereas total factor productivity (TFP) decreased over the period of analysis. Therefore unlike other European countries, Spain did not experience a phenomenon of capital deepening with an increase in productivity. The intense GDP pc growth in Spain was of a rather "extensive" type, mainly based on a capital widening process.
Key Words: Regional Development, Infrastructures, Capital Widening, Productivity stagnation, TFP
1.2.
Introduction
Paulino Montes-Solla, University of A Coruña
The downward trend of total factor productivity (TFP) in the early 2000s is confirmed by the evidence provided by Mas and Quesada (2006) using panel model data together with longitudinal data by year and sector. Recently, Escribá and Murgui (2011) found similar patterns although their estimates are based on sectorial panel data focusing instead on the interregional variation in TFP.
This paper studies the determinants of labour productivity in Spain by means of the Solow model (1956) expanded with infrastructure and human capital. The model estimation is carried out using data for 17 Spanish regions (NUTs II level) over the period 1989-2010. The analysis in this paper focuses on the role of the various factors of production with special emphasis on the gap in transport infrastructure provision, private business capital and human capital and the evolution of TFP over time. The results of the estimation show a trend of stagnant productivity per employee and shrinking total factor productivity (TFP) during the intense phase of economic growth experienced in Spain from the late 90s until 2008. The econometric evidence is robust, but it is worth mentioning that the country also experienced a process of modernisation and diffusion of electronic, information and communication technologies during the period under analysis. In the last years the Spanish economy was also able to readjust their competitiveness and foreign balance. It is hard to unravel to what extent a productivity paradox could be present in Spain, but as Solow highlighted in 1987: "You can see the computer age everywhere but in the productivity statistics".
1.3.
Brief literature review
In the 1980s, within the extended Solow models, authors such as Aschauer (1989) and Munnell (1990) began to study the effect of infrastructure as a new production factor, trying to explain the drop in productivity experienced since the 60s by the world's most developed economies as a result of a lack of investment in infrastructure.
There is an extensive literature with arguments both for and against Aschauer’s theory on the effectiveness of public investment policies and economic growth (Tatom, 1991; Ford and Poret, 1991). Due to diminishing returns, investments made in an economy with a low provision of infrastructure should generate greater returns and economic growth than those experienced when the stock is greater. This indicates the existence of an optimal trajectory of public capital accumulation in infrastructure (Canning and Fay, 1993; Canning and Pedroni, 1999; Roller and Waverman, 2001; Calderón and Servén, 2004). Recent works have provided evidence of poor productivity developments since the mid-90s in European countries compared with other countries, mainly the United States (Mas et al., 2010; Fitoussi, 2013).
In relation to human capital as a productive factor (Barro and Lee, 1994), recent studies using the general equilibrium model of new geographical economics have shown that peripherality and low market access pose a significant penalty to the accumulation of highly qualified human capital (Lopez-Rodriguez et al., 2007, Redding and Schott, 2003). This suggests a new channel of influence of transport infrastructure and market access on private investment in the qualification of human capital. However, recent literature highlights that economies of agglomeration operate at “overlapping scales” and that important concentration forces are at work in metropolitan areas and central regions (Farole et al. 2011). An infrastructure network and good connections with central areas can result in a "pull effect" on long-term productivity growth by reducing business costs and facilitating mobility of qualified labour.
This paper focuses on a different aspect, which has not yet been fully studied yet for the period 1989-2010, the contribution of the various factors of production (with an emphasis on transport infrastructure capital) to productivity per employee and TFP in Spain. Other studies have made significant contributions on this subject with different methodologies such as the stochastic frontier (Pedraja et al., 1999; Delgado and Alvarez-Ayuso, 2004) or with a sector approach (De la Fuente and Vives, 1995; Cantos et al, 2002; De la Fuente, 2010).
Paulino Montes-Solla, University of A Coruña
year and production branches. Other previous studies on Spanish regions’ productivity and the inverse correlations found with employment levels and labour market performance are also worth mentioning (Maroto-Sanchez and Cuadrado-Roura, 2006; Cuadrado-Roura and Maroto-Sanchez, 2009, 2011; Escribá and Murgui, 2013).
Finally, it is interesting to note that the econometric analysis carried out in this article is based on the database compiled by the “Instituto Valenciano de Investigaciones Economicas” (IVIE) in connection with the “Fundación BBVA” (FBBVA). Furthermore, the conclusions drawn from this study substantially fit with the main findings pointed out in the productivity reports for Spain (FBBVA-Ivie, 2013 and La Caixa, 2007) and related documents issued by IVIE on the capitalisation of the Spanish economy.
1.4.
Empirical strategy
Drawing from the seminal paper by Aschauer (1989) on infrastructure provision and the contribution of Hall and Jones (1999) on human capital measured in efficiency units, we depart from a Cobb-Douglas expanded aggregate production function as follows:
Where Y measures the actual production of goods and services, Khum represents the
level of aggregate human capital, Kpriv represents the stock of corporate aggregate
capital, Kinf represents the stock of public capital (measured by infrastructure
capital), and finally, A stands for a measure of total factor productivity (TFP).
The expanded Cobb-Douglas production function provides an appropriate tool for analysing labour productivity in Spanish regions and estimating the elasticity values for the different production factors. Although some authors (Antràs, 2004) pointed out that this specification can overestimate or underestimate productivity related coefficients, this does not seem likely in the Spanish case as labour productivity in most Spanish regions has remained stagnant along a growth process mainly based on a process of capital widening.
Drawing from the contribution of Barro and Lee (2010), human capital is measured as the weighted average of the length of each educational level multiplied by the corresponding percentage of the working population aged 25-64. Accordingly, human capital is given by the following expression:
( ) ( ) ( ),
• ϕ(i,t)(s), denotes the stock of human capital per employee as the weighted average
Substituting this expression into equation (1), we obtain the next expanded
At this point, we introduce a growth path in total factor productivity (TFP) and break it down to two components. The first one captures the average cumulative
rate of growth along the time trend (λ.t), whereas the second one aims to estimate
the boost effect in TFP induced by increasing the rate of GDP invested in R&D. This way, TFP can be expressed as follows:
· 0
t t
A
=
A e
⋅
λ⋅ +µ ρ (4)Where λ·t represents the growth trend of TFP over time and μ·ρt corresponds to
the boosting effect of R&D intensity on the growth of TFP. Thus, ρt is defined as the
increase in the percentage of GDP spent in R&D across different years. In order to compare it with the time trend in TFP, we must approximate its average cumulative
rate of growth by means of λρ according to the following expression:
0
Introducing the new variable controlling for the R&D impact on TFP in the previous growth model (3), the final expression of the model becomes:
(
)
(
( ) ( ),)
( ) ( )Which expressed in a logarithmic form takes the following expression:
( )i t, 0 · t l ( )i t, l ( )( )i t, k priv( )i t, g inf( )i t,
LnY =LnA + ⋅ +λ t µ ρ δ+ ⋅LnL + ⋅δ ϕ s + ⋅δ LnK +δ ⋅LnK (7)
The contribution of every factor of production on the level of labour productivity (GDP per employee) can be estimated by breaking down the aggregate productivity per worker into the different production inputs and total factor productivity. Therefore, the expression (6) is reformulated as follows:
( )
Paulino Montes-Solla, University of A Coruña
Taking logarithms in expression (10), we obtain the first model (labelled as model A) estimated in this paper:
( ), 0 · ( )( ), po( ), po( ),
poi t t l i t k priv i t g inf i t
lny =lnA + ⋅ +
λ
tµ ρ δ ϕ
+ ⋅ s +δ
⋅lnk +δ
⋅lnk (11)• lnypo(i,t) denotes the level of labour productivity (GDP per employee) for every
region and year
• λ·t denotes the temporal trend of TFP for the entire set of Spanish regions1
• μ·ρt denotes the boosting effect of R&D expenditures on GDP growth to TFP in
the period
• ϕ(i,t)(s), denotes the stock of human capital per employee as the weighted average
of the duration of each educational level
• lnkprivpo(i,t), denotes the level of private or corporate capital per employee
• lnkinfpo (i,t) denotes the level of transport infrastructure capital per employee
The time span of the study is highly significant because it coincides with a period of strong devolution of public powers in Spain and a renovated effort in public investment, a large part of it aimed at improving regional transport infrastructures. This paper presents also another model, model B, where the impact of infrastructure capital is contingent on their relative provision levels, meaning that the effect of an increase in infrastructure capital on productivity depends on regional infrastructural gaps, which are measured as the relative distances to an adequate or optimal endowment of infrastructures, being that reference the level of the best-endowed and most developed region. This approach allows a more accurate analysis of the effect of transport infrastructure capital on the growth process of the Spanish regions.
Our index of comparative infrastructure endowments for each region (i) and every period (t), is calculated as the ratio of the capital stock of infrastructure in each region divided by the geometric mean (the square root of their product) of the population and the regional surface over the capital stock of infrastructures divided by the geometric mean of the population and the regional surface of the best endowed and most developed region. In this way, the values of the index are in the range (0,1] taking the value 1 for the best-endowed region and approaching to 0 for the worst performer region. The closer the index is to 1 the better endowed the region is. We have labelled this index as satindexit. Mathematically, the index is
defined in the following way:
1 Other studies have focused on sectorial variation (Mas and Quesada, 2006) and others in their
( )
Where i and t range, refer respectively to regions and years across the sample. The conditional effect of infrastructure is captured by a variable that embodies the dampening effect of bridging the gap of transport infrastructure endowments with regard to their suitable reference level. In this way, the effect of transport infrastructure capital is treated as contingent on the relative levels of infrastructural endowments modulated by the saturation index:
( ) ( )
, , , , po
i t i t po i t i tinf
satindex lnkinf =satindex ⋅lnk (13)
The introduction of this new variable replacing capital stock in infrastructure provides an alternative estimation to model A to estimate the relative influence of production factors on productivity per employee. This alternative estimation is labelled in the paper as model B and takes the following expression:
( ), 0 · ( )( ), po( ), , po( ),
poi t t l i t k priv i t g i t inf i t
lny =lnA + ⋅ +
λ
tµ ρ δ ϕ
+ ⋅ s + ⋅δ
lnk + ⋅δ
satindex lnk (14)• lnypo(i, t) represents the log of labour productivity for every region and year
• λ·t represents the temporal trend of TFP for the entire set of Spanish regions • μ·ρt denotes the boosting effect of R&D expenditures on GDP growth to TFP in
the period ϕ(i,t)(s), represents the stock of human capital per employee as the
weighted average of the duration of each educational level
• lnkprivpo(i,t), represents the log of private or corporate capital per employee
• satindexi,tlnkinfpo,i,t denotes the new variable resulting from modulating regional
levels of infrastructure capital by their saturation indexes (distance to the reference level of the best-endowed region at the end of the period).
The longitudinal combination of time and cross-sectional data (panel data) allows for coping with unobserved heterogeneity and minimises the possibility of estimating errors. However, the Wooldridge and Wald tests respectively detect problems of autocorrelation and heteroscedasticity in our sample. Due to the existence of heteroscedastic errors, we use panel-corrected standard errors (PCSE) in order to control for these problems. This methodology is applied to the estimation of the two models proposed in the paper, named model A and B.
1.5.
Data and descriptive statistics
Paulino Montes-Solla, University of A Coruña
the BBVA Foundation-IVIE for the Spanish economy, with two sections providing regional data on Capital Stocks and Human Capital in the Spanish Economy.
This database has been consistently developed in accordance with the methodological criteria recommended by experts and international institutions in order to facilitate comparative international analysis. Furthermore, it satisfies usual reliability conditions and has been incorporated in other international databases (STAN, PDB and PDBi2) of the OECD and the EU KLEMS project (elaborated within
the EU research policy, Sixth Framework Programme). Finally, it is worth mentioning that all monetary variables used are expressed in euros at constant 2000 values.
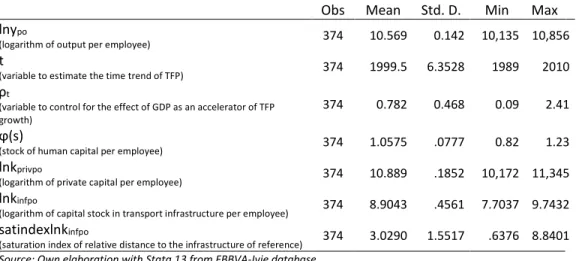
Tables 1 and 2 show the descriptive statistics of the variables used in the two models estimated in the paper.
It is worth highlighting that the database is a strong balanced panel with a full set of observations (374) with no values missing for any of the variables used in the analysis.
Table 1: Summary and description of variables
Obs Mean Std. D. Min Max lnypo
(logarithm of output per employee) 374 10.569 0.142 10,135 10,856
t
(variable to estimate the time trend of TFP) 374 1999.5 6.3528 1989 2010 ρt
(variable to control for the effect of GDP as an accelerator of TFP
growth) 374 0.782 0.468 0.09 2.41
ϕ(s)
(stock of human capital per employee) 374 1.0575 .0777 0.82 1.23
lnkprivpo
(logarithm of private capital per employee) 374 10.889 .1852 10,172 11,345
lnkinfpo
(logarithm of capital stock in transport infrastructure per employee) 374 8.9043 .4561 7.7037 9.7432
satindexlnkinfpo
(saturation index of relative distance to the infrastructure of reference) 374 3.0290 1.5517 .6376 8.8401
Source: Own elaboration with Stata 13 from FBBVA-Ivie database
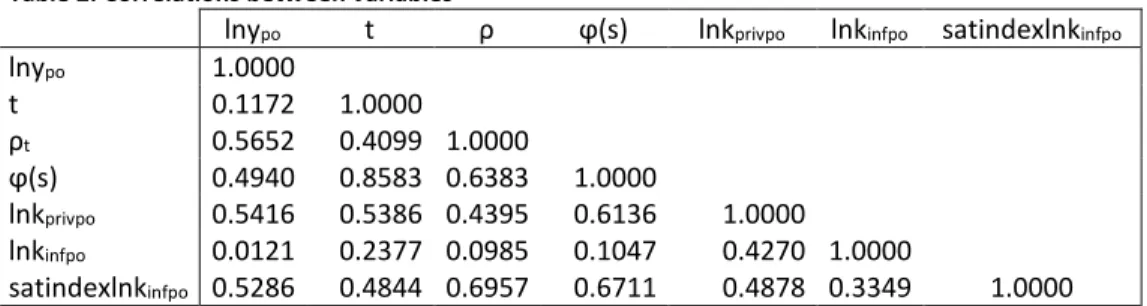
To explore the relationship between the different variables in the model, the correlation matrix in table 2 shows the direction and intensity of the correlation coefficients between all the variables in the model. It can be observed that all the variables have positive relationships between them, although there are differences in their intensities.
2 Structural Analysis Database (STAN), Productivity Database (PDB) and by Industry Productivity
Table 2: Correlations between variables
Source: Own elaboration with Stata 13 from FBBVA-Ivie database
The evolution of capital per employee in the Spanish regions, depicted in graph 1, clearly shows a stagnation path along the central part (1994-2005) of the period under study. In spite of large volume investments and increasing capital stocks, the ratio of capital per employee remained constant in most shows the fast and important process of growth of GDP per capita in Spain during the period of 1999-2007. However, this intense development process was linked to a strong expansion in employment (both employed and working population) and the majority of the large investments were mainly absorbed by a strong jobs creation process with almost no capital deepening and technological improvement in TFP. Consequently, as shown in the upper part of graph, productivity per employee (GDP/employee) stagnated or even declined in Spain from the late 90s until the outbreak of the 2007 crisis.
Graph 1: Capital per employee (regression and median line)
Source: Elaborated from FBBVA-IVIE database
Graph 2: Labour productivity and output pc (median lines)
Source: Elaborated from FBBVA-IVIE database
5000
1989 1992 1995 1998 2001 2004 2007 2010
year
GDPpe Median GDPpe
Paulino Montes-Solla, University of A Coruña
Both Graphs 1 and 2 together provide a visual image of the most prominent features of the growth process in Spain: 1) Stagnant capital ratio per employee and absence of capital deepening, 2) intense growth of per capita income driven both by job creation and increases in the working population, and finally 3) a serious stagnation problem in productivity per employee and a decline in TFP. These problems together with other unbalances (huge foreign payments deficit and high private indebtedness) made Spain highly vulnerable to the impact of the 2007 crisis.
1.6.
Results
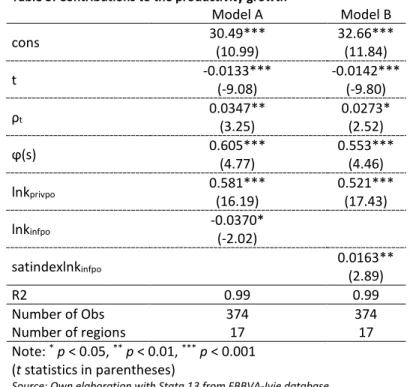
Table 3 reports the results of the coefficients estimated for the two models used in the analysis. The first model (model A) uses a log transformation of regional levels of infrastructure capital, lnkinfpo, whereas the second, (model B), uses a more helpful variable, the satindexlnkinfpo, aimed at capturing regional distances to an adequate reference level of infrastructure endowments. This latter variable modulates regional levels of infrastructure stock using a saturation index built by taking into account regional surface areas and the population, as well as distances to the most convenient infrastructure standard in the best-endowed, most developed region along the whole period (the reference level is placed in the last years of the period, being Madrid at 2010).
Table 3: Contributions to the productivity growth
Model A Model B
cons 30.49*** (10.99) 32.66*** (11.84) t -0.0133*** (-9.08) -0.0142*** (-9.80)
ρt 0.0347** (3.25) 0.0273* (2.52) ϕ(s) 0.605*** (4.77) 0.553*** (4.46)
lnkprivpo 0.581*** (16.19) 0.521*** (17.43)
lnkinfpo -0.0370*
(-2.02)
satindexlnkinfpo 0.0163** (2.89)
R2 0.99 0.99
Number of Obs 374 374
Number of regions 17 17
Note: *p < 0.05, **p < 0.01, ***p < 0.001
(t statistics in parentheses)
Model A, corresponding to equation (11), shows that the variables with the greatest influence on productivity per employee in Spain are private capital (0.581) and human capital (0.605). Both coefficients in a double logarithmic equation are estimators of the correlative elasticity of both variables on productivity per employee. The variable transport infrastructure capital is only significant at the 5% level and its sign is the opposite to that expected (-0040). An interesting result in model A is that efforts in R&D expenditure boost growth of TFP. The coefficient of
ρt is significant at the 1% level and its estimated value (0.0347) means that an
increase of 1% in the average annual cumulative rate of growth of the share of R&D expenditure on GDP, induces an additional growth of 0.0347 percentage points to
the average cumulative TFP rate of growth. The coefficient of ρt can be translated
in terms of a component of the cumulative rate of growth of TFP by applying expression (5). In this way, it can be estimated that the effort in R&D expenditures contributed around 0.0014 to the period. However, the time trend of the TFP in the period is negative with an average cumulative rate (λ) of -0.013 and consequently R&D expenditure effort was insufficient to correct this tendency with the net value of the cumulative rate of growth of TFP in Spain along the whole 1989-2010 period reaching -0.012.
In line with the previous model, the model B estimation (based on equation 14) again shows private capital (0.521) and human capital (0.553) to be the most influential variables on the levels of productivity per employee.
However the new variable (santindexlnkinfpo) which intends to capture the impact of
regional transport infrastructure capital as contingent on the degree of saturation of the comparative infrastructure endowments, performs considerably better than in the previous model. As reported in Table 3, capital stock in transport infrastructure conditioned by the saturation index makes a significant and positive contribution (0.0163) to productivity levels. This estimated value corresponds to a standard value of the saturation index equal to 1. Consequently, for regions and time periods with saturation indices below the standard of reference, the elasticity
of output per worker with regard to infrastructure endowments (δg) must be
Paulino Montes-Solla, University of A Coruña
exception of the reinforced role played by transport infrastructure capital in regions lacking adequate endowments, the results from both models are relatively similar.
These results are in line with the previous studies that analyse the role of private capital and transport infrastructure at regional growth. De la Fuente and Vives (1995) and De la Fuente (2010) show evidence that public investment in infrastructure had a positive impact on production and employment in Spain and that convergence in the retributive levels of human capital between Spanish regions had been encouraged since accession to the EU. De la Fuente also notes that this process could involve a significant cost in terms of efficiency. In addition, Delgado and Alvarez (2004) and Pedraja et al. (1999) obtained similar results for private capital and infrastructures, measures in physical units, with a methodology based in a production function with a stochastic efficiency frontier. Moreover, Cantos et al. (2002) indicates that the infrastructures had an important role in economic growth of Spanish regions between 1965 and 1995.
These results confirm, once again, the problems of productivity stagnation along the phase of rapid growth in Spain over the 1989-2010 period. Apart from a possible "productivity paradox" (given that the country experienced a major change in its efforts in R&D expenditures and ICT diffusion3), evidence shows a
serious problem of productivity in the growth model of Spain in the period. The intense investment effort was not accompanied by increased TFP or by capital deepening to increase labour productivity. The increase in capital stock was mainly absorbed by a strong growth of employment (both employees and the working population) in a clear capital widening process lacking sufficient improvements in production technology and in productivity per employee. There seems to be a “trade off” between employment and labour productivity in Spain as the productivity per employee stagnated during the growth and employment boom, whereas productivity increased once again following the 2008 crisis and the subsequent recession and brutal employment adjustments with a dramatic number of jobs destruction.
Overall, the process of the growth of the Spanish economy has been characterised by an intense rate of expansion of both GDP and of the employed population (with high rates of growth of GDP per capita) during the economic boom which started in the late 90s and lasted until the outbreak of the financial crisis of 2007 and its subsequent impact. Following 2008, the situation changed dramatically with a contraction in economic activity and strong job destruction, a brutal employment adjustment that finally led to increasing productivity.
3 The share of households with broadband access to Internet grew from 38% in 2006 to 57.8% in
1.7.
Conclusions
The results of our paper show evidence of the “extensive” nature (mere capital widening) of the intense growth process experienced by the Spanish economy along the 1989-2010 period. Economic growth in Spain was based on large investments and a strong path of capital accumulation but capital increases were mainly absorbed by extensive job creation and strong employment growth (both in the working and employed population). Evidence strongly supports a mere process of capital widening without triggering any significant increases in productivity per worker due to a capital deepening process or an improvement in TFP. On the contrary, there is evidence of a persistent decline in TFP at an average cumulative rate of over 1%.
It is worth highlighting that efforts in R&D expenditure were a significant driver of TFP growth. However, despite its rapid growth since the late 90s, R&D expenditure levels remained low and insufficient to reverse the negative trend of TFP. This again confirms the extensive nature and mere capital widening process of the intense growth experienced by the Spanish economy from the late 90s until the outbreak of the economic crisis.
Investment in infrastructure has proved to be extremely important in the less advanced regions of Spain, which did not have sufficient transport infrastructure to improve the functioning of the economy or its human capital. However, once the region reaches the minimum adequate level of market accessibility, the impact of infrastructure on productivity growth is reduced significantly. This is due to the nature of transport infrastructure, as their positive impact on productivity improvements in other productive factors but nevertheless this impulse is not reciprocal.
Chapter 2 - Regional development and structural change: The
productivity paradox of Spanish peripheral regions
2.1.
Introduction
Over the last twenty years, Spain has stood out for the rapid growth of per capita income, capital accumulation and creation of employment. However, the most important structural phenomenon of the strong growth of the Spanish economy, especially in the decade from 1998-2007, was the limited growth in terms of output per worker and total factor productivity (TFP), which in combination with wage increases has led to a loss of competitiveness for Spain at global level and within both at a EU.
The growth of an economy is determined by its ability to accumulate productive factors (capital and labour) and the productivity with which these factors are used. Specifically, the way in which productivity behaves is a key factor in the capacity for long-term growth potential of any economic space (Krugman, 1990). In this case it is convenient to have information on trends in terms of output per worker (apparent labour productivity) and the main variables that affect it. The apparent labour productivity or productivity measures the output obtained for each labour unit in the production process (the number of people employed in production)4,
thereby making it an indicator of productive efficiency. However, this is a partial indicator, as it can be directly influenced by the quantities used of other factors, specifically the capital-labour ratio, as well as the human capital itself and the technological characteristics of the production processes of the economy.
The aim of this chapter is to analyse the main features which characterize the regional development in Spain since its accession to the EU (1986) and the effective launching of the European Cohesion Policy (19895).
4 Nevertheless, labour productivity is influenced by the technology that is available, the composition
of the work and the amount of remaining production factors used.
5 The new European Cohesion Policy (formally introduced by the Single European Act in 1987) was
2.2.
Peripherality and backwardness in the Spanish regions
The pioneering study by Redding and Schott (2003) developed a theoretical explanation for the difficulty that peripheral regions have to achieve high levels of income and wealth, showing that the most highly qualified types of work are typically concentrated in industrial sectors (or localised).
The central countries are specialised in highly qualified sectors, while the peripheral areas have to compensate their competitive disadvantage of having less access to the markets with lower salaries and payments. This effect reduces the benefits of salaries paid to highly qualified workers, and reduces any incentives towards investing in human capital. In the EU there is empirical evidence of a spatial structure of educational attainment levels that takes the shape of a positive correlation between market access and the number of years spent in education, as well as between the percentage of the population with the high educational levels and market access (Lopez-Rodriguez, Faiña and Lopez Rodriguez, 2007).
As a result, the peripheral regions, lacking corrective measures, focus on poorly qualified human capital, and their populations will have lower levels of academic achievement. This also applies to specific and qualified resources, meaning that peripheral locations with low access to the main markets constitute an important penalty for their growth and convergence to the most centrally located and advanced ones.
Apart from the forecasts regarding the dynamics affecting the spatial concentration of economic activities, geographical economics models (Head and Mayer, 2004, 2006) explain the significant differences in wages and per capita income (nominal wage equation) between peripheral and central areas, extensively supported by the empirical estimation of the nominal wage equation of different settings (Lopez-Rodriguez and Faiña, 2007; Lopez-(Lopez-Rodriguez et al. 2007b; Redding and Venables, 2004; Hanson, 2005; Mion, 2004; Garcia-Pires, 2006).
Figure 1 shows the spatial structure of the European Union, considering all of the countries belonging to the European economic space, including Norway and Switzerland. Europe’s economic activities are concentrated in a large central area (London-Paris-Ruhr), with successive concentric lines of decreasing accessibility to the markets, in a sort of core-periphery pattern or centre-periphery gradient together with the areas of concentration in the north of Italy.
Paulino Montes-Solla, University of A Coruña
The right side map at the bottom of Figure 1 describes the spatial structure of the Iberian Peninsula. In Spain, it can be seen that there is a clear difference in terms of accessibility to the markets between the North-East quadrant which takes in Basque Country, Madrid and Catalonia and the rest of the peripheral areas in the centre of the peninsula (Castile and Extremadura) the South in Andalusia and Murcia, and in the Atlantic North-West, corresponding to Galicia and Asturias.
Traditionally, the areas in the North-East quadrant, closest to the rest of Europe and with the greatest market access correspond to the most developed parts of the country, with a large percentage of population and economic activities, and generating the highest levels of growth and per capita income. These regional differences in the development of Spain can be seen in the top right side map of Figure 1.
The accession of Greece, Spain and Portugal to the EU was followed by a change in the Economic and Social Cohesion Policy (European Single Act, 1987), which from 1989 onwards dedicated a significant part of its resources to regions with structural development deficits (known as Objective 1 regions). Countries within the EU experienced a significant convergence in terms of per capita income, although at regional level there are more doubts regarding convergence and the reduction of differences in terms of growth and per capita income.
The traditional approach towards dealing with the adverse effects of remoteness focused on improving access and reducing distance costs by improving transport infrastructures (roads, railways, ports and airports). However, the current growth models have been extended to include the importance of human capital, emphasising the movement of the economy towards services, improving technologies and significantly reducing transport costs, as well as the development of ICTs, eliminating trade barriers and promoting greater European integration, to help soften the adverse effects of remoteness.
In the case of Spain, its peripheral location and size were combined with a major lack of capital provisions at public and private level. The resources provided by the EU’s regional policy allowed for an extensive investment programme focusing on
Figure 1: Spain and spatial structure of European Economic Space
territorial integration and providing access to the markets for Spanish regions (most of which were in peripheral regions), as well as improving environmental infrastructures, education and health (human capital) and the capital and business capacities of the productive system.
The result was an important process of economic development, with cumulative growth rates in per capita income well above the average for the former EU15 in the period 1989-2010. In Spain, this convergence in per capita income also applies to all its regions, including the most peripheral and underdeveloped ones, which grew faster than the EU15 average.
2.3.
Economic Growth in Spain
2.3.1.
A growth policy heavily based on investment
One of the most relevant features of the growth process in Spain is the fact that it was driven by a major process of investment and accumulation of capital.
The graphics in both sides of Figure 2 show the evolution of the capital stock and the investment effort of the Spanish economy from 1989 onwards. The stock of real (net) capital more than doubled during the period 1989-2010. However, despite starting out with low capital stock volumes, the period with the highest investment effort in terms of the ratio investment/capital stock was not the initial period between the end of the 1980s and early 90s, but instead the booming period of the Spanish economy was from 1997 until 2007, when as a result of the current economic downturn and subsequent recession, the investment effect decreased and the accumulation of capital of the Spanish economy slowed down (FBBVA-Ivie, 2013).
Figure 2: Evolution of the capital stock and investment effort of the Spanish economy (1989-2010) Evolution of the capital stock (1989=100) Investment effort
Source: Own elaboration from the database of FBBVA-IVIE, 2013
The drop in income and adjustments with high unemployment rates hinder the sustainability of a model with large stocks of capital, as depreciation starts to represent a very significant proportion of reduced flows of investment (FBBVA-IVIE, 2013). The consequences of the drop in investment were dramatic, and capital
100
1989 1992 1995 1998 2001 2004 2007 20 Net capital stock
1989 1992 1995 1998 2001 2004 2007 20
Paulino Montes-Solla, University of A Coruña
depreciation rose to very significant percentages of the investment (more than 80% in 2010).
As a result of this major process of capital accumulation, the operating conditions of the Spanish economy changed dramatically, and the depreciation of the capital stock began to absorb very significant parts of the total GDP (see figure 3).
At the initial stages of growth in Spain (including the 1980s and 1990s), the lack of infrastructures and capital provisions were so significant that it was taken as read that the marginal productivity of investments in the renewal and extension of stocks (especially in cases of fixed capital with long useful lives) was very high. However, the situation changed dramatically in the 2000s, and investments with excessively high forecasts during the boom in growth and the housing bubble aggravated the problem of the loose consideration of the cost efficiency and sustainability of a substantial percentage of the major investments planned in an exponential stage of outlooks for growth in the GDP and the population (immigrants, residents from other countries, tourists, etc.).
2.3.2.
The contrast between per capita GDP and productivity
The increase in endowments of productive factors in the Spanish economy led to a significant process of development from 1989. Table 1 shows the reference values for Spain and the EU15 at constant 2000 prices (figures in euros).
Table 4: Productivity and GDP per capita in Spain vs EU15 (thousand euro, constant value 2010)
1989 1999 2007 2010 ρ 89-99 ρ 99-07 ρ 07-10 EU15 GDP/per employee GDP/per capita 44,331 19,207 51,588 22,492 55,678 25,573 55,590 24,557 1,52% 1,58% 1,60% 0,95% -0,05% -1,35%
SPAIN GDP/per employee GDP/per capita 36.060 11.937 40.071 14.910 38.815 17.671 41.138 16.819 1,05% 2,20% 2,10% -0,40% 0,73% -0,60% % SPAIN /
EU15 GDP/per employee GDP/per capita 81,3% 62,1% 77,7% 66,3% 69,7% 69,1% 74,0% 68,5%
ρ =cumulative rate of growth, coefficient of time exponential growth function (in differences divided by no. years)
Source: EU15 data from Cambridge Econometrics, Spain data from IVIE.
GDPpc in Spain grew at a cumulative rate greater than 2% and caught up with the EU15 average; the GDPpc ratio increased from 62% in 1989 to 69% in 2007. However, productivity was a serious drawback in the Spanish development and convergence process. Labour productivity (output per worker) was not able to follow the path of GDPpc Spain and the productivity gap between Spain and the
Figure 3: Investment and depreciation in M€ constant 2000
EU15 widened from 20 to 30 percentage points, the comparative level Spain’s productivity fell from 81% in 1989 to 70% of EU15 average in 2007. Labour productivity in Spain grew at a 1% cumulative rate during the period 1989-1999, considerably less than GDPpc (2.2%) and well below the 15-member EU average (1.5%). Furthermore, during the growth boom of the period 1999-2007 labour productivity was stagnated in Spain.
A characteristic and somewhat anomalous feature of Spain’s growth is the fact that the convergence in terms of per capita income with regard to the EU15 did not go hand-in-hand with convergence in terms of output per worker. This is also an important drawback for the global competitiveness of the Spanish economy which was affected by the productivity decline observed in the European countries with regard to productivity in the most dynamic world economies, especially USA since mid-1990’s6.
Labour productivity only began to recover as a result of the tough readjustments that were made through the devastating effect on employment of the acute and prolonged recession that continues to affect the Spanish economy since last quarter of 2007. The accumulative downturn in per capita income terms in Spain was 1.3%, signifying a major decrease with regard to the average for the EU15 (-0.05%) and a major increase in unemployment, reaching 25% in 2012.
Growth was not uniform over the period, and the growth in per capita income was affected by the crisis of 1992, although from 1994 onwards there was a period of sustained growth until the outbreak of the current crisis in 2008. On the contrary, the growth of labour productivity (output per person in employment) followed a very different and contrary path. It grew significantly in the 1990s, growing rapidly from 1989, and then slowing down from 1995 onwards, and then following a downward trend from 1998 until the outbreak of the current economic crisis. Figure 4 below illustrates these patterns.
The top of Figure 4 shows the trends for per capita income for the country as a whole, differentiating between the less developed Objective 1 regions and the others. During the first few years of the period, the Objective 1 regions converged in terms of per capita income, then decreasing quite significantly during the 1990s, to once again converge during the growth period in the 2000s.
The bottom of Figure 4 shows the trends in productivity of the Spanish regions at constant 2000 prices (euros). Here we can see that there was a significant growth in the first few years, a turning point around 1994, followed by a marked decrease from 1999 onwards, precisely during the process of a significant economic growth from the end of the 1990s, accompanied by a major increase in the population (with high immigration rates) and employment rates that reduced the average labour productivity.
6 This fact was broadly in examined literature, see among others European Commission (2007),
Paulino Montes-Solla, University of A Coruña
The contrasting development of growth of per capita income and labour productivity, a feature of the Spanish growth process, can once again be seen in the growth rates of the Objective 1 regions in comparison to those of the more developed regions. Convergence in terms of productivity slowed down during the period of greatest growth, becoming more acute during the major downturn in employment as a result of the current economic crisis. This crisis and the recession from 2007 onwards have led to major adjustments with high job losses, focused on less productive jobs, resulting in a peak in terms of output per worker during the years of the crisis, at the expense of employment.
However, as we will see later on, the two groups of regions (the most developed and the Objective 1 regions) do not display common growth patterns at internal level. In particular, during the boom in growth from the end of the 1990s until 2007, the growth patterns in terms of increased employment and productivity crisscrossed between regions with very different levels of development, instead configuring a dynamic focused on the bipolarity of a major increase in production, the population and total employment, and a fall in labour productivity compared to more moderate rates of growth together with increases in productivity, although always below the EU15 average.
2.4.
Productivity Drivers in Spanish Economy
The contrast between high growth in terms of per capita income and stagnation in terms of labour productivity in the Spanish economy, together with the contrasting development of regional differences in terms of per capita income and output per worker is a surprising phenomenon which is more complex than it might initially appear.
In accounting terms, per capita income (the same as its accumulative growth rate) can be broken down into the product of the productivity per employment and the
Figure 4: GDPpc and Productivity by regions (1989-2010) GDPpc by Objective 1 and Non Objective 1 regions
Productivity by Objective 1 and Non Objective 1 regions
Source: Own elaboration from IVIE dataset.
65%
1989 1992 1995 1998 2001 2004 2007 2010
Objective 1 Non objective 1 Obj1 / Non Obj1
71%
1989 1992 1995 1998 2001 2004 2007 2010
share of employment in total population-employment ratio (in the total of the accumulative rates of productivity growth and the occupation ratio).
= .
y Labour productivity Employment to Population ratio
pc
= = ⋅ ⋅
= ⋅ − − −
(15)
The simple breakdown of the per capita income into its two factors of output per worker and employment clearly shows that since entering the EU, Spain has developed significantly with an extensive growth model mainly driven by the enlargement of productive endowments and employment. The growth of per capita income was mainly due to the increase in the employment ratio, and even during the period 1999-2007 employment increased so quickly that it easily compensated for the drop in productivity.
However, the growth process in Spain was associated with significant social and economic progresses, seen in a wide variety of indicators ranging from the increases in female participation in the labour market and a rise in the educational level of the population, to the internationalisation and opening to foreign trade of the economy, and including major investments and high rates of growth for the capital and resources associated with ICT and R&D+I. On the other hand, human capital has played an important role in Spain’s TFP, efforts to improve the stock of human capital in Spain over the last few decades has made possible the approach to the average of the OECD countries. This improvement has also strengthened the ability of Spanish companies to learn and absorb new technologies, and has had a significantly beneficial impact on the improvements in productivity (Cubel et al., 2011)
Paulino Montes-Solla, University of A Coruña
Martinez, Rodriguez and Torres (2008) studied the Spanish evidence on a productivity paradox of the new economy in the sense of the famous statement by Robert Solow (New York Times Book Review, July 12th 1987) that “the computer age
[was seen] everywhere, except in the productivity statistics”. A computable general equilibrium model (with labour and six types of capital assets for calibrating the cost shares of the productive factors) is used to identify the sources of productivity growth in Spain during the late 90’s and early 2000’s, which are compared with the evidence available for the US and other countries. A negative tendency in TFP is also found for Spain, although an interesting conclusion is reached on the transition process: “the relevant (but potential) benefits of ICT need time to come true [and spill over the whole economy]. Adjustment costs and inefficiencies derived from inappropriate qualifications in the labour force lead to transitional dynamics in which productivity suffers low and even negative growth rates” (Martinez, Rodriguez and Torres, 2008).
An extended Solow growth model was estimated with panel data for the Spanish regions to measure the contribution of different factors of production (with special interest in the stock of private and human capital, as well as the gap of transport infrastructure capital) to the productivity of labour and the temporal evolution of TFP over the period 1989-2010 (Montes-Solla, Faiña, and Lopez-Rodriguez, Forthcoming). Output per worker is explained by means of a Cobb-Douglas production function of the per worker stocks of private and human capital, as well as the transport infrastructure capital weighted by the inverse of a saturation index (the relative lack of capital to reach a convenient provision of transport infrastructure endowment per worker). The latter variable is intended to capture the conditional or moderating effect of infrastructure endowment saturation over the influence of transport infrastructure investments to increase the output per worker7. The model is linearized by means of log transformation and the
cumulative rate of growth of total factor productivity (TFP) is estimated by means of an exponential function of time (the variable year) jointly with the share of RTD expenditure on regional GDP in each period of time8.
The results are significant and consistent with the evidence provided in the previous works. The Cobb-Douglas expanded production function provides a suitable tool to explain the output per worker in the Spanish economy and provides accurate estimates of its elasticity to the endowments of productive factors (the
7For this purpose, an index of infrastructure provision is calculated by dividing the capital stock of
infrastructure by the geometric mean of the population and the regional area (the square root of the product of the two) and then draws on the increased regional provision of infrastructure (in our database it corresponds to Madrid in 2010) to which the index value 1 terrestrial infrastructure endowment is allocated. For other regions and years, rates below saturation (satindex2) are constructed to capture the relative distance to the reference infrastructure
8 TFP trend is estimated by means of the expression: ·
( ·λ⋅ +t µ ρt)= + ⋅ +λ µ ρ·
t
stocks of private and human capital and the stock of infrastructure weighted by regional relative distances to saturation along the period). Furthermore, the cumulative rate of growth of TFP is estimated by the coefficient of the year variable and the accelerating variable linked to the regional RTD shares on GDP.
Estimations show that the most influential variables on labour productivity are the stock of private capital per worker (elasticity of 0.51) and human capital per worker (elasticity of 0.46). This is in line with other studies’ findings on human capital as one of the most important determining factor of the per capita income, labour productivity and economic growth, as it has clearly direct and indirect effects on these areas. A higher level of education leads to increased labour productivity, and in an environment of market efficiency, greater business incentives to invest in physical and technological capital (Doménech, 2008).
The capital stock per worker in transport infrastructure takes a small but significant positive value (elasticity of 0.02), which corresponds to a saturation index equal to 1 (the case of the best endowed region, Madrid in the year 2010). However, this elasticity increases for other regions and time periods due to the multiplier effect of saturation indexes lower than one9, as for example in the peripheral regions
such as Andalusia and Galicia, where capital infrastructure elasticity values were respectively 0.066 and 0.053 in 1989, 0.035 and 0.025 in 1999, and finally fell to 0.024 and 0.016 in 2010. These results are in line with previous studies (De la Fuente, 2010) providing evidence that public investment in infrastructure has had a positive impact on production and employment in Spain and promoted income convergence among regions, especially since the Spanish accession to the EU. However, turning to the regional redistribution of investments in infrastructures, it has probably had significant efficiency costs.
The time trend of TFP reached an average cumulative decreasing rate of around -0.013, whereas the share of RTD on GDP was a significant driver of total factor productivity (TFP) growth with an estimated coefficient of 0.031. However, the low levels of RTD shares in Spain, despite their rapid growth since the late 90s, were insufficient to overcome the extensive nature of the Spanish economic growth model. Overall, the results for the TFP rate of growth, as a result of both components (time trend and the RTD shares), show that output per worker was lower than their potentially expected values once the amounts of investment are taken into account. Total Factor Productivity (TFP) in Spain experienced a negative rate of growth of around -0.012 (cumulative annual average) confirming the markedly "extensive" nature of the growth process in Spain10.
9The elasticity of output per worker to the stock of capital in infrastructure endowments, δg, is
obtained by dividing the estimated coefficient by the inverse of each region saturation index at each period of time.
10Other estimates with different objectives have focused on the interregional variation of TFP with a
Paulino Montes-Solla, University of A Coruña
2.5.
Regional Disparities: Productivity and GDPpc in Spanish Regions
2.5.1.
Regional GDPpc levels
The average personal income in Spain grew more rapidly than the UE-15 average, if calculated at constant prices (base year 2000). This convergence process of the Spanish regions along with the UE-15 was much higher in terms of Purchasing Power Standards (PPS), unity measure used by the Cohesion Policy, which triggered the exit of the majority of the Spanish regions from Convergence Objective (known before as Objective 1). Regional disparities in GDP per capita show an increase between years 1989 and 1999, followed by an also important decrease during the period 1999-2007. The outbreak of the current economic crisis in Europe has increased again the economic divergence among the Spanish regions11.
As can be seen in Table 5 below, Regional disparities in terms of GDP per capita experienced an important increase between 1989 and 1999, next they were reduced to a comparable extent along the growth boom 1999-2007 and finally they increased again in the years of the current economic crisis.
Table 5: GDP per capita in Spain (thousand euro, constant value 2010)
GDP/POP 1989 1999 2007 2010 ρ 89-99 ρ 99-07 ρ 07-10
Source: Own elaboration from IVIE dataset
Nevertheless, the distribution by relative development ranges of the Spanish regions did not experience much changes throughout the period 1989-2007 In this case, four ranges of development are taken as a reference: 1) The highest one above the average plus ½ of the standard deviation; 2) The mid-high (between the average and the average plus ½of the standard deviation); 3) The mid-low (below the average and the average minus ½of the standard deviation); 4) The lowest one below the average by more than ½of the standard deviation.
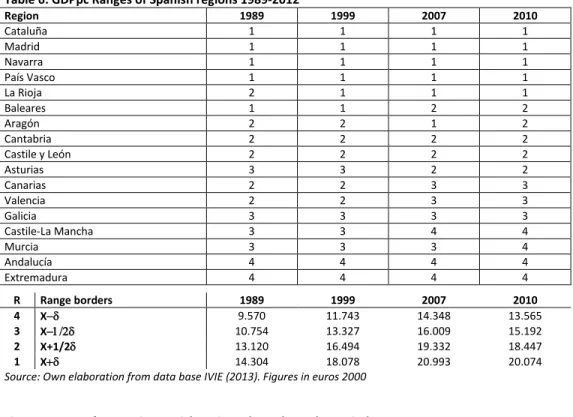
The Table 6 shows the distribution of the Spanish regions by ranges of GDPpc along the period 1989-2010. Figure 5 provides their map plots for the years 1989 and 2007 (2010 map did not differ from 2007).
11 The process of convergence (measured in constant euro, taking 2000 as the year base) is
Table 6: GDPpc Ranges of Spanish regions 1989-2012
Region 1989 1999 2007 2010
Cataluña 1 1 1 1
Madrid 1 1 1 1
Navarra 1 1 1 1
País Vasco 1 1 1 1
La Rioja 2 1 1 1
Baleares 1 1 2 2
Aragón 2 2 1 2
Cantabria 2 2 2 2
Castile y León 2 2 2 2
Asturias 3 3 2 2
Canarias 2 2 3 3
Valencia 2 2 3 3
Galicia 3 3 3 3
Castile-La Mancha 3 3 4 4
Murcia 3 3 3 4
Andalucía 4 4 4 4
Extremadura 4 4 4 4
R Range borders 1989 1999 2007 2010
4 X−δ 9.570 11.743 14.348 13.565
3 X−1/2δ 10.754 13.327 16.009 15.192
2 X+1/2δ 13.120 16.494 19.332 18.447
1 X+δ 14.304 18.078 20.993 20.074
Source: Own elaboration from data base IVIE (2013). Figures in euros 2000
Figure 5: Map of GDPpc in Spanish regions throughout the period 1989-2010
AN: Andalusia AR: Aragón A: Asturias BI: Balearic Islands CI: Canary Islands CA: Cantabria CM: Castile-La Mancha CL: Castile-Leon CAT: Catatonia V: Valencia E: Extremadura G: Galicia M: Madrid MU: Murcia N: Navarra BC: Basque Country LR: La Rioja
Source: Own elaboration from IVIE dataset