Colorimetric detection and determination of Fe(III), Co(II), Cu(II) and Sn(II) in aqueous media by acrylic polymers with pendant terpyridine motifs
Miriam Trigo-López, Asunción Muñoz, Saturnino Ibeas, Felipe Serna, Félix Clemente García and José Miguel García*
Departamento de Química, Facultad de Ciencias, Universidad de Burgos, Plaza de Misael Bañuelos s/n, 09001 Burgos, Spain. Fax: (+) 34 947 258 831, Tel: (+) 34 947 258 085. E-mail: [email protected]
Graphical abstract
ABSTRACT
Colorimetric cation responsive water soluble polymers and manageable films or
membranes have been designed. The sensory materials respond with a colour change to
the presence in water of Fe(III), Co(II), Cu(II), and Sn(II). The colour change is specific
of each metal cation, and enables its identification (purple for iron, orange for cobalt,
green for copper, and yellow for tin). The design of the materials relies on an addition
monomer having a terpyridine moiety, which behaves as a dye in presence of transition
metal cations due to its proven chelating capability toward these species and the colour
development that always accompany the metallic complex formation. Water solutions
doi:10.1016/j.snb.2015.11.116
2
and Sn(II) with a limit of detection of 1.3x10⁻⁷, 6.4x10⁻⁸, 1.3x10⁻⁵ and 1.4x10⁻⁵ M,
respectively. On the other hand, sensory kits, cut from sensory membranes, permitted
the visual quantification of the cations in a dynamic range of five decades (1x10⁻⁷ -
5x10⁻³ M) for Fe(III) and Co(II) and of two decades (9x10⁻⁵ - 9x10⁻³ M) for Cu(II) and
Sn(II). Titration curves can also be drawn from a picture taken to the sensory kits with a
smartphone, by using the digital colour definition of the materials as analytical signal.
Also, after entering into contact with hands, shapes of metallic objects (iron and cobalt
containing tools) can be colour revealed by pressing the hands on paper or cotton fabrics
wetted with water solutions of the linear sensory polymer.
Keywords
Sensory polymers, terpyridine, cation detection, forensic applications
1. INTRODUCTION
The costless, in-situ, and fast detection and quantification of transition metal cations in
pure water are of the utmost environmental, industrial, and health importance.
Traditional techniques, such as atomic absorption spectroscopy (AAS) or inductively
coupled plasma mass spectrometry (ICP-MS), enable the selective and precise detection
and quantification of the mentioned chemical species. However, they are heavy, bulky,
extremely expensive techniques and require trained personnel. On the other hand,
chemical sensors have become a simple species detection method for non-trained
personnel, especially if the transduction is chromogenic (i.e., by a colour change) and
the detection can be carried out visually.
Chemical sensors are an emerging technology with expanding applicability to a
number of fields, such as civil security, environmental control and remediation,
macromolecules that have receptor motifs (or binding sites) in their structure, represent
a step further and show significant advances over discrete (or low molecular mass)
chemosensors. Thus, polymers can be prepared or transformed into films, coatings or
finished sensory materials with different shapes. Distinct polymer geometries are
achievable (linear, spherical, and tridimensional crosslinked network). They can be
easily designed to work in hydrophobic or hydrophilic environments and can be used to
sense both vapours and liquids. Also, they exhibit collective properties sensitive to
minor perturbations. Finally, their sensory moieties cannot migrate with the
concomitant increase in the performance stability along time, improve in the thermal
and chemical resistance, and can be easily reused.
Chemosensory polymers following a research methodology based on a
guaranteed of success strategy have been prepared. That is to say, once chemical species
to be detected are selected, the so-called targets, fully confident receptors for such
targets are looked in scientific literature to find, usually, discrete organic molecules that
are insoluble in water; then, their chemical structure is slightly modified by including a
polymerizable group; and finally it is copolymerized with commercial hydrophilic and
hydrophobic monomers to have water soluble linear polymers and crosslinked
membranes with gel structures that allow for the detection in 100% water. The target
species for this work are transition metal cations (Fe(III), Co(II), Cu(II) and Sn(II)), and
the receptor core is based on a terpyridine (2,2’:6’,2’’-terpyridine, tpy) motif.
Morgan and Burstal isolated tpy and described its purple complex with iron(II)
in the 1930s [1]. Since then tpy has become one of the most used ligands with multiple
applications in different research and technological areas, such as coordination
doi:10.1016/j.snb.2015.11.116
4
[20,21]; gelation and solvochromic sensors [22]; luminescent converters [23-25];
photon harvesting [26] and catalysis [27]. Terpyridine derivatives are multivalent
pyridine ligands that exhibit strong binding affinity toward a broad set of transition
metal cations. This extremely strong interactions come both from the d-d* back
bonding of the cations to the N-heterocycle rings and from the chelate effect [28,29].
Here, the tpy structure has been modified with a polymerizable methacrylamide
group and two kind of chromogenic sensory materials have been prepared: linear
polymers and solid film-shaped dense membranes comprised of crosslinked polymer
networks. The tpy-monomer (~1% mol) was copolymerized with a balance of
hydrophilic and hydrophobic commercial co-monomers (~99% mol) to give linear
copolymers and networks (membranes). The linear polymers are water soluble. The
membranes are solid, exhibit gel behaviour, and can be used to prepare manageable
solid sensory kits. Both type of materials respond with development of different colour
depending on the presence of Fe(III), Co(II), Cu(II) and Sn(II) in 100% water under
controlled acidic conditions. The detection in 100% water is relevant for real-life
environmental applications, whereas the acidic conditions avoid the analytical
complexity of dealing with presence of different species of each cation (for instance, for
iron at pH 2 only Fe3+ species are present, while at pH > 2 there are different equilibria
of Fe3+, Fe(OH)2+, Fe(OH)2+, and Fe(OH)3). Also, the usual presence in most research
studies of organic solvents, due to the insolubility in water of conventional probes,
influence the selectivity of the tpy core [30].
2. EXPERIMENTAL PART
All materials and solvents were commercially available and used as received, unless
otherwise indicated: 2-acetylpyridine (98%, Alfa Aesar), iodine (≥ 99.8%,
Sigma-Aldrich), 4-nitrobenzaldehyde (99% Alfa Aesar), ammonium acetate (97%, Alfa Aesar),
tin chloride anhydrous (98% , Alfa Aesar), methacryloyl chloride (97%, Alfa Aesar),
triethylamine (TEA) (≥ 99%, Aldrich), pyridine (≥ 99%, Probus), sodium hydroxide
(99.9%, VWR-Prolabo), hydrochloric acid (37%, VWR-Prolabo), N
-methyl-2-pyrrolidone (NMP) (99%, Aldrich), ethanol (99.97%, VWR-Prolabo), diethyl ether (≥
99,5%, Aldrich), SnCl2 anhydrous (98%, Alfa Aesar), Fe(NO3)3·9H2O (VWR-Prolabo),
Cu(NO3)2·3H2O (98%, Sigma-Aldrich), Co(NO3)2·6H2O (≥ 99%, Labkem), NaCl (≥
99%, Sigma-Aldrich), KCl (99.5%, Scharlau), Al(NO3)2·9H2O (≥ 989%,
Sigma-Aldrich), Pb(NO3)2 (≥ 99%, Fluka), LiCl (≥ 99%, Sigma-Aldrich), Zn(NO3)2·6H2O
(98%, Aldrich), Mg(NO3)2·6H2O (≥ 99%, Labkem), Cd(NO3)2 (98.5%, Alfa Aesar),
Ni(NO3)2·6H2O (98.5%, Sigma-Aldrich), methyl methacrylate (MMA) (99%, Aldrich), 1-vinyl-2-pyrrolidone (VP) (≥ 99%, Sigma-Aldrich), ethylene glycol dimethacrylate (EGDMMA) (98%, Sigma-Aldrich), Azo-bis-isobutyronitrile (AIBN, ≥ 98%, Aldrich) was recrystallised twice from methanol.
2.2. Instrumentation and measurements
1H and 13C NMR spectra were recorded with a Varian Inova 400 spectrometer operating
at 399.92 and 100.57 MHz, respectively, with deuterated chloroform (CDCl3) as the
solvent.
UV/vis spectra were recorded using a Hitachi U-3900 UV/vis
doi:10.1016/j.snb.2015.11.116
6
Infrared spectra (FT-IR) were recorded with a FT/IR-4200 FT-IR Jasco
spectrometer with an ATR-PRO410-S single reflection accessory. Low-resolution
electron impact mass spectra (EI-LRMS) were obtained at 70 eV on an Agilent 6890N
mass spectrometer. Thermogravimetric analysis (TGA) data were recorded for a 5-mg
sample under a nitrogen or oxygen atmosphere on a TA Instrument Q50 TGA analyser
at a scan rate of 10ºC min-1. The limiting oxygen index (LOI) was estimated using the
following experimental Van Krevelen equation: LOI = 17.5 + 0.4 CR, where CR is the
char yield weight percentage at 800ºC, which was obtained from the TGA
measurements under a nitrogen atmosphere.
The water-swelling percentage (WSP) of the membrane was obtained from the
weights of a dry sample membrane (ωd) and a water-swelled sample membrane (ωs) as
follows: 100 x [(ωs-ωd)/ωd] (the membrane was immersed in pure water at 20ºC until
the swelled equilibrium was achieved).
To determine the tensile properties of the polymer films (membranes), strips (5
mm in width and 30 mm in length) were cut from polymer films of 112 and 115µm
thickness for Mem1 and Mem2, respectively, on a SHIMADZU EZ Test Compact Table-Top Universal Tester at 20ºC. Mechanical clamps were used and an extension
rate of 5 mm min-1 was applied using a gauge length of 9.44 mm. At least 6 samples
were tested for each polymer, and the data was then averaged.
The limit of detection (LOD) and limit of quantification were estimated by the
following equations: LOD = 3.3 x SD/s and LOQ = 10 x SD/s, where SD is the standard
deviation of a blank sample and s is the slope of the calibration curve in a region of low
The qualitative and quantitative chromogenic responses of sensory squares
(~5x5 mm) cut from membranes (Mem1 and Mem2) toward Fe(III), Co(II), Cu(II) and Sn(II) in water solution were studied by immersing the squares in a number of sealed
vials with 1 mL of buffered water, containing each vial a known concentration of one of
the target cations (pH = 2, buffer: KCl-HCl). The resident time was 24 hours and the
temperature 25 °C. The qualitative evaluation of the sensing performance of the
materials was carried out visually. On the other hand, the quantitative study was
performed using a digital picture of the sensory squares taken with a smartphone by
treatment of the colour definition data of each disc (RGB parameters, R = purple, G =
green, B = blue). These parameters were obtained for each square directly after taking
the photograph of the set squares through using the app called ColourMeter of a
conventional Android smartphone (for each square 121 (11 × 11) pixels were averaged).
The three RGB parameters were reduced to one variable (PC1, principal component 1),
using principal component analysis (PCA), which provided an account of >78% of the
information on the three RGB parameters, thus allowing for the elaboration of simple
2D titration curves ([cation] vs. PC1) with concomitant noise reduction, without a
significant loss of information, and with independence of the type of camera, lighting,
quality of the image and so on [31,32].
2.3. Synthesis of sensory monomer
The sensory monomer containing the tpy-motif (5) was prepared according with the procedure schematically shown in Scheme 1.
doi:10.1016/j.snb.2015.11.116
8
Synthesis of 3-(4-nitrophenyl)-1-(pyridine-2-yl)prop-2-en-1-one (1). 2.5 mL of an
aqueous solution of 10% NaOH was added to a suspension of 6.25 g (41.4 mmol) of
4-nitrobenzaldehyde in 50 mL of ethanol. To the resulting mixture cooled at 0 ºC, 5.0 g
(41.2 mmol) of 2-acetylpyridine was added dropwise for 3 h. The solution was stirred at
0 ºC for 2 h. The precipitate formed was collected by filtration and washed with ethanol.
Yield 6.91 g (66%). 1H NMR H (400 MHz, CDCl3, Me4Si): 8.75 (1H, d, J 4.7 Hz,
pyridyl-H); 8.42 (1H, d, J 16.1 Hz, CH=CH); 8.26 (2H, d, J 8.8 Hz,Ph); 8.19 (1H, d, J
7.9 Hz, pyridyl-H); 7.91 (1H, d, J 16.1 Hz, CH=CH); 7.90 (1H, td, J 7.7 Hz, 1.7 Hz,
pyridyl-H); 7.85 (2H, d, J 8.9 Hz,Ph); 7.52 (1H,ddd, J 7.5 Hz, 4.7 Hz, 1.2 Hz,
pyridyl-H). 13C NMR, C (100.6 MHz, CDCl3, Me4Si): 189.06, 153.73, 149.11, 148.67, 141.44,
141.36, 137.32, 129.36, 127.46, 124.94, 124.25, 123.20. EI-LRMS (m/z (%)): 255.07
(18), 254.07 (M+, 100), 226.07 (23), 225.06 (68), 180.07 (18), 179.07 (31), 130.04 (16),
102.04 (29), 79.03 (19), 78.03 (20). FTIR [Wavenumbers (cm-1)]: ar C-H: 3075; C=O:
1671; C=N: 1578; as NO2: 1511; s NO2: 1334.
Synthesis of 1-pyridylacylpyridinium iodide (2).To a solution of 2 g (15.6 mmol) of
2-acetylpyridine in 20 mL of pyridine 4.60 g (17.6 mmol) of I2 was added and heated at
100 ºC under N2 atmosphere for 3 h. The mixture was then cooled at room temperature
and filtered off and washed with ether. The dry solid was then washed with ethanol. A
black solid was obtained. It was immediately used in the next synthetic step because it
is sensitive to ambient conditions. Yield 4.03 g (75%). 1H NMR H (300 MHz, CDCl3,
Me4Si): 8.75 (1H, d, J 4.7 Hz, pyridyl-H); 8.42 (1H, d, J 16.1 Hz, CH=CH); 8.26 (2H,
d, J 8.8 Hz, Ph); 8.19 (1H, d, J 7.9 Hz, pyridyl-H); 7.91 (1H, d, J 16.1 Hz, CH=CH);
7.90 (1H, td, J 7.7 Hz, 1.7 Hz, pyridyl-H); 7.85 (2H, d, J 8.9 Hz,Ph); 7.52 (1H, ddd, J
Synthesis of 2-(4-(4-nitrophenyl)-6-(pyridin-2-yl)pyridin-2-yl)pyridine (3). To a
solution of 10% dry ammonium acetate in 20 mL of ethanol, 1 g (3 mmol) of (2) and 0.78 g (3 mmol) (1) were added. The mixture was refluxed for two days, the solvent removed and the product used without further purification. Yield 1.00 g (93%). 1H
NMR H (400 MHz, CDCl3, Me4Si): 8.75 (2H, pyridyl-H); 8.73 (2H, d, J 4.3 Hz,
pyridyl-H); 8.68 (2H, d, J 8.0 Hz, pyridyl-H); 8.36 (2H, d, J 8.8 Hz, Ph); 8.04 (2H, d, J
8.8 Hz, Ph); 7.90 (2H, td, J 7.8 Hz, 1.6 Hz, pyridyl-H); 7.38 (2H, pyridyl-H). 13C NMR,
C (100.6 MHz, CDCl3, Me4Si):156.53, 155.81, 149.35, 148.33, 148.02, 145.12, 137.17,
128.43, 124.34, 124.34, 121.56, 119.07. EI-LRMS (m/z (%)):355.11 (25), 354.11 (M+,
100), 309.12 (20), 308.12 (78), 306.09 (9), 229.07 (57), 203.06 (4), 177.05 (4), 153.54
(5), 78.02 (5). FTIR [Wavenumbers (cm-1)]: C=N: 1585; as NO2: 1514; s NO2: 1351.
Synthesis of 4-(2,6-di(pyridin-2-yl)pyridin-4-yl)benzenamine (4). A mixture of 3.66 g
(10.3 mmol) of (3) and 12.24 g (64.5 mmol) of anhydrous tin(II) chloride in concentrated hydrochloric acid (100 mL) was heated at 70 °C for 6 h. The solid was
filtered off and stirred in a 10% aqueous solution of sodium hydroxide for 1 hour. Then
it was filtered off and washed with water. Yield 3.07 g (92%). 1H NMR H (400 MHz,
CDCl3, Me4Si): 8.73 (2H, ddd, J 4.8 Hz, 1.8 Hz, 0.9 Hz, pyridyl-H); 8.69 (2H, s,
pyridyl-H); 8.67 (2H, dt, J 8.0 Hz, 1.1 Hz, pyridyl-H); 7.87 (2H, td, J 7.7 Hz, 1.8 Hz
pyridyl-H); 7.78 (2H, d, J 8.5 Hz, Ph); 7.35 (2H, ddd, J 7.5 Hz, 4.8 Hz, 1.2 Hz,
pyridyl-H); 3.87 (2H, s, NH2). 13C NMR, C (100.6 MHz, CDCl3, Me4Si):156.70, 155.88,
150.14, 149.22, 147.67, 136.95, 128.53, 128.38, 123.81, 121.49, 117.93, 115.37.
EI-LRMS (m/z (%)):325.13 (24), 324.13 (M+, 100), 323.12 (19), 296.11 (6), 246.10 (15),
219.09 (6), 162.09 (6), 78 (4). FTIR [Wavenumbers (cm-1)]: NH2: 3481, 3387; C=N:
doi:10.1016/j.snb.2015.11.116
10
Synthesis of N-(4-(2,4-di(pyridin-2-y)pyridine-4-yl)phenyl)methacrylamide (5). A
solution of 2.60 g (8 mmol) of (4) in 20 mL of NMP was stirred at room temperature for 5 min. Then, 1 g (9.6) mmol of methacryloyl chloride was added dropwise for 20 min.
After that, 1.05 g (10.4 mmol) of TEA was added and the mixture is stirred for 4 hs at
50 ºC under nitrogen atmosphere. The solution thus formed was precipitated in water,
the solid filtered off and washed with water. Yield 3.07 g (98%). 1H NMR H (400
MHz, CDCl3, Me4Si): 8.73 (2H, d, J 4.3 Hz, pyridyl-H); 8.72 (2H, s, pyridyl-H); 8.66
(2H, d, J 8.0 Hz, pyridyl-H); 7.91 (2H, d, J 8.7 Hz, Ph); 7.87 (2H, td, J 7.8 Hz, 1.6 Hz,
pyridyl-H); 7.73 (2H, d, J 8.7 Hz, Ph); 7.68 (1H, s, NH); 7.35 (2H,m, pyridyl-H); 5.83
(1H, s, =CH2), 5.49 (1H, s, =CH2), 2.09 (3H, s, CH3). 13C NMR, C (100.6 MHz,
CDCl3, Me4Si): 171.38, 166.68, 156.40, 156.08, 149.55, 149.25, 141.00, 138.86,
137.01, 134.35, 128.12, 123.96, 121.52, 120.26, 118.55, 18.91. EI-LRMS (m/z (%)):
393.17 (29), 392.16 (M+, 100), 391.14 (23), 337.14 (6), 351.12 (5), 323.13 (6), 233.09
(19), 78.02 (21), 62.99 (18). FTIR [Wavenumbers (cm-1)]: N-H: 3301; C=O: 1665; C=N:
1585; N-H: 1519.
2.4. Polymer synthesis
The linear copolymer (LCp) was prepared by thermically initiated radical polymerization of the hydrophilic monomer VP and the tpy-derivative monomer (5) in a 99/1 (VP/(5)) molar ratio (Scheme 2). A 100-mL three-necked flask equipped with a magnetic stirrer, a nitrogen inlet, and a reflux condenser was charged with a solution of
0.18 mmol (0.071 g) of (5) and 17.9 mmol (2.0 g) of VP in 18 mL of dioxane. Subsequently, AIBN (0.29 g, 1.8 mmol) was added, and the solution was heated to 60
ºC. After stirring for 4 h under nitrogen, the solution was allowed to cool. The, it was
(Yield 1.61 g (79%)). From the green chemistry viewpoint, the preparation of one gram
of polymer LCp requires: a) reagents: 15 mg of TEA, 14 mg of methacryloyl chloride, 1.2 mL of HClconc, 147 mg of SnCl2, 88 mg of ammonium acetate, 46 mg of
2-acetylpyridine, 51 mg of I2, 31 mg of 4-nitrobenzaldehyde, 240 mg of NaOH, 1.24 g of
VP, and 180 mg of AIBN; b) solvents: 286 L of NMP, 1.4 mL of ethanol, 218 L of pyridine, 212 L of ether, 11.2 mL of dioxane, and 124.2 mL of hexane.
Scheme 2.
The film-shaped sensory membranes were prepared by the bulk radical
polymerization of the hydrophilic monomer VP, the hydrophobic monomer MMA, and the tpy-containg monomer (5). EGDMMA was used as cross-linking agent (Scheme 3). The co-monomer molar ratio VP/MMA/5/EGDMMA was 50/49.5/0.5/1 and 49/49/2/1 for Mem1 and Mem2, respectively. AIBN (1 wt%) was employed as a thermal radical initiator. The bulk radical polymerization reaction was carried out in a silanized glass
mould that was 100 mm thick in an oxygen-free atmosphere at 60 ºC overnight. From
the green chemistry viewpoint, the preparation of one gram of membrane requires: a)
Mem1: reagents (6 mg of TEA, 6 mg of methacryloyl chloride, 487 L of HClconc, 51 mg of SnCl2, 35 mg of ammonium acetate, 18 mg of 2-acetylpyridine, 20 mg of I2, 12
mg of 4-nitrobenzaldehyde, 101 mg of NaOH, 502 mg of VP, 452 mg of MMA, 18 mg of EGDMMA, and 9 mg of AIBN) and solvents (116 L of NMP, 580 L of ethanol 88
L of pyridine, 88 L of ether); b) Mem2: reagents (23 mg of TEA, 22 mg of methacryloyl chloride, 1.9 mL of HClconc, 228 mg of SnCl2, 136 mg of ammonium
doi:10.1016/j.snb.2015.11.116
12
and solvents (443 L of NMP, 2.2 mL of ethanol, 337 L of pyridine, and 337 L of
ether).
Scheme 3.
2.5. Solid sensory substrates
The solid sensory substrates were manufactured form Mem1 and Mem2 films by using plastic scissors to cut out 5x5 mm sensory squares. Plastic scissors were used
to avoid the presence of iron. Conventional steel scissors turned the membrane coloured
(the solely contact of an iron containing object with the membrane surface turns it
purple in colour).
3. RESULTS AND DISCUSSION
3.1. Sensing target cations in pure water
The objective of this work is the exploitation of organic molecules in pure water.
Organic molecules are usually highly hydrophobic and water insoluble. Their properties
in this medium are unknown although they can be envisaged by studying the molecules
in organic/aqueous mixtures. Accordingly, an interesting molecule was chosen, its
structure was slightly modified by including a polymerizable group, and hydrophilic
polymers were prepared. The polymers are both linear (soluble in water), and
crosslinked membranes (with gel behaviour as manageable solid kits). With these
materials the goal of exploiting water insoluble molecules in pure water was achieved.
3.2. Design of the colorimetric chemosensory terpyridine unit
Firstly metal cations and water as target species and measuring medium, respectively,
were selected. A chromogenic response as transduction of the recognition phenomena
non-specialized personnel are sought, and the naked eye is the best antenna for this
purpose. For meeting this criteria, a proven multivalent chelanting ligand, terpyridine,
was chose, which was isolated in 1932 [1], as a guarantee of success [5-19]. Thus, a tpy
derivative containing an amine group was used to prepare the acrylamide monomer (5), which was co-polymerized with the hydrophilic VP and the hydrophobic MMA co-monomers.
3.3. Materials preparation and characterisation
The acrylamide sensory monomer (5) was conventionally prepared by the straightforward reaction of methacryloyl chloride with the amine group of the
intermediate containing the tpy motif (4). The preparation of (4) was previously reported, and the steps followed to prepare products (1) to (4) have been adapted from those described by a number of authors looking for inexpensiveness of the chemicals,
optimization of the reaction steps, higher reaction yields, easy or no further purification
of products [33-37]. The 1H and 13C NMR and FTIR data and the spectra of the
intermediates and monomers can be found in the experimental section and in the ESI,
Section S1. The potential applicability of the designed acrylic soluble polymer LCp and sensory membranes, Mem1 and Mem2, is highlighted by the fact that a small quantity (≤6.8% (Mem2), ≤1.8% (Mem1)) by weight of the sensory synthetic monomer is used in the preparation of the sensory materials, as will be described below, using (≥93.1%
(Mem2), ≥98.2% (Mem1)) by weight of widely available and very inexpensive commercial co-monomers.
The mechanical and thermal behaviour are key parameters of every material.
The membranes, or films, have good physical appearance and were creasable and
660-doi:10.1016/j.snb.2015.11.116
14
730 MPa, respectively (Table 1). These results are excellent for lab-made acrylic
membranes. The thermal resistance was evaluated using TGA. The degradation
temperatures that resulted in a 5% weight loss under a nitrogen atmosphere (T5) were
~240ºC for membranes and much higher, ~390ºC, for LCp. The ester content of the membranes, from the MMA co-monomer, lowered the thermal resistance compared with LCp. The methyl ester moieties are hydrophobic and counterbalance the hydrophilic nature of VP in the membranes in order to control the water-swelling percentage (WSP). Gel behaviour is relevant for the membrane to sense in pure water
because the target species enter into the material as solvated species by diffusion.
However, the water uptake has to be modulated in order to keep good mechanical
properties in the swelled state. For this purpose, a moderate WSP around 40% is
desirable. The membranes constitution was designed to meet this criterion. Accordingly,
WSP of Mem1 and Mem2 was 48% and 36 %, respectively. The hydrophobic nature of the tpy motifs is the responsible of the 12% water uptake decrease upon increasing 1.5%
the monomer containing the tpy groups (5) (Scheme 3).
Table 1.
3.4. The chemosensing mechanism
The chemosensing mechanism can be described as the coordination of the cation
species to the tpy motifs [38]. Thus, the complexation processes of one cation (M) and
two tpy motifs (L) in water. The complex stoichiometry was estimated with a Job´s plot
obtained from the UV/vis titration of Fe(III) with water solutions of the sensory
polymer LCp (Figure 1). The process is governed by two stability constants K1 and K2,
M + L ML
ML + L ML2
K 1
where L is the moles of sensory tpy-motifs per water volume of linear copolymer, L
represents really not a conventional concentration because the sensory motifs are
chemically anchored to the linear copolymer chains. The formation of ML and ML2 is
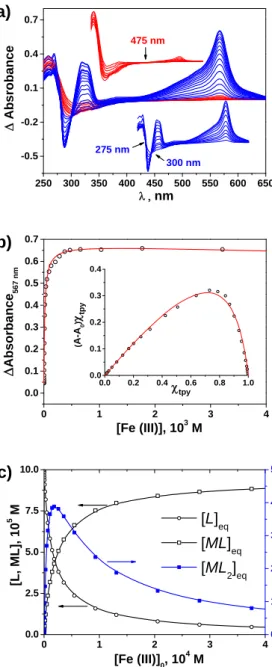
clearly depicted in the UV/vis titration spectra (Figure 1).
Considering the stability constants definition, the UV/vis spectroscopic data, and
the mass balance ( ; 2 ), the stability constants can be calculated by non-linear curve fit of Eq. (1), where A is the absorbance,
εL is calculated initially by εL = A0/CL, and εML2 at the end with a huge excess of metal
by εML2= 2Afinal/CL (at this point ≅ ) [39].
(1)
The fitting of Eq. (1) to complexation of iron(III) with LCp is shown in Figure 1, giving rise to K1= 51,000 ± 6,000 and K2= 2,000 ± 1,000. The determination of K1
and K2 for Co(II), Cu(II) and Sn(II) could not be carried out because for each cation ML
and ML2 species absorb in the same UV/vis region.
Figure 1.
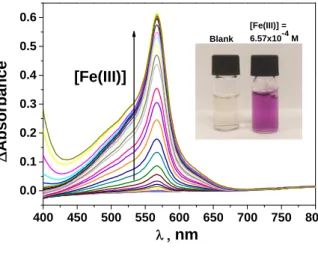
3.5. Sensing Fe(III), Co(II), Cu(II) and Sn(II) in aqueous media
The addition of transition metal cations to water solutions of LCp give rise to the development of clearly visible and nice colours (purple (Fe(III)), orange (Co(II)), green
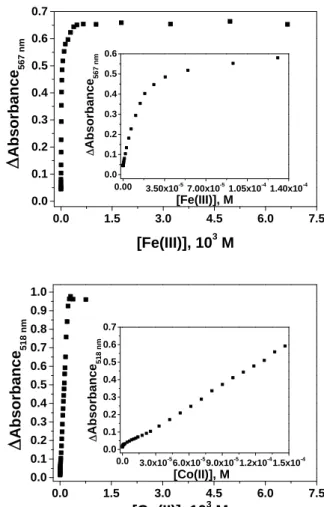
(Cu(II)) and yellow (Sn(II)) (Figure 2). The UV/vis titration curves are depicted in
Figures 3 and 4. The response to Fe(III) and Co(II) is conventional (Figure 3), with
doi:10.1016/j.snb.2015.11.116
16
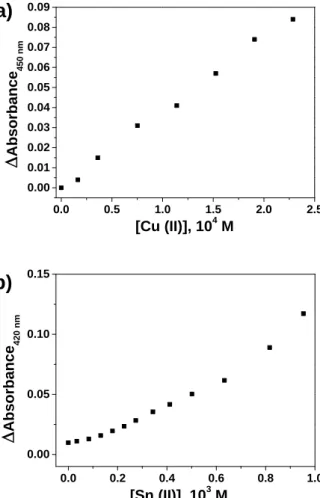
6.4x10⁻⁸ and 1.9x10⁻⁷ M for Co(II)). On the other hand, the response to Cu(II) and
Sn(II) was rather complex with LOD and LOQ in the sub milimolar level (1.3x10⁻⁵ and
3.8x10⁻⁵ M for Cu(II) and 1.4x10⁻⁵ and 4.2x10⁻⁵ M for Sn(II)). Only the low
concentration region is shown in Figure 4. Full titration curves and UV/vis titration
spectra are shown in Figures S6 to S9, ESI.
Figure 2.
Figure 3.
Figure 4.
Solid sensory materials give similar colours upon entering into contact with the
cations (Fe(III), Co(II), Cu(II) and Sn(II)), and the differences between solution an solid
state for each cation, shown in Figure 2, correspond to concentration differences and
colour perception and digitalization. Thus, these materials permitted the preparation of
solid titration kits for the visual detection and quantification of cations. Accordingly,
squares cut from Mem1 allowed for the naked eye study of Fe(III) and Co(II) content by analysing the purple and orange colour development, respectively (Figure 5a). The
lower sensitivity of the sensory polymers toward Cu(II) and Sn(II), compared with the
sensitivity toward Fe(III) and Co(II), was resolved by increasing the tpy sensory motifs
within the membranes. Therefore, Mem2, which have a molar tpy content four times higher than Mem1, permitted the visual titration of Cu(II) and Sn(II) by following the green and yellow colour development, respectively. The digital colour of pictures of
curves with quantification purposes, as previously described. The titration curve for
Fe(III) is shown in Figure 5c (the data and titration curves for Co(II), Cu(II) and Sn(II)
are depicted in the ESI, Tables S1-S12 and Figures S10-S13) [31,32].
Figure 5.
3.6. Response time
There are key parameters for sensor performance for real live measurements: reliability,
accurateness, environmental inertness, and short response time. The response time was
calculated as follows: for LCp solutions by UV/vis spectroscopy as the time needed to achieve 99% of the absorbance variation (ESI, Figure S14). This time was 10, 6, 2, and
12 min for Fe(III), Co(II), Cu(II), Sn(II) respectively (cations concentration of 5x10⁻⁶,
5x10⁻⁵, 1x10⁻⁴, 7.5x10⁻⁴ M, respectively). The apparent response time of the sensory
films (membranes) was slower because of the diffusion of the species into the
membrane, and the sensory squares were left immersed overnight.
3.7. Interference study
The selectivity of the sensory materials as colorimetric transition metal cation sensors
was tested in the presence of a broad set of cations (NaCl, KCl, Cu(NO3)2·3H2O,
Co(NO3)2·6H2O, Al(NO3)2·9H2O, Pb(NO3)2, LiCl, Zn(NO3)2·6H2O, Mg(NO3)2·6H2O,
Cd(NO3)2, SnCl2 and Ni(NO3)2·6H2O, SnCl2, Fe(NO3)3·9H2O, Cu(NO3)2·3H2O, Co(NO3)2·6H2O). Thus, a solution of LCp in water (pH = 2, buffer: KCl-HCl, concentration of sensory motifs in water was 1x10⁻³ M -equivalents of pendant sensory
tpy motifs per litre-) with a cocktail of these cations (concentration of each cation =
9.09x10⁻⁴ M) was used in this study. The UV/vis spectra show that the set of cations are
doi:10.1016/j.snb.2015.11.116
18
motifs. This means that a full range of complexes are formed, though only a few are
coloured. Accordingly, real sample can contain these ions at different concentrations
and this fact may be a drawback for the identification and quantification of the target
cations. However, the target cations can also be evaluated in presence of these
interferents by the standard addition procedure. For instance, by adding increasing and
known quantities of Fe(III) to the sample containing the cocktail of 13 cations
(concentration of each cation = 1x10⁻⁶ M), the Fe(III) concentration calculated was
1.3x10⁻⁶ M, similar to the real content, 1.0x10⁻⁶ M (ESI, Figure S16). Furthermore, the
accuracy of the Fe(III) concentration determination was verified by measuring the
cation concentration in a sample prepared with tap water from our laboratory spiked
with Fe(III), thus emulating a real sample. The titration curve was prepared using tap
water (the iron concentration of this tap water, determined by inductively coupled
plasma mass spectrometry -ICP-, was about 19.4 ppb). The Fe(III) concentration added
to the tap water was 1.5x10⁻⁶ M, and the calculated concentration was 1.4x10⁻⁶ M, in
good accordance with the added Fe(III) concentration. In parallel, the standard addition
method permitted the calculation of the iron concentration of tap water, giving a result
of 20.3 ppb, also in agreement with the concentration calculated by ICP.
3.8. Forensic applications and metal recognition
Iron containing tools leave a small amount of metal upon entering into contact with
other surfaces. This is relevant in forensic applications where it is important to detect
the imprint of certain objects in hands, like knives. In this sense, Figure 6 and a video
shows the shape of a lag screw in a finger after holding it with two fingers. After
pressing lag screw with the fingers, the index finger is pressed on a filter paper
oxygen of the air, the sweat and water and recognized by the tpy motifs giving rise to
the complex formation with the concomitant purple colour development (see video,
ESI).
Moreover, it is possible to know if a tool has iron in its composition by dipping
in a water solution of LCp. Immediately after immersion, the solution turn purple (see Figure 6 and video, ESI).
Cobalt, a critical raw material [40], can also be analysed in a similar way. Figure 6 and
the video (ESI) also shows how a widia drill bit, which has an iron-based shaft with a
tungsten carbide (with 6-10% of cobalt) blade at the tip off the drill. After being touched
with a finger, the widia blade leave on the filter paper, previously wet with the water
solution of LCp, its orange imprint surrounded by the purple imprint of the iron holding the widia tip.
Figure 6.
4. CONCLUSIONS
Terpyridine, as a proven chelating agent for monoatomic metallic cations, has been used
to prepare colorimetric sensory solid polymers both as water soluble linear polymers
and as solid films (membranes). Water solution of the linear polymer turned purple,
orange, green or yellow upon being in contact with Fe(III), Co(II), Cu(II) and Sn(II),
respectively. The colour development permitted the visual differentiation of the cations
and the titration with the UV/vis technique. The limit of detection was sub-micromolar
for Fe(III) and Co(II), and micromolar for Cu(II) and Sn(II). In a similar fashion, the
solid films have gel behaviour and turn coloured upon immersing in water containing
doi:10.1016/j.snb.2015.11.116
20
solid sensory kits from which the cations could be differentiated and their concentration
estimated by the naked eye. Pictures taken to the kits permitted the titration using the
colour definition of the sensory squares as analytical input. The dynamic range was of
five decades (lower concentration = 1x10⁻⁷ M) for Fe(III) and Co(II) and of two decades
(lower concentration = 9x10⁻⁵ M) for Cu(II) and Sn(II). The chosen of proven organic
chelating agents and their chemical anchorage to polymer backbones have proven to be
successful strategies to prepare sensory materials for water environments. The colour
output of the sensory systems and the manageable solid kits allowed for the visually use
of these materials by non-specialized personnel and, concomitantly, portable devices
such as smartphones permit the fast and costless quantification of target species.
Moreover, forensic applications are envisaged, e.g., the shape of metallic objects after
entering into contact with hands can be colour revealed by pressing the hands on paper
or cotton fabrics wetted with water solutions of the linear sensory polymer.
Acknowledgments
The financial support provided by the Spanish Ministerio de Economía y
Competitividad-Feder (MAT2014-54137-R) and by the Consejería de Educación –
Junta de Castilla y León (BU232U13) is gratefully acknowledged.
Apendix A. Supplementary data
A file and a video. The file containing experimental part (intermediates and monomer
characterization); study of interaction of LCp, Mem1 and Mem2 with Fe(III), Co(II), Cu(II), and Sn(II); interference study; and response time. The video showing the
References
[1] G. T. Morgan, F. H. Burstall, Dehydrogenation of pyridine by anhydrous ferric chloride, J. Chem. Soc. (1932) 20-30.
[2] C. E. Housecroft, 4,2′:6′,4′′-Terpyridines: diverging and diverse building blocks in coordination
polymers and metallomacrocycles, Dalton Trans. 43 (2014) 6594-6604.
[3]. E. C. Constable, C. E. Housecroft, M. Neuburger, S. Schaffner, L. J. Scherer, Preparation and structural characterisation of terpy-cored dendrimers and dendriplexes, Dalton Trans. (2004) 2635-2642.
[4] P. Wang, T. Okamura, H.-P. Zhou, W.-Y. Sun, Y.-P. Tian, Metal complex with terpyrindine derivative ligand as highly selective colorimetric sensor for iron(III), Chin. Chem. Lett. 24 (2013) 20-22.
[5] B. Zhang, Y. Li, W. Sun, Anion-sensitive 2,4-dinitrophenylhydrazone-containing terpyridine derivative and its platinum chloride complex, Eur. J. Inorg. Chem. (2011) 4964-4969.
[6] C. Bhaumik, D. Maity, S. Das, S. Baitalik, Anion sensing studies of luminescent bis-tridentate ruthenium(II) and osmium(II) complexes based on terpyridyl-imidazole ligand through different channels, Polyhedron 52 (2013) 890-899.
[7] Q.-Y. Cao, M. Li, L. Zhoua, Z.-W. Wang, New 2,2′:6′,2′′-terpyridines as colorimetric and
fluorescent sensors for fluoride ions, RSC Adv. 4 (2014) 4041–4046.
[8] S. Bhowmik, B. N. Ghosh, V. Marjomäki, K. Rissanen, Nanomolar pyrophosphate detection in
water and in a self-assembled hydrogel of a simple terpyridine-Zn2+ complex, J. Am. Chem. Soc.
136 (2014) 5543-5546.
[9] A. Fermi, G. Bergamini, M. Roy, M. Gingras, P. Ceroni, Turn-on phosphorescence by metal coordination to a multivalent terpyridine ligand: a new paradigm for luminescent sensors, J. Am. Chem. Soc. 136 (2014) 6395-6400.
[10] C. Goze, G. Ulrich, L. Charbonnière, M. Cesario, T. Prangé, R. Ziessel, Cation sensors based on terpyridine-functionalized boradiazaindacene, Chem. Eur. J. 9 (2003) 3748-3755.
[11] Y. Zhang, C. B. Murphy, W. E. Jones Jr, Poly[p-(phenyleneethynylene)-alt-(thienyleneethynylene)]
polymers with oligopyridine pendant groups: highly sensitive chemosensors for transition metal ions, Macromolecules 35 (2002) 630-636.
[12] M. A. R. Meier, U. S. Schubert, Fluorescent sensing of transition metal ions based on the encapsulation of dithranol in a polymeric core shell architecture, Chem. Commun. (2005) 4610-4612.
[13] C. Fan, X. Wang, P. Ding, J, Wang, Z, Liang, X, Tao, Synthesis, photophysical and iron-sensing properties of terpyridyl-based triphenylamine derivatives, Dyes Pigm. 95(2012) 757-767.
[14] H. Li, S.-J. Zhang, C.-L. Gong, Y.-F. Li, Y. Liang, Z.-G. Qi, S. Chen, Highly sensitive and selective
fluorescent chemosensor for Ni2+ based on a new poly(arylene ether) with terpyridine substituent
groups, Analyst 138 (2013) 7090-7093.
[15] Y. Hong, S. Chen, C. W. T. Leung, J. W. Y. Lam, J. Liu, N.-W. Tseng, R. T. K. Kwok, Y. Yu, Z. Wang, B. Z. Tang, Fluorogenic Zn(II) and chromogenic Fe(II) sensors based on terpyridine-substituted tetraphenylethenes with aggregation-induced emission characteristics, ACS Appl. Mater. Interfaces 3 (2011) 3411-3418.
[16] M. Zheng, H. Tan, Z. Xie, L. Zhang, X. Jing, Z. Sun, Fast response and high sensitivity europium
metal organic framework fluorescent probe with chelating terpyridine sites for Fe3+, ACS Appl.
Mater. Interfaces 5 (2013) 1078-1083.
[17] M. E. Padilla-Tosta, J. M. Lloris, R. Martínez-Máñez, A. Benito, J. Soto, T. Pardo, M. A. Miranda, M. D. Marcos, Bis(terpyridyl)-Ruthenium(II) units attached to polyazacycloalkanes as sensing fluorescent receptors for transition metal ions, Eur. J. Inorg. Chem. (2000) 741-748.
[18] Z.-B. Zheng, Z.-M. Duan, J.-X. Zhang, K.-Z. Wang, Chromogenic and fluorogenic sensing
properties toward cations and anions by a terpyridine/phenylimidazo [4,5-f]phenanthroline hybrid,
Sens. Actuators B 169(2012) 312-319.
[19] C. Bhaumik, S. Das, D. Maity, S. Baitalik, A terpyridyl-imidazole (tpy-HImzPh3) based bifunctional
receptor for multichannel detection of Fe2+ and F− ions, Dalton Trans. 40 (2011) 11795-11808.
[20] C. Y.-S. Chung, V. W.-W. Yam, Induced self-assembly and Förster resonance energy transfer studies of alkynylplatinum(II) terpyridine complex through interaction with water-soluble poly(phenylene ethynylene sulfonate) and the proof-of-principle demonstration of this
doi:10.1016/j.snb.2015.11.116
22
component ensemble for selective label-free detection of human serum albumin, J. Am. Chem. Soc. 133 (2011) 18775-18784.
[21] H.-L. Kwong, W.-L. Wonga, C.-S. Lee, C.-T. Yeung, P.-F. Teng, Zinc(II) complex of terpyridine-crown macrocycle: A new motif in fluorescence sensing of zwitterionic amino acids, Inorg. Chem. Commun. 12 (2009) 815-818.
[22] G. N. Tew, K. A. Aamer, R. Shunmugam, Incorporation of terpyridine into the side chain of copolymers to create multi-functional materials, Polymer 46 (2005) 8440-8447.
[23] R. Shunmugam, G. N. Tew, Polym, Dialing in color with rare earth metals: facile photoluminescent production of true white light, Adv. Technol. 18 (2007) 940-950.
[24] Etienne Baranoff, Jean-Paul Collin, Lucia Flamigni, Jean-Pierre Sauvage, From ruthenium(II) to iridium(III): 15 years of triads based on bis-terpyridine complexes, Chem. Soc. Rev. 33 (2004) 147-155.
[25] E. G. Moore, M. Benaglia, G. Bergamini, P. Ceroni, Synthesis, Stability and Sensitised Lanthanide Luminescence of Heterobimetallic d/f Terpyridine Complexes, Eur. J. Inorg. Chem. (2015) 414-420. [26] S. Caramori, J. Husson, M. Beley, C. A. Bignozzi, R. Argazzi, P. C. Gros, Combination of cobalt
and iron polypyridine complexes for improving the charge separation and collection in
ru(terpyridine)2-sensitised solar cells, Chem. Eur. J. 16 (2010) 2611-2618.
[27] A. Winter, G. R. Newkome, U. S. Schubert, Catalytic applications of terpyridines and their transition metal complexes, ChemCatChem 3 (2011) 1384-1406.
[28] H. Hofmeier, U. S. Schubert, Recent developments in the supramolecular chemistry of terpyridine– metal complexes, Chem. Soc. Rev. 33 (2004) 373-399.
[29] P. R. Andres, U. S. Schubert, New functional polymers and materials based on 2,2′:6′,2″-terpyridine
metal complexes, Adv. Mater. 16 (2004) 1043-1068.
[30] R. shanmugam, G. J. Gabriel, C. E. Smith, D. A. Aamer, G. N. Tew, Highly selective colorimetric aqueous sensor for mercury, Chem. Eur. J. 14 (2008) 3904-3907.
[31] H. El Kaoutit, P. Estevez, F. C. Garcia, F. Serna, J. M. Garcia, Sub-ppm quantification of Hg(II) in aqueous media using both the naked eye and digital information from pictures of a colorimetric sensory polymer membrane taken with the digital camera of a conventional mobile phone, Anal. Methods 5 (2013) 54-58.
[32] S. Vallejos, A. Muñoz, S. Ibeas, F. Serna, F. C. Garcia, J. M. Garcia, Solid sensory polymer substrates for the quantification of iron in blood, wine and water by a scalable RGB technique, J. Mater. Chem. A 1 (2013) 15435-15441.
[33] P. Lainé, F. Bedioui, P. Ochsenbein, V. Marvaud, M. Bonin, E. Amouyal, A new class of functionalized terpyridyl ligands as building blocks for photosensitized supramolecular
architectures. synthesis, structural, and electronic characterizations, J. Am. Chem. Soc., 124 (2002) 1364-1377.
[34] F. Tessore, D. Roberto, R. Ugo, M. Pizzotti, Terpyridine Zn(II), Ru(III), and Ir(III) complexes: the
relevant role of the nature of the metal ion and of the ancillary ligands on the second-order nonlinear response of terpyridines carrying electron donor or electron acceptor groups, Inorg. Chem.44 (2005) 8967-8978.
[35] E. Zysman-Colman, J. D. Slinker, J. B. Parker, G. G. Malliaras, S. Bernhard, Improved turn-on times of light-emitting electrochemical cells, Chem. Mater. 20 (2008) 388-396.
[36] G. A. Koohmareh, M. Sharifi, Synthesis, characterization, and coordination behavior of
copoly(styrene-maleimide) functionalized with terpyridine, J. Appl. Polym. Sci. 116 (2010) 179-183.
[37] W. Y. Ng, X. Gong, W. K. Chan, Electronic and light-emitting properties of some polyimides based
on bis(2,2‘:6‘,2‘ ‘-terpyridine) ruthenium(II) complex, Chem. Mater. 11 (1999) 1165-1170.
[38] A. Earnshaw, N. Greenwood, Chemistry of the Elements, 2nd Ed., Elsevier Butterworth-Heinemann,
Burlington, 2005, ch 19.
[39] S. Vallejos, P. Estévez, S. Ibeas, F. C. García, F. Serna, J. M. García, An organic/inorganic hybrid membrane as a solid “turn-on” fluorescent chemosensor for coenzyme A (CoA), cysteine (Cys), and glutathione (GSH) in aqueous media, Sensors 12 (2012) 2969-2982.
[40] Report on critical raw materials for the EU, Report of the Ad hoc Working Group on defining
critical raw materials, European Commission, May 2014. Downloaded: July 14, 2015
Table 1. Thermal (TGA) and mechanical properties of materials. The thermal properties were evaluated in inert (N2) and oxidizing (synthetic air) atmospheres.
Polymer
Thermal properties Mechanical properties Atmosphere
LOIc)
Tensile strength,
MPa
Young’s Modulus,
MPa
Elongation,
%
N2 Air
T5,a)
°C
T10,a)
°C
CR,b) %
T5,a)
°C
T10,a)
°C
Mem1 242 344 4 224 318 19.1 33 660 9
Mem2 241 342 4 245 333 19.1 39 730 8
LCp 389 408 1 353 399 17.9 n.a.d) n.a.d) n.a.d)
a)
5% weight loss (T5), 10% weight loss (T10); b) CR: char yield at 800 ºC; c) limiting
1
Graphical abstract
Films and water soluble polymers as sensory materials for the detection and
quantification of iron, cobalt, copper and tin salts in water, and for forensic applications.
Schemes
Scheme 1. Synthesis of acylic monomer (5).
Scheme 2. Synthesis and chemical structure of sensory linear polymer (LCp).
Scheme 3. Synthesis and chemical structure of sensory membranes Mem1 and Mem2. The picture shows the membranes after removal from the mould.
Figures
Figure 1. UV/vis study of the interaction of Fe(III) (M) with tpy-motif (L) of LCp in water (pH = 2, buffer = HCl-KCl): a) absorbance variation spectra. Blue and red spectra correspond to formation of 1:1 (ML) and 1:2 (ML2) complexes tpy motif:Fe(III),
respectively (inset: separation of processes with indication of the isosbestic points); b) absorbance at 567 nm vs Fe(III) concentration. The continuous line is the fitting of the
data according with Eq. (1) (inset: Job´s plot (
tpy is molar fraction of tpy sensorymotifs, absorbance at 567 nm); and c) the species distribution. The concentration of sensory motifs in water was 1x10⁻⁴ M (equivalents of pendant sensory tpy motifs per litre).
Figure 2. Colour development sensory materials upon entering into contact with Fe(III), Co(II), Cu(II) and Sn(II): a) LCp in water solution (pH = 2, buffer = KCl-HCl,
concentration of cations = 5x10⁻⁴ M). The concentration of sensory motifs in water was 0.01 M (equivalents of pendant sensory tpy motifs per litre); and b) Mem1 after
immersion in water (pH = 2, buffer = KCl-HCl, concentration of cations = 5x10⁻⁴ M, immersion time = 24 h).
Figure 3. Titration curves of Fe(III) and Co(II) with aqueous solutions of LCp (pH = 2, buffer = KCl-HCl, concentration of cations ranging from 6.75x10⁻⁸ to 6.57x10⁻⁴ M for Fe(III) and 7.99x10⁻⁸ to 7.54x10⁻⁴ M for Co(II). Insets: expansion of the low
concentration region. The concentration of sensory motifs in water was 1x10⁻⁴ M for the Fe(III) titration and 1x10⁻³ M for the Co(II) titration (equivalents of pendant sensory tpy motifs per litre).
Figure 4. Titration curves of: a) Cu(II); and b) Sn(II) with aqueous solutions of LCp
-Figure 5. Visual titration of Fe(III), Co(II), Cu(II) and Sn(II) in water (pH = 2, buffer = KCl-HCl) with squares cut from Mem1 or Mem2. Each square was dipped in the water solution containing each cation for 24 h. The sensory membrane and the cation
concentration of the water solution was: a) membranes = Mem1, Fe(III) and Co(II) concentration, from left to right: 1x10⁻⁷, 5x10⁻⁷, 1x10⁻⁶, 5x10⁻⁶, 1x10⁻⁵, 5x10⁻⁵, 1x10⁻⁴, 5x10⁻⁴, 1x10⁻³, 5x10⁻³ M; b) membranes = Mem2, Cu(II) and Sn(II) concentration, from left to right: 9x10⁻⁵, 3x10⁻⁴, 6x10⁻⁴, 9x10⁻⁴, 3x10⁻³, 6x10⁻³, 9x10⁻³ M; and c) Fe(III) titration curve obtained from the picture taken to the squares immersed in water with Fe(III) (PC1: principal component 1 that encompass three digital colour parameters (RGB) of each sensory square).
Film
quan
ms and wat
ntification of
ter soluble
f iron, coba
e polymers
alt, copper a
3 s as senso
and tin salts
ory materia
in water, an
als for the
nd for foren
e detection
nsic applicat n and
N O
+ I2
+ N
N O
N
+
N
NH2
N N
N HN
N N
O
O Cl
(4)
(2)
(5) I
N2,100ºC, 2 h
i) CH3COONH4,
EtOH, Reflux, 2 d
, Et3N, NMP
50ºC, overnight
ii) SnCl2, HCl
70ºC, 6 h
(1) (2)
5
7
250 300 350 400 450 500 550 600 650 -0.5
Figure 1. UV/vis study of the interaction of Fe(III) (M) with tpy-motif (L) of LCp in water (pH = 2, buffer = HCl-KCl): a) absorbance variation spectra. Blue and red spectra correspond to formation of 1:1 (ML) and 1:2 (ML2) complexes tpy
motif:Fe(III), respectively (inset: separation of processes with indication of the isosbestic points); b) absorbance at 567 nm vs Fe(III) concentration. The continuous line is the fitting of the data according with Eq. (1) (inset: Job´s plot (
tpy is molar9
0.0 0.5 1.0 1.5 2.0 2.5 0.00
0.01 0.02 0.03 0.04 0.05 0.06 0.07 0.08
Absorbance
450 nm
[Cu (II)], 104 M
0.0 0.2 0.4 0.6 0.8 1.0 0.00
0.05 0.10 0.15
[Sn (II)], 103 M
Ab
so
rb
an
ce
4
20 n
m
b)
Figure 4. Titration curves of: a) Cu(II); and b) Sn(II) with aqueous solutions of LCp
1
Colorimetric detection and determination of Fe(III), Co(II), Cu(II) and Sn(II) in aqueous media by acrylic polymers with pendant terpyridine motifs
Miriam Trigo-López, Asunción Muñoz, Saturnino Ibeas, Felipe Serna, Félix Clemente García and José Miguel García*
Departamento de Química, Facultad de Ciencias, Universidad de Burgos, Plaza de Misael Bañuelos s/n, 09001 Burgos, Spain. Fax: (+) 34 947 258 831, Tel: (+) 34 947 258 085. E-mail: [email protected]
Table of contents
S1. Experimental part. Intermediate and monomer characterisation..…………... 2
S2. Titration of Fe(III) with LCp..………... 6
S3. Titration of Co(II) with LCp.………...……….. 6
S4. Titration of Cu(II) with LCp... 7
S5. Titration of Sn(II) with LCp……….. 7
S6. Titration of cations with pictures taken to Mem1 and Mem2………... 8
S6.1. Titration of Fe(III) with a picture taken to Mem1………. 8
S6.2. Titration of Co(II) with a picture taken to Mem1.………. 9
S6.3. Titration of Cu(II) with a picture taken to Mem2……….. 10
S6.4. Titration of Sn(II) with a picture taken to Mem2……….. 11
S7. Response time………... 12
N
NO2
4000 3500 3000 2500 2000 1500 1000 500 0
20 40 60 80
Tr
ansmit
tance (%)
Wavenumber, cm-1
c)
8.8 8.6 8.4 8.2 8.0 7.8 7.6
ppm
d)
190 180 170 160 150 140 130 120
ppm
Figure S1. Characterisation of (3-(4-nitrophenyl)-1-(pyridine-2-yl)prop-2-en-1-one (1): a) chemical structure; b) FT-IR; c) 1H NMR; d) 13C NMR (NMR solvent: DMSO-d6).
a)
b)
9.5 9.0 8.5 8.0 7.5 7.0
ppm
3
a)
b)
4000 3500 3000 2500 2000 1500 1000 500 20
30 40 50 60 70 80 90 100
Wavenumber, cm-1
Transmittance (%)
c)
8.8 8.6 8.4 8.2 8.0 7.8 7.6 7.4
ppm
d)
160 150 140 130 120
ppm
4000 3500 3000 2500 2000 1500 1000 500 0
20 40 60 80 100
Wavenumber, cm-1
Tr
a
n
sm
it
ta
n
c
e (
%
)
c)
8.74 8.36 7.98 7.60 7.22 6.84 4.0 3.8
ppm
d)
160 150 140 130 120
ppm
Figure S4. Characterisation of 4-(2,6-di(pyridin-2-yl)pyridin-4-yl)benzenamine (4): a) chemical structure; b) FT-IR; c) 1H NMR; d) 13C NMR (NMR solvent: DMSO-d6).
5
a)
a)
4000 3500 3000 2500 2000 1500 1000 500
20 30 40 50 60 70 80 90 100
Wavenumber, cm-1
Transm
it
ta
nce
(%
)
b)
9.0 8.5 8.0 7.5 7.0 6.5 6.0 5.5 2.1 1.8
ppm
c)
170 160 150 140 130 120 20
ppm
400 450 500 550 600 650 700 750 800 buffer = KCl-HCl, concentration of cations ranging from 6.75x10⁻⁸ to 6.57x10⁻⁴ M). The concentration of sensory motifs in water was 1x10⁻⁴ M (equivalents of pendant sensory tpy motifs per litre).
S3. Titration of Co(II) with LCp
450 500 550 600 650
7
400 450 500 550 600 650 700 750 800
0.0
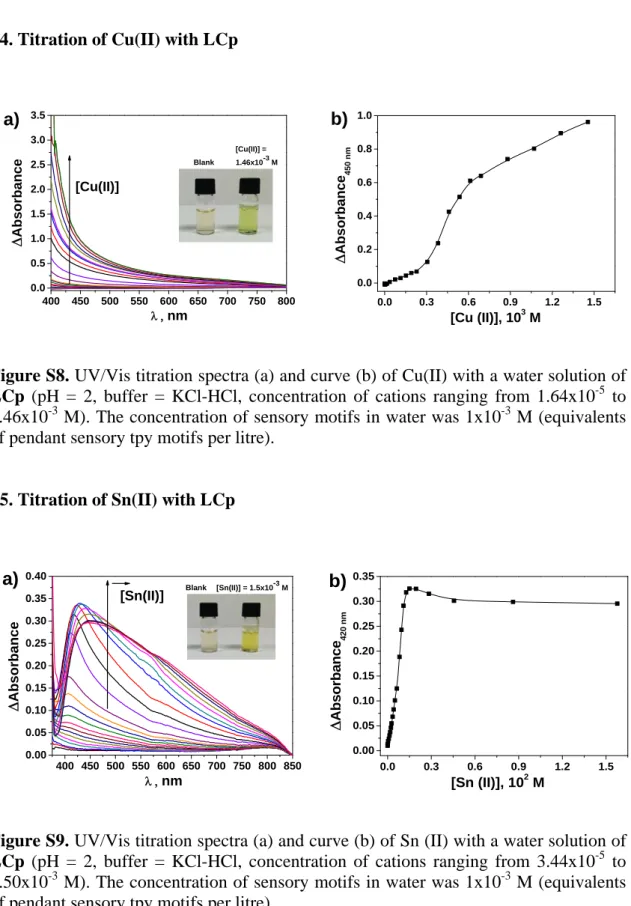
Figure S8. UV/Vis titration spectra (a) and curve (b) of Cu(II) with a water solution of
LCp (pH = 2, buffer = KCl-HCl, concentration of cations ranging from 1.64x10⁻⁵ to 1.46x10⁻³ M). The concentration of sensory motifs in water was 1x10⁻³ M (equivalents of pendant sensory tpy motifs per litre).
S5. Titration of Sn(II) with LCp
400 450 500 550 600 650 700 750 800 850 0.00
[Sn(II)] [Sn(II)] = 1.5x10 -3
Figure S9. UV/Vis titration spectra (a) and curve (b) of Sn (II) with a water solution of
carried out with the colour data of pictures taken to sensory squares cut from the
sensory membranes after immersing them in solutions of different concentrations of the
cations in water. The quantitative studies were done using the digital photograph taken
to sensory squares with a smartphone by treatment of the data of the color definition of
each square (RGB parameters, R = red, G = green, B = blue). These parameters were
obtained for each square directly after taking the photograph of the set squares through
analysis with a conventional Android smartphone (app ColourMeter, automatically
average 11 × 11 (121) pixels for each square). The three RGB parameters were reduced
to one variable (principal component 1, PC1), using principal component analysis
(PCA).
S6.1. Titration of Fe(III) with a picture taken to Mem1.
Table S2. Principal component analysis.
Component Eigenvalue Variance,
%
Cumulative, %
PC1 2.94419 98.140 98.140
PC2 0.05381 1.794 99.933
PC3 0.0020027 0.067 100.000
Table S3. Component weights
Variable PC1
R 0.582036
G 0.573253
B 0.576728
Table S1. RGB parameters and principal components obtained from the digital image of
squares cut from the sensory membrane Mem1 after immersion in water with Fe(III).
9
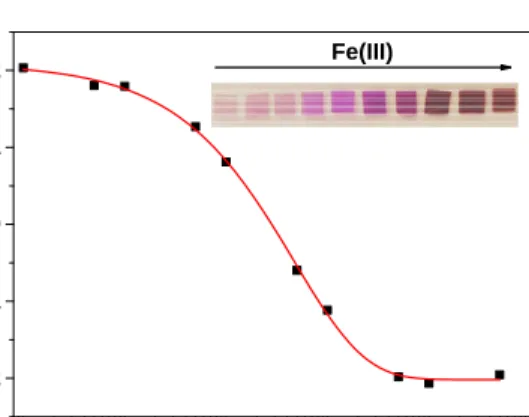
Figure S10. Titration curve of Fe(III) with
Mem1. The digital color parameters (R,G and B) of each membrane square are group in one variable (principal component 1, PC1) by principal component analysis (PCA). Squares cut brom Mem1 were immersed in water with concentration of Fe(III) ranging from 1x10⁻⁷ to 5x10⁻³ (pH = 2, buffer: KCl-HCl).
S6.2. Titration of Co(II) with a picture taken to Mem1.
Table S5. Principal component analysis.
Component Eigenvalue Variance,
%
Cumulative, %
PC1 2.53612 84.537 84.537
PC2 0.46185 15.395 99.932
PC3 0.00203299 0.068 100.000
Table S6. Component weights
Variable PC1
Table S4. RGB parameters and principal components obtained from the digital image of
squares cut from the sensory membrane Mem1 after immersion in water with Co(III).
10-7 10-6 10-5 10-4 10-3 10-2
Figure S11. Titration curve of Co(II) with
Mem1. The digital color parameters (R,G and B) of each membrane square are group in one variable (principal component 1, PC1) by principal component analysis (PCA). Squares cut brom Mem1 were immersed in water with conentration of Co(II) ranging from 1x10⁻⁷ to 5x10⁻³ (pH = 2, buffer: KCl-HCl).
S6.3. Titration of Cu(II) with a picture taken to Mem2.
Table S8. Principal component analysis.
Component Eigenvalue Variance,
%
Cumulative, %
PC1 2.91962 97.321 97.321
PC2 0.0757245 2.524 99.845
PC3 0.00465104 0.155 100.000
Table S9. Component weights
Variable PC1
Table S7. RGB parameters and principal components obtained from the digital image of
squares cut from the sensory membrane Mem1 after immersion in water with Fe(III).
11
Figure S12. Titration curve of Cu(II) with
Mem2. The digital color parameters (R,G and B) of each membrane square are group in one variable (principal component 1, PC1) by principal component analysis (PCA). Squares cut brom Mem2 were immersed in water with conentration of Cu(II) ranging from 9x10⁻⁵ to 3x10⁻² (pH = 2, buffer: KCl-HCl).
S6.4. Titration of Sn(II) with a picture taken to Mem2.
Table S11. Principal component analysis.
Component Eigenvalue Variance,
%
Cumulative, %
PC1 2.36076 78.692 78.692
PC2 0.632503 21.083 99.775
PC3 0.00674105 0.225 100.000
Table S12. Component weights
Variable PC1
Table S10. RGB parameters and principal components obtained from the digital image of
squares cut from the sensory membrane Mem1 after immersion in water with Fe(III).
10-4
Mem2. The digital color parameters (R,G and B) of each membrane square are group in one variable (principal component 1, PC1) by principal component analysis (PCA). Squares cut brom Mem2 were immersed in water with conentration of Sn(II) ranging from 9x10⁻⁵ to 3x10⁻² (pH = 2, buffer: KCl-HCl).
13
a)
400 450 500 550 600 650 700 0.0
400 450 500 550 600 650 700 750 800 0.0 Co(II), Al(III), Pb(II), Zn(II), Mg(II), Cd(II), Sn(II), Ni(II), Fe(III)
Figure S15. Interference study. Water solutions of LCp (concentration of sensory motifs was 1x10⁻³ M (equivalents of pendant sensory tpy motifs per litre)) upon adding a: a) cocktail of cations that forms coloured complexes with tpy motifs (Fe(III), Co(II), Cu(II), Sn(II). Concentration of each cation = 1.3x10⁻³ M); b) cocktail of 13 cations (Na+, K+, Li+, Cu(II), Co(II), Al(III), Pb(II), Zn(II), Mg(II), Cd(II), Sn(II) and Ni(II), Fe(III), Cu(II), Co(II)). Concentration of each cation = 9.09x10⁻⁴ M).
a)
504 567 630 693
0.00
0.00 2.10x10⁻⁶ 4.20x10⁻⁶ 6.30x10⁻⁶
0.01
B Interce 0.0107 0.00188
B Slope 7964.3 429.03007
Figure S16. Standard addition of an aqueous solution of Fe (III) to a water solution of