Physiological mechanisms involved in water use efficiency in grapevines
149
0
0
Texto completo
(2)
(3) Nosaltres, DR. JAUME FLEXAS SANS, Professor Titular de Fisiologia Vegetal DR. HIPÓLITO MEDRANO GIL, Catedràtic de Fisiologia Vegetal, i del Department de Biologia de la Facultat de Ciències de la Universitat de les Illes Balears. CERTIFIQUEM :. Que el present treball titulat “Physiological mechanisms involved in water use efficiency in grapevines”, presentat per Magdalena Tomás Mir per optar al TÍTOL univesitari oficial de DOCTOR per la Universitat de les Illes Balears dins del programa de doctorat en Biologia de les Plantes en Condicions Mediterrànies, s’ha realitzat sota la nostra direcció al Departament de Biologia de la Facultat de Ciències de la Universitat de las Illes Balears.. Revisat el present treball, autoritzem la seva presentació per què pugui ésser jutjada pel tribunal corresponent.. Palma de Mallorca, 23 d’Abril del 2012. Director. Director. Jaume Flexas Sans. Hipólito Medrano Gil. Autora. Magdalena Tomás Mir.
(4)
(5) Als meus pares, Joan i Malena.
(6)
(7) Acknowledgements. AGRAÏMENTS - ACKNOWLEDGEMENTS No em pensava mai que algun dia arribes el moment d’escriure els agraïments de la meva pròpia Tesi doctoral, però la vida ens prepara molts reptes en els que cada vegada ens hem de superar. Vos puc assegurar que aquesta Tesi ha estat un d’ells que amb molt d’esforç i voluntat, i l’ajuda de moltes persones ho he pogut aconseguir. Per això, vos vull donar les gràcies a tots. En primer lloc a tots els membres del grup de recerca de Biologia de les plantes en condicions Mediterrànies, pel vostre suport en tot moment, i per donarme l’oportunitat de pertànyer en aquest gran grup que no tan sols m’ha enriquit com a investigadora sinó també com a persona. En especial vull donar les gràcies als meus directores de Tesi, al Dr.Hipólito Medrano i al Dr. Jaume Flexas, perquè sense una bona direcció no hagués pogut arribar a port. A n’Hipólito pels seus grans consells i per la confiança que va posar en jo des del començament donantme l’oportunitat d’introduir-me en el món de la investigació i la viticultura quan tan sols era una estudiant de Biologia. A en Jaume, perquè malgrat tots els contratemps sempre ha estat devora jo per ajudar-me a entendre el món de la Fisiologia Vegetal i formar-me com a investigadora. Als doctors Jeroni Galmés i Josefina Bota que em varen iniciar a la recerca. Gràcies Jeroni per ensenyar-me a treballar amb precisió i eficàcia en el laboratori, pels teus grans consells i pels bons moments que hem passat junts. Gràcies Jose per haver-me recolzat ens els bons i no tan bon moments d’aquesta Tesi i per ensenyar-me a valorar el que tenim més enllà de la investigació. Als doctors Miquel Ribas (per fer de MacGyver quan sempre l’he necessitat i ensenyar-me el per què de tantes coses), Pepe Escalona (per haver-me ajudat tant aquest darrers anys de Tesi), Alex Gallé, Xavi Gulías, Miquel Àngel Conesa, Pep Cifre i Joan Rosselló, pel vostre recolzament i bons consells. A n’ Alícia i a en Tià per les rialles que hem compartit i per la seva ajuda en el meu treball que sense ells no hagués estat possible. A totes les persones que han passat per “ca’n Boom” des dels meus inicis: a na Ceci (por nuestros buenos momentos), na Maite, na Belen (perquè sempre m’has ajudat amb el que he necessitat), en Diego, n’Enrico, na Perla, na Cristineta, al catalanarro Igor, n’Ocho (l’amo d’u pi de Ternelles), en Pere, n’Alejandro, n’Alfonso, na Hanan (por ser como eres), n’Amani, na Carmen ,na Veriozka, en Xurxo, en JJ i n’Arantxa (por. i.
(8) Acknowledgements. contagiarme tus ganas de vivir), perquè gràcies a voltros sempre hi hagut un bon ambient de feina i heu estat al meu costat quan vos he necessitat. Gràcies a les “chicas de ca’n boom” pels sopars i quedades que hem fet i que tant m’han ajudat per oblidar els mals de cap de la feina. A en Miquel Truyols i Pep Sastre pel suport que ens han donat a la nostra recerca tots aquests anys. I would also like to state my gratitude to Dr. Enrico Brugnoli and his research group from the consiglio nazionale delle ricerche (CNR; Porano, Italy), and to Dr. Ülo Niinemets and his research group from Institute of Agricultural and Environental Sciences, Estonia. Thank you for allowing me to be part of your laboratories. I’m also very grateful to Miguel, Vivian, Lea, Tiina, Steffan and Lucian for being so nice outside of the laboratory making funnier my stage (saunas, summer parties, wine tasting…) in spite of the freezing weather of Estonia. A les meves amigues de ciutat, Pilar, Ivette, Ana, Elisa i Cristina, i a tota la tropa esporlerina (que no anomen un per un perquè sinó no acabaria mai), pels bons moments que hem passat junts que m’han permès desconnectar i gaudir del temps lliure. A tota la meva família banyalbufarina i ciutadana, que sense sabre molt bé si estudiava, feia feina o què feia sempre m’han animat amb el que fos el que estava fent. A la meva família esporlerina, especialment a na Margalida i en Miquel que sempre m’han tractat com a una filla més. I de manera molt especial, encara que mai serà suficient, vull donar les gràcies als meus pares i germans, perquè ells han estat el pilar de la meva formació i els responsables de que hagi arribat aquí a on soc, a voltros vos ho dec tot, el que tenc i el que soc. Gràcies a mu mare perquè tan sols els seus consells han estat els que m’han calmat, consolat i anima’t, i per ensenyar-me a valorar el que realment és important. Gràcies a mon pare que m’ha ensenyat a ser feinera i precisa, i que amb la seva saviesa i la seva experiència m’ha ajudat molt en el món de la viticultura. Gràcies als meus germans Maria, Xesc, al meu quasi germà Marc i a la nouvinguda Rosa que mai han entès molt bé el per què del sacrifici de tantes hores lliures però que sempre han estat al meu costat i han cregut en mi. I com no, gràcies a les meves nines, n’Aina i n’Irene, que cada dematí m’han contagiat la seva alegria i m’han donat la força per continuar el dia a dia d’aquests quatre anys.. ii.
(9) Acknowledgements. Finalment i de manera molt especial vull donar les gràcies a la persona que duc dins el meu cor, en Pere, per estar sempre al meu costat, entendre la meva feina ajudant-me a qualsevol cosa i a qualsevol moment, i per escoltar-me i animar-me quan més ho he necessitat. Gràcies de tot cor .. Gràcies a tots. iii.
(10) iv.
(11) Symbols and Abbreviations List. SYMBOLS AND ABBREVIATIONS LIST Symbols ς. α ABA AN AOP ATP β Ca Cc Ce Ci Ci* Co COP Cs cw ∆13C. ∆i ∆Li ∆Lias ∆obs Da DL Dw E Enight ET0 ETR (Jflu) ФCO2 ФPSII F F’m F0 fias Fm Fo Ft Fv/Fm Γ* gb gct gcut gcw genv gias glip gliq gm. Meaning diffusion path tortuosity leaf absorptance abcisic acid net CO2 assimilation rate alternative oxidase pathway adenosine triphosphate fraction of absorbed light that reaches photosystem II atmospheric CO2 concentration chloroplastic CO2 concentration CO2 concentration of air entering in the gas exchange chamber sub-stomatal CO2 concentration apparent CO2 photocompensation point CO2 concentration of air leaving the gas exchange chamber cytochrome oxidase pathway leaf surface CO2 concentration cell wall carbon isotope discrimination carbon isotope discrimination predicted diffusion path length half of mesophyll thickness carbon isotope discrimination observed diffusion coefficient for CO2 in the gas-phase leaf density aqueous phase diffusion coefficient for CO2 leaf transpiration rate leaf night transpiration Evapotranspiration electron transport rate apparent quantum efficiency of CO2 fixation maximum quantum efficiency of the PSII photochemistry curvature correction factor maximum fluorescence in light-adapted state basal fluorescence of a dark adapted leaf volume fraction of intercellular air spaces maximum fluorescence in dark-adapted state basal fluorescence of the dark adapted leaf steady state fluorescence emission maximum quantum efficiency of PSII photochemistry CO2 compensation point in the absence of mitochondrial respiration boundary layer conductance cytosol conductance cuticular conductance cell wall conductance chloroplast envelope conductance intercellular air space conductance to CO2/ gas phase conductance lipid phase conductance liquid phase conductance mesophyll conductance. v.
(12) Symbols and Abbreviations List Symbols gnight gpl gs gsc gstr gtot IBA Ja Jf Jmax Kc Kcat Ko LA LAI lb Lchl li lias Lm lm ls MA NPQ Oi PAR PB PCB PEPC pi PPFD PRD QA Rd RDI RGR RL Rleaf ROS Rroot Rstem Rub Sc/S Sm/S Ss SWC Τ Tcw Tcyt TL tmes TPU Tsoil vc. vi. Meaning night conductance plasmalemma conductance stomatal conductance to H2O stomatal conductance to CO2 chloroplast stroma conductance total conductance indolbutyric acid linear electron transport rate by gas exchange linear electron transport rate by chlorophyll fluorescence Maximum photosynthetic electron transport rate Michaelis constant for the carboxylation activity of Rubisco in vivo specific activity of Rubisco per active sites Michaelis constant for the oxygenation activity of Rubisco leaf area leaf are index biochemical limitation length of chloroplasts exposed to intercellular air spaces liquid and lipid phase limitation gas phase limitation length of mesophyll cells exposed to intercellular airspaces mesophyll limitation stomatal limitation leaf mass per area non-photochemical quenching leaf internal oxygen concentration photosynthetic active radiation plant biomass whole plant carbon balance phosphoenolpyruvate carboxylase effective porosity photosynthetic photon flux density partial root drying quinone A leaf dark respiration regulated deficit irrigation relative growth rate leaf light respiration leaf respiratioin reactive oxygen species root respiration stem respiration Rubisco chloroplast surface area exposed to intercellulare air spaces mesophyll surface area exposed to intercellulare air spaces cross sectional area of mesophyll cells soil water content Rubisco specificity factor cell wall thickness cytoplasm thickness leaf thickness mesophyll thickness triose phosphate soil temperature velocities of carboxylation of Rubisco.
(13) Symbols and Abbreviations List Symbols Vc,max vo Vo,max VPD VTPU w WUE WUEc WUEi (AN/gs) WUEinst (AN/E) WUEl WUEWP WUEy δ13C δe δo ΨMD ΨPD. Meaning maximum rates for the carboxylation activity of Rubisco velocities of oxygenation of Rubisco maximum rates for the oxygenation activity of Rubisco vapour pressure deficit velocity of triose-phosphate utilization rate width of leaf anatomical section water use efficiency crop water use efficiency intrinsic water use efficiency instantaneous water use efficiency leaf water use efficiency whole plant water use efficiency yield water use efficiency carbon isotope composition isotopic composition of CO2 entering in gas exchange chamber isotopic composition of CO2 leaving gas exchange chamber midday leaf water potential predawn leaf water potential. vii.
(14) viii.
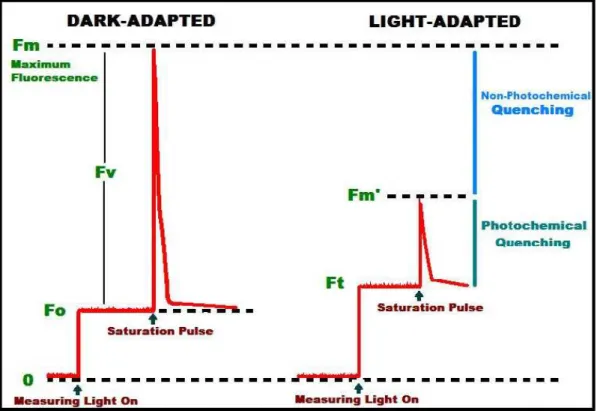
(15) Contents. CONTENTS AGRAÏMENTS - ACKNOWLEDGEMENTS ...................................................................i SYMBOLS AND ABBREVIATIONS LIST ......................................................................v CONTENTS .................................................................................................................................ix. Chapter 1. INTRODUCTION ............................................................................. 1 1.1. WATER STRESS AND MEDITERRANEAN CLIMATE .......................................................2 1.1.1. The importance of water stress in plants ..........................................................................2 1.1.2. The special interest of Mediterranean climate areas ........................................................2 1.2. GRAPEVINE: A CLASSIC MEDITERRANEAN CROP ........................................................4 1.3. WATER USE EFFICIENCY .....................................................................................................5 1.3.1. Concepts of water use efficiency .....................................................................................5 1.3.2. Methodologies to determine water use efficiency............................................................8 1.3.3. Improvement of water use efficiency.............................................................................10 1.3.3.1. Agronomical management practices.............................................................10 1.3.3.2. Genetic variability of water use efficiency ...................................................11 1.3.3.3. Potential physiological targets for plant breeding and biotechnology ..........12 1.4. PROMISING PHYSIOLOGICAL PARAMETERS TO IMPROVE WATER USE EFFICIENCY..................................................................................................................................16 1.4.1. Mesophyll conductance to CO2 ......................................................................................16 1.4.1.1. Variability of gm among species and responses of gm to environmental variables.....................................................................................................................18 1.4.1.2. Mechanisms that determine gm .....................................................................21 1.4.1.3. Mesophyll conductance (gm) in grapevines ..................................................23 1.4.2. Cuticular and night conductance ....................................................................................24 1.4.2.1. Variability and factors affecting night conductance (gnight) ..........................24 1.4.2.2. Cuticular and night conductance in grapevines ...........................................27 1.4.3. Plant respiration .............................................................................................................28 1.4.3.1. The importance of leaf respiration and its functions.....................................28 1.4.3.2. Respiration in grapevines..............................................................................31. Chapter 2. OBJECTIVES AND OUTLINE ..................................................... 33 2.1. GENERAL OBJETIVES .........................................................................................................34 2.2. SPECIFIC OBJECTIVES ........................................................................................................34 2.3. OUTLINE OF THE THESIS ...................................................................................................35 2.4. PUBLICATIONS DERIVED FROM THE PRESENT THESIS .............................................37. Chapter 3. MATERIAL AND METHODS .......................................................39 3.1. PLANT MATERIAL ...............................................................................................................40 3.2. GROWTH CONDITIONS .......................................................................................................42 3.3. WATER STRESS TREATMENTS ........................................................................................43 3.4. MEASUREMENTS .................................................................................................................43 3.4.1. Plant and soil water status ..............................................................................................43 3.4.1.1. Leaf water potential..........................................................................................43 3.4.1.3. Soil water content .............................................................................................44 3.4.2. Chlorophyll fluorescence measurements........................................................................44. ix.
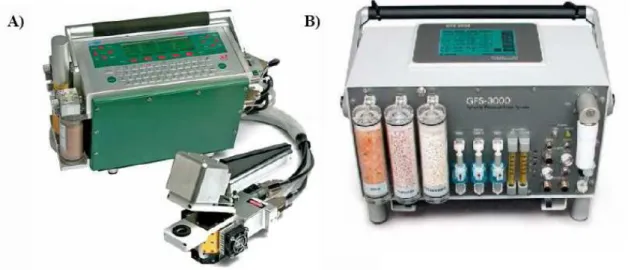
(16) Contents 3.4.2.1. The Fluorescence parameters........................................................................... 45 3.4.3. Gas exchange measurements......................................................................................... 47 3.4.3.1. IRGA overview................................................................................................ 47 3.4.3.2. Leaf gas exchange measurements.................................................................... 50 3.4.3.2.1. Instantaneous gas exchange measurements ................................ 50 3.4.3.2.2. AN-Ci curves ............................................................................... 50 3.4.3.2.3. Respiration in the light and apparent CO2 photocompensation point............................................................................................................ 51 3.4.3.2.4. Cuticular conductance................................................................. 52 3.4.3.2.5. Leaks........................................................................................... 52 3.4.3.3. Respiration measurements ............................................................................... 53 3.4.3.3.1. Leaf respiration ........................................................................... 53 3.4.3.3.2. Root respiration .......................................................................... 54 3.4.3.3.3. Stem respiration .......................................................................... 55 3.4.4. On-line measurements of stable carbon isotope discrimination .................................... 57 3.4.5. Water use efficiency...................................................................................................... 58 3.4.5.1. Intrinsic (AN/gs) and instantaneous (AN/E) water use efficiency ..................... 58 3.4.5.2. Carbon isotope composition in leaf dry matter................................................ 58 3.4.5.3. Whole plant water use efficiency..................................................................... 59 3.4.6. Leaf anatomy................................................................................................................. 59 3.4.6.1. Light microscopy............................................................................................. 60 3.4.6.2. Electron microscopy ........................................................................................ 60 3.4.7. Leaf morphological parameters ..................................................................................... 61 3.4.7.1. Leaf mass per area and leaf density ................................................................. 61 3.4.8. Other measurements ...................................................................................................... 62 3.4.8.1. Leaf area .......................................................................................................... 62 3.4.8.2. Rubisco Content .............................................................................................. 62 3.4.8.3. Specific activity of Rubisco in vivo (kcat) ........................................................ 63 3.4.8.4. Extraction of leaf soluble sugars...................................................................... 63 3.4.8.5. Leaf absorptance.............................................................................................. 64 3.5. CALCULATIONS .................................................................................................................. 64 3.5.1. Estimation of mesophyll conductance (gm) to CO2 ....................................................... 64 3.5.1.1. Estimation of gm with gas exchange and chlorophyll fluorescence ................. 64 3.5.1.1.1. Parameters derived from AN-Cc curves........................................... 66 3.5.1.2. Estimation of gm with gas exchange only: the curve-fitting method ............... 67 3.5.1.3. Estimation of gm with gas exchange and 13C isotope discrimination ............... 68 3.5.1.4. Estimation of gm from anatomical parameters ................................................. 70 3.5.2. Quantitative limitation analysis..................................................................................... 72 3.5.2.1. Quantitative analysis of photosynthesis limitations......................................... 72 3.5.2.2. Quantitative analysis of limitations on mesophyll conductance ...................... 72 3.5.3. Plant carbon balance...................................................................................................... 73. Chapter 4. IMPROVEMENT OF WATER USE EFFICIENCY IN GRAPEVINES ..................................................................................................... 75 4.1. IMPROVING WATER-USE-EFFICIENCY IN GRAPEVINES: POTENTIAL PHYSIOLOGICAL TARGETS FOR BIOTECHNOLOGICAL IMPROVEMENT ..................... 75. x.
(17) Contents. Chapter 5. VARIABILITY OF MESOPHYLL CONDUCTANCE AND MECHANISTIC BASIS OF THESE VARIATIONS.......................................77 5.1. IMPORTANCE OF LEAF ANATOMY IN DETERMINING MESOPHYLL DIFFUSION CONDUCTANCE TO CO2 ACROSS SPECIES: QUANTITATIVE LIMITATIONS AND SCALING UP BY MODELS .........................................................................................................77 5.2. MESOPHYLL CONDUCTANCE VARIABILITY IN GRAPEVINE CULTIVARS IN RELATION TO LEAF ANATOMY AND WATER STRESS ......................................................77. Chapter 6. WATER USE EFFICIENCY AT LEAF AND WHOLE PLANT LEVEL ..................................................................................................................79 6.1. WATER USE EFFICIENCY IN GRAPEVINE CULTIVARS GROWN UNDER CONTROLLED CONDITIONS: EFFECTS OF WATER STRESS AT THE LEAF AND WHOLE PLANT LEVEL ..............................................................................................................................79. Chapter 7. IMPORTANCE OF PLANT RESPIRATION, CUTICULAR AND NIGHT TRANSPIRATION IN WHOLE PLANT WATER USE EFFICIENCY.......................................................................................................81 7.1. RESPONSES OF LEAF NIGHT TRANSPIRATION TO WATER STRESS IN VITIS VINIFERA L....................................................................................................................................81 7.2. CARBON BALANCE IN GRAPEVINES UNDER DIFFERENT SOIL WATER SUPPLY: IMPORTANCE OF WHOLE PLANT RESPIRATION.................................................................81. Chapter 8. GENERAL DISCUSSION ...............................................................83 8.1. MECHANISMS THAT DETERMINE gm AND ITS EFFECTS ON LEAF WUE .................84 8.2. DOES LEAF WUE DETERMINE WHOLE PLANT WUE? ..................................................86 8.3. PHYSIOLOGICAL MECHANISMS THAT CAN AFFECT WHOLE PLANT WUE ...........88 8.4. GENERAL OVERVIEW .........................................................................................................90. Chapter 9. CONCLUSIONS ...............................................................................93. REFERENCES LIST...........................................................................................97. xi.
(18) xii.
(19) Introduction. Chapter 1 INTRODUCTION. 1.1. WATER STRESS AND MEDITERRANEAN CLIMATE .......................................................2. 1.1.1. The importance of water stress in plants ............................................................ 2 1.1.2. The special interest of Mediterranean climate areas........................................... 2 1.2. GRAPEVINE: A CLASSIC MEDITERRANEAN CROP ........................................................4 1.3. WATER USE EFFICIENCY .....................................................................................................5. 1.3.1. Concepts of water use efficiency........................................................................ 5 1.3.2. Methodologies to determine water use efficiency.............................................. 8 1.3.3. Improvement of water use efficiency ............................................................... 10 1.3.3.1. Agronomical management practices.................................................... 10 1.3.3.2. Genetic variability of water use efficiency .......................................... 11 1.3.3.3. Potential physiological targets for plant breeding and biotechnology. 12 1.4. PROMISING PHYSIOLOGICAL PARAMETERS TO IMPROVE WATER USE EFFICIENCY..................................................................................................................................16. 1.4.1. Mesophyll conductance to CO2 ........................................................................ 16 1.4.1.1. Variability of gm among species and its response to environmental variables ........................................................................................................ 18 1.4.1.2. Mechanisms that determine gm ............................................................ 21 1.4.1.3. Mesophyll conductance (gm) in grapevines ......................................... 23 1.4.2. Cuticular and night conductance ...................................................................... 24 1.4.2.1. Variability and factors affecting night conductance (gnight) ................. 24 1.4.2.2. Cuticular and night conductance in grapevines .................................. 27 1.4.3. Plant respiration................................................................................................ 28 1.4.3.1. The importance of leaf respiration and its functions ........................... 28 1.4.3.2. Respiration in grapevines .................................................................... 31. 1.
(20) Chapter 1. 1.1. WATER STRESS AND MEDITERRANEAN CLIMATE 1.1.1. The importance of water stress in plants Water is an essential component for the plants life owing to the crucial role that water plays in all physiological processes. Water comprises 80 to 95% of the fresh weight of most herbaceous plants and 50% of woody plants. The physical and chemical properties of water make it essential for many functions in plants such as: a constituent of most parts of plants, a solvent providing a good medium for biochemical reactions and transport, a reactant in different processes such as photosynthesis, respiration and other enzyme-mediated processes; and in the maintenance of turgidity in plants. Plant physiological processes are directly affected by the amount of water that plants can extract from the soil. Water stress limits plant growth and crop production more than any other single environmental factor (Boyer, 1982). Stomatal closure, together with leaf growth inhibition, are among the first processes affected in response to drought, protecting plants from extensive water losses and reducing the source of assimilates (photosynthetic rate) and, consequently, the resulting biomass. Therefore, many studies have focused their attention on the importance of drought as one of the most important constrains limiting growth in plants and crops and the ecosystem productivity worldwide (Passioura, 1996). Furthermore, water is a key element determining vegetation type, plant distribution and its survival which strongly depend on their ability to adjust to environmental variations. Therefore, different genotypes have adapted to a lack of water in the environment avoiding or tolerating drought. These strategies can be observed in Mediterranean type vegetation where plants with predominant drought-avoidance strategies, which die when they run out of water, coexist with drought-tolerant sclerophylls. As a result, large variations among species in photosynthetic response to water stress can be observed (Sullivan et al., 1974), affecting the distribution of the species (Wuenscher & Kozlowski, 1971; Chaves et al., 2007).. 1.1.2. The special interest of Mediterranean climate areas There are five regions over the world that present Mediterranean climate. They are located between 32º- 40º North and South of the Equator, in the west. 2.
(21) Introduction. side of the continents (Aschmann, 1973). The Mediterranean Basin, surrounding the Mediterranean Sea, is the largest area where this climate type is found. It also prevails in coast of California, parts of Western and South Australia, the southwest of South Africa, sections of Central Asia, and parts of the central coast of Chile. All these areas combined represent between 1% and 4% of the land surface (di Castri, 1981; Mooney, 1982). They are characterized by hot and dry summers and cool and wet winters (Köppen, 1923). Winter temperatures are mild (7-13ºC) with infrequent frosts and snow, whereas summers are hot with mean temperatures of 14-25ºC (Paskoff, 1973). On the other hand, the annual precipitation ranges from 275 to 900 mm/year (Conacher, 1995; Conacher & Sala, 1998). Most rainfall falls during winter months, and this is one of the key elements that differentiate Mediterranean, Temperate and Subtropical climates. According to Aschmann (1973) more than 65% of the annual rainfall generally falls in winter, although in some areas this may variate (Köppen, 1923) with important spring and autumn rains (Southern California and Southern Europe – Miller, 1983). During summer, a drought period is present with variable length and intensity between years. Thus, in these areas, progressive soil water deficits and high leaf-to-air vapour pressure gradients, together with high irradiance and temperatures, exert large constraints on plants, including crops yield and quality. Moreover, in addition to water limiting conditions during the dry season, plant growth is also constrained by cold temperatures during winter, since the growth of many Mediterranean species is limited when daily mean temperatures are below 10ºC (Rambal, 2001), a common event in the Mediterranean Basin. Consequently, the most important characteristic of this type of climate is the absence of a period with both favourable temperatures and high soil water availability. Most of the present Thesis research was developed in the Balearic Islands, located in the Mediterranean Basin. This area is characterized by summer periods with high irradiance, air temperature and high evaporative demand combined with drought, limiting plant growth and productivity (Chaves et al., 2007). Moreover, according to climate change predictions (IPCC 2007), soil moisture content could decrease even more. It is expected that soil water availability could decrease from 20-30% for most of the Mediterranean areas and it can be down to 70% in the Iberian Peninsula and the Balearic Islands, caused by increasing temperature induced by a two-fold increase of the current levels of CO2 concentration 3.
(22) Chapter 1. expected during the next century (Schultz, 2000). This situation would imply the need of irrigation and a more efficient use of water in agronomical practices, as well as selecting plants more adapted to drought-prone areas. A large part of the agricultural production in the Mediterranean Basin comes from irrigated areas. Hence, agriculture consumes about 80% of water in the region (Rijsberman, 2004). Increasing growing population and aridity in Mediterranean areas, as suggested by climate change predictions, will convert water into a scarce commodity. Thus, how to reduce agricultural water use and make water resources more sustainable is an increasingly urgent need. Solving it requires combined agronomic, physiological, biotechnological/genetic and engineering approaches to save water.. 1.2. GRAPEVINE: A CLASSIC MEDITERRANEAN CROP Grapevines are one of the oldest cultivated plants that, along with the process of making wine, have resulted in a rich geographical and cultural heritage (Johnson, 1985; Penning-Roswell, 1989; Unwin, 1991). Grapevine is one of the major horticultural crops produced on a worldwide basis and is mainly located in Mediterranean areas (Mullins et al., 1992). Vines can be cultivated from Temperate (from 30-50º North or South) to Tropical climates, but most vineyards are planted in Temperate zones with high variability of environmental conditions. Considering its large cultivation area, the most significant grape-growing region is Europe, with 4.4 million hectares. Among all countries, Spain accounts for the largest grape-producing areas (1.082.000 Ha) with a prolific economy (1.200-1.900 M€), representing more than 10% of its total agricultural production, a socioeconomic profit (with about 400.000 wine producers) and an environmental-landscape profit (OIV, Organisation Internationale de la Vigne et du Vin, 2011) The range and magnitude of environmental factors (e.g., solar radiation, heat accumulation, extreme temperatures, precipitation, wind, and extreme weather events such as hail) differ considerably from region to region and are the principal environmental constraints for grape production and wine quality. Water shortage is probably the most dominant environmental constraint within the production areas (Williams & Matthews, 1990). The combined effect of drought. 4.
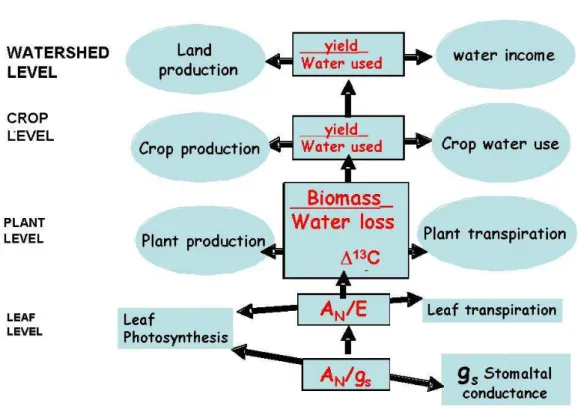
(23) Introduction. with periods of high air temperature and high evaporative demand during the grapevine growing season limit grapevine yield as well as berry and wine quality (Escalona et al., 1999a; Chaves et al., 2007; Costa et al., 2007). In addition, the combined effect of these stress conditions may promote dramatic reductions in plant carbon assimilation due to a severe decline of photosynthesis, as well as to a partial loss of canopy leaf area (Flexas et al. 1998, 2002; Maroco et al., 2002; Chaves et al., 2003, 2007; Santos et al., 2007). In general, the grapevine crop areas in Spain are semi-arid (i.e Mediterranean) and, consequently, although it is a typical dry land crop, irrigation practices have been progressively adopted in this crop and they have become common in modern Mediterranean viticulture. Moreover, it has been demonstrated in different conditions that soil water availability regulates crop load and fruit quality. Excess of water can reduce colour and sugar content of fruit and produce imbalanced acidity wine (Matthews et al., 1990; Medrano et al., 2003; Romero et al., 2010), while a drastic reduction of water will reduce crop yield and frequently fruit quality. Therefore, the heterogeneity in grapevine responses to soil water deficit and the difficulty to establish the optimum water dosage to be used in a given environment and cultivar explain the need to study the physiological responses to water stress in grapevines (Medrano et al., 2002, 2003; Flexas et al. 2002, 2006a).. 1.3. WATER USE EFFICIENCY 1.3.1. Concepts of water use efficiency The term WUE reflects the balance between gains (kg of biomass produced or mols of CO2 assimilated) and costs (m3 of water used or mols of water transpired). This balance can be measured at different space scales (Medrano et al., 2010) (Fig. 1.1) from leaves (the ratio of net assimilation vs leaf transpiration) to whole plant or crop. Furthermore, this term can be studied at different time scales from months (ie. biomass accumulation or yield) to minutes (instantaneous exchange of water vapour for carbon dioxide). At the leaf level, WUE can be measured at short (instantaneous gas exchange measurements) or long term (carbon isotope ratio of leaf dry matter). The carbon isotope ratio of leaf dry matter (δ13C) is determined by the gradient. 5.
(24) Chapter 1. between CO2 concentration in the substomatal cavity (Ci) and the atmosphere (Ca), established by the level of discrimination against 13C (∆13C), and is often regarded as an integrative estimation of leaf WUE (WUEl) over the growth period (Farquhar & Richards 1984). At shorter term, it is common to use single leaf gas exchange measurements, relating net CO2 assimilation rate (AN) either to stomatal conductance (gs), called intrinsic water use efficiency (WUEi), or AN to leaf transpiration rate (E), defined as instantaneous water use efficiency (WUEinst) (Fischer & Turner, 1978) (Fig. 1.1). WUEinst (AN/E) is influenced by the environmental conditions, because E depends on the degree of stomatal opening and vapour pressure deficit (VPD) of the atmosphere surrounding the leaf (E= gs · VPD). On the other hand, WUEi (AN/gs) excludes the effects of changing evaporative demand on water flux out of the leaf depending only on the stomatal opening (Bierhuizen & Slatyer, 1965). Therefore, it is of particular interest to determine intrinsic differences in water use efficiency independent of specific environmental conditions (Bota et al., 2001; Souza et al., 2005; Anyia et al., 2007; Barbour et al., 2010; Gómez-Alonso et al., 2010; Galmés et al., 2011; Zegada-Lizarazu et al., 2011). WUEinst (AN/E) can also be used as daily estimation of WUE using the daily integrals of AN and E (i.e., the accumulated carbon gain and water loss during a whole day by a given leaf) (Medrano et al. 2003). In addition, when leaf area is included in this daily estimation, WUEl could be scaled up to whole plant WUE (WUEWP) (Medrano et al. 2012). Whole plant WUE (WUEWP) is the balance between total plant dry matter production and total water consumption by plant. In grapevines in particular, transpired water depends on canopy structure and growth (leaf angle in relation to the incoming irradiance and shoot positioning) determining the light interception by the plant or the energy load by transpiration (Escalona et al., 2003; Medrano et al., 2012) (Fig.1.1). Moreover, WUEWP depends on water losses during nonassimilatory periods (cuticular and night transpiration) (Caird et al. 2007), and it is also dependent on respiration in leaves, stems and roots during whole day. These processes are not considered in the leaf gas exchange measurements to estimate WUEl, therefore, these physiological processes could decrease WUEWP and not influence WUEl estimates.. 6.
(25) Introduction. For agronomic purposes it is more common to study WUE at yield level (WUEy). Yield WUE (WUEy) is defined as the balance between the total production of harvested yield, and total water consumption during the season by the crop. In grapevines, bunches are the most active sink for photosynthates. Grapes constitute only 20-30% of total plant dry biomass but up to 80-90% of total photosynthesis assimilates obtained in one growing season are transported to the fruits (Bota et al. 2004). Therefore, for practical purposes, in grapevines it is a convenient procedure to take into account WUEy as an optimum target to improve WUE. At the crop level, WUE is defined as the amount of yield produced per unit of water used (WUEc). This concept depends on crop water consumption during the growing season. This is the sum of the amount of water lost not being used by the plants (runoff, percolation and direct soil evaporation) plus the water transpired by the plant (Fig. 1.1). The losses of water that are not directly consumed by the crop can be avoided with agronomical practices (cover crops, deficit irrigation, drip irrigation, night irrigation, etc.). Total irrigation joint with yield can provide a rough estimate of WUEc and can help to develop a sustainable crop. The present Thesis focuses mainly in WUE at leaf and whole plant level.. Figure 1.1. Theoretical diagram of the components of WUE showing the dependency of crop water use efficiency (WUEc) on different processes and its links with leaf WUE (WUEl). LAI, leaf are index; VPD, vapour pressure deficit; gs, stomatal conductance; AN, net photosynthesis rate; E, transpiration rate; gm, mesophyll conductance; τ, Rubisco specificity for CO2. From Flexas et al. (2010). 7.
(26) Chapter 1. 1.3.2. Methodologies to determine water use efficiency The methodologies for WUE measurements can be described on the basis of time/space scale of its determinations; from instantaneous leaf measurements to surrogate parameters such as δ13C for the whole growth season in a plant (see Medrano et al., 2010) (Fig. 1.2). As stated above, leaf WUE (WUEl) can be easily determined as the ratio between net CO2 assimilation rate (AN) and transpiration rate (E) or stomatal conductance (gs). AN/E and AN/gs are measured by gas exchange systems near steady-state conditions in the field obtaining an instantaneous and non destructive measurement that reflects the leaf capacity for WUEl. In addition, WUEl can be measured by carbon isotope ratio of leaf dry matter (δ13C), often used as an indicator of long-term WUE (Farquhar & Richards, 1984). Stable isotope discrimination can be measured on-line to give instantaneous measurements of WUE (Condon et al., 1990) or short-term WUE (1-2 days) by measuring the isotopic composition of leaf soluble sugars (Brugnoli et al., 1988). However, the major impact of the use of stable isotopes has been in the analysis of dry matter to provide a simple and rapid screening method that integrates WUE over time, given the fact that carbon isotope ratio of tissue carbohydrates depends on the processes involved for their synthesis. This technique is based on the differential use of carbon isotopes by the enzymes that fix CO2, RUBP carboxylase (Rubisco) and PEP carboxylase, as well as on the physical differences of the isotopes that induce different diffusivities (O’Leary et al., 1992). Carbon isotope discrimination has generally been related to Ci/Ca according to the equation developed by Farquhar et al. (1982a): ∆ = a + (b – a) Ci/Ca where a is the fractionation occurring due to diffusion in air (4.4‰), b is the net fractionation caused by RuBP2 and PEP carboxylation (between 27‰ – 30‰ ), and Ci/Ca is the ratio between CO2 concentration in intercellular spaces (Ci) and ambient air (Ca). CO2 diffuses into leaves through stomata. During diffusion, the heavier. 13. CO2 molecules diffuse more slowly. Thus, the air inside. the leaf pore space (Ci) is depleted in 13CO2. The concentration of CO2 inside the leaf depends on the rate of photosynthesis and the opening of the stomatal pores, which in turn influences isotopic discrimination (∆13C) – higher Ci/Ca results in greater ∆13C, while lower Ci/Ca reduces ∆13C –. This implies that changes in AN 8.
(27) Introduction. and gs modify Ci/Ca ratio and, therefore, the carbon isotope composition of plant tissues (δ13C) and WUE. To determine WUEWP, soil water evaporation, percolation and runoff must be minimized. Thus, to use gravimetric methods (or individual lysimeters) in potted plants to measure plant water transpiration is a reasonable approach. In addition, this method allows determining accurately the biomass production. However, canopy of potted plants does not match properly with real canopies in the crop, and the roots development is constrained which could modify plant development. As an alternative for gravimetric estimates, the use of lysimeters or sap flow meters (in the case of woody plants) are optional techniques to obtain good measurements of plant water consumption in the field (Kostner et al., 1998; Escalona et al., 2002; Netzer et al., 2005). However, these methods present other limitations. In relation to sap flow meters, the accuracy of the method depends on stem characteristics and fluxes rates of the plant studied. On the other hand, lysimeters involve building a complex and expensive equipment in the middle of a standard crop. Therefore, in spite of the limitations described for the gravimetric method in potted plants, it seems to be the most adequate method to compare environmental and genetic effects on WUEWP. Crop WUE depends on the crop characteristics and environmental variability. Canopy crop, water losses from the soil profile and the unknown root system (length and depth) need to be considered to determine WUEc. Eddy covariance has been proposed as the more suited technique to derive global carbon and water fluxes at the local scale (Valentini et al., 2000; Trambouze et al., 1998; Spano et al., 2004). Thus, it is a promising approach to provide gross estimates of WUEc.. 9.
(28) Chapter 1. Figure 1.2. Different levels for water use efficiency measurement. From leaf to watershed, (instantaneous to growth season or yearly basis) there is a progressive integration of different crop production processes and water expenses with different measurement techniques implicated to determine the final WUE balance (Medrano et al., 2010).. 1.3.3. Improvement of water use efficiency 1.3.3.1. Agronomical management practices Proper crop management practices are a key procedure to optimize crop production with limited water supplies. Among agronomical practices, canopy management is the most common technique used. In grapevines in particular, canopy management consist of several practices which can be addressed to increase soil water availability, regulating the plant water necessities and reducing watering volumes. These practices have an effect on soil, microclimate, plant growth, yield, grape composition, wine quality and also on light absorption by the canopy and, consequently, in photosynthetic activity and water losses (Smart et al., 1990; Hunter et al., 1995, 2000; Williams & Ayars, 2005). Moreover, there are other techniques related to vineyard management such as the use of mulching (Gregory et al., 2004) and cover crops (Pou et al., 2011; Monteiro & Lopes, 2007), to control the vegetative vigour and reduce transpiration losses. However, the most effective way to increase water use efficiency in the vineyard is the 10.
(29) Introduction. precise control of irrigation. Several systems to regulate irrigation have been developed such as regulated deficit irrigation (RDI) and partial root drying (PRD), which are often supported by plant-based water status indicators to adjust the irrigation protocol (trunk diameter sensors, sap flow meters, infrared thermometry, etc.). Under RDI method, water is supplied at levels below full crop evaporation during the growing season optimizing the number of fruits, fruit size and quality, and keeping grapevine vigour in balance with potential production (Souza et al., 2005; Romero et al., 2010). PRD method involves the exposure of about half of the roots in a drying state while the remaining root system is irrigated, altering the irrigated roots in cycles of 2-3 weeks. Root zone exposed to soil drying induces a root-to-shoot signalling mechanism, such as abcisic acid (ABA) synthesis, that causes partial stomatal closure maintaining a good plant water status due to the watered root side (Stoll et al., 2000; Santos et al., 2003; De la Hera et al., 2007). 1.3.3.2. Genetic variability of water use efficiency Inter-specific natural variations in WUE have been observed in many species (Anyia et al., 2007; Medrano et al., 2009; Barbour et al., 2010; Shao et al., 2010; Galmés et al., 2011; Daymond et al., 2011; Lelièvre et al., 2011) including grapevines (Bota et al., 2001; Gaudillère et al., 2002; Schultz, 2003; Souza et al., 2005; Pou et al., 2008; Koundouras et al., 2008; Zsofi et al., 2009; Gómez-Alonso et al., 2010; Prieto et al., 2010; Rogiers, 2011; Costa et al., 2012). Hence, besides the agronomical practices previously described the genetic variability in WUE observed in many species has to be taken into account before considering plant breeding and genetic engineering to improve leaf and whole plant WUE (Condon et al., 2004). In grapevines in particular, it has been demonstrated that there are significant differences in WUE among cultivars by direct measurements of AN/gs, ranging from 25 to 100 mmol CO2 mol-1 H2O in irrigated plants, and between 100 and 200 mmol CO2 mol-1 H2O under drought conditions (Flexas et al. 2010). Moreover, interesting variability has also been described in longer term measurements, δ13C, which values ranged between -31‰ and -27‰ under well-watered conditions and from -26‰ to -24.7‰ under waterstress. However, less data are available in WUEWP in grapevines described in only one study comparing 19 cultivars, where the values ranged between 2.5 and 3.2 g dry matter/ kg H2O transpired (Gibberd et al., 2001). This variability observed at 11.
(30) Chapter 1. different levels indicates that genotype selection could be an effective way to gain significant improvements in WUEl and WUEWP. 1.3.3.3. Potential physiological targets for plant breeding and biotechnology The physiological level is relevant to understand and improve leaf and whole plant WUE. Intrinsic water use efficiency (AN/gs) is a good basis to summarise the potential targets for genetic improvement of WUEl (Parry et al., 2005). Figure 1.3 represents two main ways to improve WUE on the basis of the relationship between stomatal conductance (water expenses) and photosynthesis (carbon gain) (Medrano et al., 2003). According to the curvilinear relationship between AN and gs, an increment in WUEi is usually accompanied by decreases in AN (Flexas et al., 2004). This situation is illustrated in figure 1.3 where a given genotype (G1) can move along the curve “A” decreasing gs and AN – for instance, under water stress – and increasing WUEi but, as an undesireable consequence, decreasing productivity (G1 to G2). However, a given genotype can also increase AN with different strategies, such as irrigation, maintaining or even increasing yield but decreasing WUEi (G1 to G3 in curve A). Clearly, an improvement in WUEi without modifications in productivity could only be achieved when genotype G1 is converted in genotype G4 with higher rates of AN for the same level of gs (Fig. 1.3) In that case, it could be possible to improve carbon balance without modifications in water losses. Therefore, genetic manipulation efforts should be directed to convert genotype G1 into G4.. 12.
(31) Introduction. Photosynthesis. Increasing photosynthesis Increasing water use efficiency. B G4. G3. A. G1 G2 Decreasing photosynthesis Increasing water use efficiency. *. Increasing photosynthesis Decreasing WUE. No increase in Stomatal conductance photosynthesis regardless of water use efficiency. Figure 1.3. The relationship between photosynthesis and stomatal conductance in plants. This figure illustrates how WUE could be improved maintaining or even increasing yield at a given value of gs. From Parry et al. (2005).. To increase leaf photosynthetic activity at any given gs seems to be the best option to improve WUEl. The genotypic modifications in AN-gs relationship to improve leaf photosynthetic activity and convert the situation G1 to G4 could be possible to achieve by different physiological mechanisms. These include improving carboxylation efficiency, and/or improving CO2 diffusion in the mesophyll increasing the CO2 concentration at the site of carboxylation inducing C4 photosynthetic metabolism in C3 plants (Long et al., 2006), or increasing the CO2 diffusion from sub-stomatal cavities to chloroplasts (i.e. mesophyll conductance – gm) (Flexas et al., 2008). Improvements in carboxylation efficiency could be achieved by increasing the Ribulose-1,5- bisphosphate carboxylase/oxygenase (Rubisco) catalytic rate (Parry et al., 2007) and/or specificity factor for CO2 (Galmés et al., 2005), reducing or bypassing photorespiration (Long et al., 2006,; Kebeish et al., 2007), increasing the capacity for RuBP regeneration (Feng et al., 2007; Peterhansel et al., 2008) or reducing the photoprotective state upon high-to-low light transitions (Long et al., 2006). Grapevine photosynthesis normally operates in the Rubiscolimited region, particularly under drought conditions when stomatal and mesophyll conductance (gs and gm) decrease and the CO2 availability in the chloroplast is reduced (Cc) (Flexas et al., 2002, 2006a). Therefore, increasing Rubisco specificity for CO2 (τ) could be more effective to improve WUE under 13.
(32) Chapter 1. Mediterranean conditions than increasing Rubisco concentration, catalytic coefficient or activation state. Rubisco specificity for CO2 (τ) has been determined in two grapevine cultivars, Tempranillo and Manto Negro, obtaining identical values for both cultivars (100 mol mol-1; Bota et al., 2002). Although, τ does not present substantial variability within C3 plants, higher values than those of grapevines have been found in other species such as the Mediterranean species Limonium gibertii (110.5 mol mol-1; Galmés et al., 2005), and the red algae Galdieria partita (240 mol mol-1; Uemura et al., 1997). These differences in τ have a clear genetic basis that could be used to improve the carboxylation efficiency, and as a result WUEl. Higher WUE has been found in C4 plants as compared to C3. The key trait of C4 photosynthesis is the compartmentalization of activities into two specialized cell and chloroplast types (Hatch, 1987). The C4 pathway reduces photorespiration by elevating the CO2 concentration at the site of Rubisco using a biochemical CO2 pump. C4 plants have two chloroplast types, each found in a specialized cell type, with different morphologies and functions (Kranz anatomy). Atmospheric CO2 is fixed in the mesophyll cells by phosphoenolpyruvate carboxylase (PEPC) to form the four-carbon dicarboxylic acid oxaloacetate (hence the name C4). Then, these C4 acids are diffused into the bundle sheath cells where they are decarboxylated in the chloroplasts. The CO2 produced is then refixed by Rubisco. In this way, CO2 is concentrated in chloroplasts of bundle sheath where Rubisco is located, thus reducing oxygenase activity of Rubisco (photorespiration). Another option to improve leaf photosynthetic activity is increasing the diffusion of CO2 from sub-stomatal cavities to the carboxylation site through leaf mesophyll (Flexas et al., 2008; Warren, 2008). The pathway of CO2 from the atmosphere to the sub-stomatal cavities is regulated by stomatal conductance (gs), which affects photosynthesis and transpiration. Then, the diffusion of CO2 from sub-stomatal cavities to the carboxylation site is regulated by the so-called mesophyll conductance (gm). Under water stressed conditions gs and gm decrease and, as a result, the CO2 available in the chloroplasts (Cc) decreases as well. Increasing gs increase water losses and decrease WUEl. However, increasing gm would increase Cc, and, hence, AN without any effect of plant water status and, consequently, it would increase WUEl displacing AN-gs relationship vertically (from G1 to G4, Fig. 1.3.). 14.
(33) Introduction. The transfer of C4 metabolism to C3 plants and the improvement of τ could be achieved by site-directed mutagenesis. In that way, chloroplast transformation has been possible in tobacco plants replacing the native large Rubisco subunit by other higher plants versions (Kanevski et al., 1999; Whitney & Andrews, 2001; Sharwood et al., 2008; Whitney et al., 2011). However, transformed plants presented low amount of Rubisco because of the lack of proper chaperons and other molecules needed for correct transcription, translation and assembling of the enzyme (Sharwood et al., 2008). This might suggest that genetic engineering in grapevines could be an unachievable goal. Therefore, increasing the diffusion of CO2 through the mesophyll needs to be explored, as has been suggested for several authors (Warren & Adams, 2006; Aranda et al., 2007). At the whole plant level, photosynthesis and respiration are the physiological processes that directly affect to carbon balance, and transpiration to water losses, making them good candidates to improve WUEWP. Photosynthesis could be improved by increasing total leaf area (Sharma-Natu & Ghildiyal, 2005; Long et al., 2006). Escalona et al. (2003) showed that leaves at the inner canopy layers in grapevines, which represent 35-40% of total leaf area, contribute less than 5% to total net carbon gain with a higher percentage of total water losses. This suggests that increasing photosynthesis by increasing total leaf area would only increase shaded leaves, thus reducing total WUE. Therefore, respiration and transpiration remain as important physiological processes to be considered for improving WUEWP. Substantial water losses that are not included in the opening of the stomata pores and daytime gs can affect WUEWP. Significant transport of water occurs through the cuticle and incomplete stomatal closure during night without any carbon gain (cuticular and night conductance). Therefore, reducing the night water losses by transpiration could be a way to improve WUEWP. In addition, respiration occurs continuously in all plant organs through the entire plant life. It implies that 30% to 90% of carbon fixed in photosynthesis is used for growth and maintenance respiration (Amthor, 2000). Hence, reducing the percentage of carbon lost in respiration could increase whole plant carbon gain. Mitochondrial respiration can proceed via the alternative oxidase pathway (AOP) and the cytochrome oxidase pathway (COP). A significant part of maintenance respiration is sustained by AOP (Flórez-Sarasa et al. 2007). Considering AOP as a futile pathway, a reduction in AOP respiration may resemble an opportunity to 15.
(34) Chapter 1. decrease overall respiration without significant consequences, improving carbon balance and WUE. Among all these potential targets to improve WUE, the present Thesis focuses on three of them: (1) mesophyll conductance to CO2, (2) cuticular and night conductance and (3) whole plant respiration.. 1.4. PROMISING PHYSIOLOGICAL PARAMETERS TO IMPROVE WATER USE EFFICIENCY As stated above, to improve WUE is an unavoidable goal for grapevine crop. Besides the agronomic methods, which could result in a more immediate reduction of water needs, there is a general consensus on the necessity to explore the capability to select grapevine cultivars with enhanced water use efficiency. The use of physiological parameters as putative selection criteria is of major interest for genetic improvement as well as for biotechnology approaches (Flexas et al., 2010) and, in that way, this work intends to explore the interest of mesophyll conductance, night transpiration and plant respiration for those purposes. In the present work, we evaluate the environmental and genetic induced variations on those parameters in order to offer a first assessment of their interest as surrogate parameters for WUE improvement.. 1.4.1. Mesophyll conductance to CO2 Photosynthesis depends on the diffusion of CO2 from the atmosphere surrounding the leaf to the sub-stomatal internal cavities through the stomata, and from there to the carboxylation site located inside the stroma through the leaf mesophyll. Mesophyll is a complex structure that varies greatly between species and growth conditions (Evans et al., 2009). The diffusion pathway of CO2 through the mesophyll tissue can be separated in 3 phases, gas (intercellular air spaces), liquid (cell walls, cytosol and chloroplast stroma) and lipid phase (plasma membrane and chloroplast envelope membranes) (Fig. 1.4).. 16.
(35) Introduction. Figure 1.4. (a) Light micrograph of the abaxial surface of an olive leaf, where the stomata can be seen (bottom side up), as well as the pathway of CO2 from ambient (Ca) through leaf surface (Cs) and intercellular air spaces (Ci) to the chloroplast (Cc). Boundary layer conductance (gb), stomatal conductance (gs) and mesophyll conductance (gm) are indicated. (b) Electron micrograph of a grapevine leaf where cell wall (cw), plasma membrane (pm), chloroplast envelope (ce) and stroma thylakoid (st) can be observed. The pathway of CO2 from Ci to chloroplastic CO2 (Cc) is characterized by intercellular air space conductance to CO2 (gias), through the liquid and lipid phase (gliq and glip) from intercellular airspaces to inside the cell. A grain of starch (s) and a plastoglobule (pg) can be also observed in the picture. From Flexas et al. (2008).. From first Fick law of diffusion, the net photosynthetic flux at steady state (AN) can be expressed as: AN = gs (Ca - Ci) = gm (Ci - Cc); where gs and gm are the stomatal and mesophyll conductance to CO2 diffusion, and Ca, Ci and Cc are the CO2 concentrations in the atmosphere, in the sub-stomatal internal cavity and in the chloroplast stroma, respectively (Long & Bernacchi, 2003). Then, decreases of CO2 diffusion through the leaf depend on stomatal closure and mesophyll conductance. In Gaastra’s (1959) pioneer work on leaf photosynthesis, mesophyll conductance was defined as a diffusion component of the photosynthesis pathway, and it was confirmed by later works showing that gm could be variable and could respond to environmental factors (Jones & Slatyer, 1972; Samsuddin & Impens, 1979). Thereafter, for decades, gas exchange studies assumed that Ci=Cc and therefore, gm was constant and infinite. However, evidences that Cc was lower than Ci were repeatedly demonstrated. There were several confirmations by comparing online carbon isotope discrimination studies (Evans et al., 1986), comparing the initial slope of AN- Ci curves with the activity of ribulose 1·5bisphosphate carboxylase/oxygenase (Rubisco) determined in vitro (Evans & Terashima, 1988) and by comparison of chlorophyll fluorescence with gas exchange measurements (Bongi & Loreto, 1989; Di Marco et al., 1990). In. 17.
(36) Chapter 1. summary, there is now convincing evidence that gm is finite and not constant, Cc is significantly less than Ci, and gm is a significant limitation to photosynthesis. Several methods to estimate gm have been developed, which principles and procedures are explained in detail by Warren (2006). Briefly, the used methods to determine gm include (1) online carbon isotope discrimination ( Evans et al., 1986; Sharkey et al., 1991; von Caemmerer & Evans, 1991; Loreto et al., 1992; Lloyd et al., 1992), (2) the “constant and variable J” fluorescence method (Di Marco et al., 1990; Harley et al., 1992; Epron et al., 1995), (4) “curve-fitting” (Ethier & Livinsgton, 2004; Sharkey et al., 2007) and (5) anatomical analysis (Nobel, 1991; Evans et al., 1994; Syversten et al., 1995; Tholen et al., 2011; Tosens et al., 2011). 1.4.1.1. Variability of gm among species and its response to environmental variables Mesophyll conductance (gm) is a limitation of AN of similar magnitude than gs (Evans & Loreto, 2000; Warren & Adams, 2006). Among species there is a positive relationship between AN and gm, but there is a wide variation in this relationship. For instance, for a given value of AN (10 µmol CO2 m-2 s-1), great variations of gm can be found (from 0.06 to 0.31 mol CO2 m-2 s-1). Data on gm are available in the literature for more than 100 species, varieties and forms. Mean maximum values of gm (i.e. in the absence of stress conditions) ranged from 0.4 mol CO2 m-2 s-1 to values very close to zero (Flexas et al., 2012; Niinemets et al., 2009a) (Fig. 1.5). The vast majority of gm estimates are made in Spermatophytes (angiosperms and gymnosperms) (Niinemets et al., 2009a), with very few data for liverworts and hornwort (Meyer et al., 2008), while there is no data available for groups such as mosses, lycophytes, equisetophytes and ferns (Flexas et al., 2012). In general, herbaceous annual and biannual plants present the largest mean values of gm (around 0.4 mol CO2 m-2 s-1) being the group that also present fast-growing strategies accompanied by high AN. Perennial herbs and woody deciduous and semi-deciduous angiosperms show medium values (around 0.2 mol CO2 m-2 s-1). Woody evergreen plants (angiosperms and gymnosperms) and succulent CAM plants present lower values (below 0.1 mol CO2 m-2 s-1). On the other hand, hornworts and liverworts present estimates of gm five orders of magnitude smaller than for Spermatophytes (on average, 2.5 · 10-5 mol CO2 m-2 s-1), distinguished for. 18.
(37) Introduction. lack of stomata and a low degree of cuticularization. Moreover, a large variability of gm also is present within groups, genus and species (Lauteri et al., 1997; Centritto et al., 2009; Barbour et al., 2010), suggesting that gm is likely to be involved in the differences of AN found among species and cultivars.. Figure 1.5. Average ± S.E. values for gs and gm in different pooled groups of plants. Data obtained from Meyer et al. (2008) and Niinemets et al. (2009). (From Flexas et al. 2012). It is known that gm is not only a constitutive property of leaf anatomy that differs between species. Mesophyll conductance (gm) can change significantly in response to environmental variables, external factors (abscisic acid, virus infection, etc.) and internal factors (leaf ageing and development), in short (minutes) and long term (days or weeks) (Warren, 2008; Flexas et al., 2008). Most gm studies are focus on the variability of gm in response to environmental factors, being mostly studied for water stress, salinity, temperature, CO2 concentration and light availability. Among them, gm can present long-term responses (acclimation) or in some cases rapid changes (within few minutes after applying the treatment), such as rapid leaf desiccation (cut petiole in air) or shortterm exposure to different temperatures, CO2 concentrations or light intensities. A large number of studies show how water stress and salinity reduce gm in a similar magnitude than gs (Scartazza et al., 1998; Delfine et al., 1999; Loreto et al., 2003; Flexas et al., 2004; Ripley et al., 2007; Galmés et al., 2011; Duan et al., 2011; Ferrio et al., 2012) with responses that range from several days to weeks or 19.
(38) Chapter 1. sometimes even in minutes in the case of leaf desiccation (Flexas et al., 2006b). On the other hand, temperature is also a source of variation of gm. In general, studies show that gm increases from 10 to 20ºC while at temperatures over 20ºC changes of gm differ among species with responses that can go from minutes (Warren & Dreyer, 2006; Scafaro et al., 2011) to months (Yamori et al., 2006; Díaz-Espejo et al., 2007). Regarding to carbon dioxide concentration around leaves more controversial results have been obtained. Long exposures to elevated CO2 concentrations (months to years) causes reductions of gm in some species (Singsaas et al., 2003) while in others it is unaffected (Eichelmann et al., 2004; Bernacchi et al., 2005). Furthermore, there is still no consensus about rapid changes in gm under short exposures to different CO2 concentrations. While, at decreased CO2 concentration around leaves gm increases (Centritto et al., 2003; Flexas et al., 2007a), at higher concentrations of CO2 gm decreases (Düring, 2003; Flexas et al., 2007a; Hassiotou et al., 2009; Vrabl et al., 2009; Tazoe et al., 2011; Douthe et al., 2011) or in other studies gm is maintained stable (Von Caemmerer & Evans, 1991; Loreto et al., 1992; Tazoe et al., 2009). Concerning light availability, in general gm responses are in the same direction as AN and gs, at higher light intensities, higher values of AN, gs and gm are obtained (Piel et al., 2002; Laisk et al., 2005; Warren et al., 2007; Bunce et al., 2010; Cano et al., 2011). Few studies have tested rapid responses of gm to irradiance, while in some studies gm increases with increasing light availability (Gorton et al., 2003; Flexas et al., 2007a), in others no relation between gm and measuring light intensity was observed (Tazoe et al., 2009; Yamori et al., 2011). As for internal factors, gm increases during leaf development up to the point of full leaf expansion, and then, gm declines as leaf ages and /or senescences (Miyazawa & Terashima, 2001; Niinemets et al., 2006; Flexas et al., 2007b; Whitehead D. et al., 2011). The causes of changes of gm with leaf age have been associated with changes in anatomical traits (Hanba et al., 2001). The results obtained from all gm studies present a large body of evidence to conclude that gm is not finite, and it acclimates and responds to different factors including environmental variables such as, water availability, temperature, light and CO2, that can be important in regulating AN, especially in Mediterranean areas where these environmental factors could be intensified according to climate change predictions. Despite other external and internal factors have been studied 20.
(39) Introduction. (i.e. low nitrogen availability, high O3, high altitude, leaf porosity, etc.) the environmental ones explained in this section are the most widely studied. 1.4.1.2. Mechanisms that determine gm Large variability of gm has been described among species, genotypes and for long-term and rapid responses to environmental factors. However, the mechanisms that regulate these changes remain unclear. The variability of maximum values of gm observed among species and genotypes involved in adaptative and acclimation responses have been associated to leaf structure and anatomical properties (Niinemets et al., 2009a; Terashima et al., 2011). Leaf dry mass per area (MA), the simplest indicator of leaf structure composed by leaf thickness and density, has been proposed as a limiting factor of maximum gm. It has been observed that gm increases with leaf thickness, while it is reduced with leaf density (Niinemets et al., 2009b; Poorter et al., 2009; Hassiotou et al., 2010). Hence, it has been shown that MA strongly limits gm in evergreen species (large MA) with lower photosynthetic rates due to large CO2 drawdown from sub-stomatal cavities (Ci) to chloroplasts (Cc) (Flexas et al., 2008). More specific leaf anatomical traits have been proposed as main determinants of the variability of gm among species (Evans et al., 2009; Terashima et al., 2011). The CO2 diffusion pathway consists of gas, liquid and lipid phase. The rate of diffusion through the composite segments of the diffusion pathway depends on the effective thickness and diffusivity of each anatomical component (Flexas et al., 2012). Gas phase is assumed to have smaller effect on diffusion limitations than the components of liquid and lipid phases (Evans et al., 2009). This was confirmed in several studies comparing CO2 diffusion in air and helox – air where helium replaces nitrogen to increase diffusivity – showing that liquid and lipid conductance (gliq and glip) are the most limiting gm components (Genty et al., 1998; Piel et al., 2002). Among the components of gliq and glip, cell walls and chloroplast membranes have been proposed as the most important factors affecting CO2 diffusion inside leaves (Terashima et al., 2011). Several reports have shown that the surface area of chloroplasts exposed to intercellular air spaces (Sc/S) correlates positively with gm (Evans et al., 1994; Evans & Loreto, 2000; Terashima et al., 2006; Tosens et al., 2011). In addition, differences in cell wall thickness (Tcw) have been shown to explain from 25% to 50% of the variability in 21.
(40) Chapter 1. gm (Evans et al., 2009; Terashima et al., 2011). Recent studies have presented negative correlations between gm and Tcw when comparing Australian Banksia species (Hassiotou et al., 2010), rice relatives (Scafaro et al., 2011) and Mediterranean Abies species (Peguero-Pina et al., 2012). Furthermore, Terashima et al. (2011) demonstrated, combining data from literature, a negative and highly significant relationship between the ratio gm/(Sc/S) and Tcw. Therefore, the variability of gm among species and even varieties could be related to differences in Tcw. In addition, other traits have been proposed to affect gm, including leaf porosity (Miyazawa & Terashima et al., 2001; Peña-Rojas et al., 2005), mesophyll surface area exposed to intercellular air spaces (Sm/S)(Evans & Loreto, 2000) and chloroplast arrangements (Tholen et al., 2008) although not proven in all cases (Kogami et al., 2001; Gorton et al., 2003; Hanba et al., 2004). While anatomical traits correlate well with gm, the latter can change more rapidly than leaf anatomy and morphology. The temperature dependency of gm shows a Q10 of 2.2, suggesting that there must be an enzymatic or proteinfacilitator mechanism for the diffusion control of gm (Bernacchi et al. 2002). The most likely candidates proposed for the most dynamic gm changes have been carbonic anhydrase and aquaporins, involved in membrane permeabilities and consequently in gliq and glip variations. Carbonic anhydrases catalyse the dilution of CO2 in liquid phase, being it converted in HCO3-. Three different classes of carbonic anhydrases have been described in plants (α, β, γ) located in the plasma membrane, cytosol and chloroplasts, being β class the most abundant form (Fabre et al., 2007). Several studies performed with modifications of carbonic anhydrase in transgenic plants shown little evidence of the involvement of the most abundant forms in gm and AN (Price et al., 1994; Williams et al., 1996). However, Gillon & Yakir (2000) showed that the contribution of carbonic anhydrase to gm is species dependent and it may become more important when gm is low as in sclerophyllous species. Aquaporins are membrane intrinsic proteins that facilitate the movement of water, CO2 and other small neutral solutes across cellular membranes. Aquaporins can be divided into five different subfamilies, which to some extent reflect distinct subcellular localizations: the Plasma Membrane Intrinsic Proteins (PIPs), Tonoplast Intrinsic Proteins (TIPs), Nodulin-like Intrinsic Proteins (NIPs), the Small Intrinsic Proteins (SIPs) and X intrinsic proteins (XIPS) (Chamount et 22.
(41) Introduction. al., 2001; Johanson et al., 2001; Sakurai et al., 2005; Danielson & Johanson, 2008). The first evidence of the possible role of aquaporins in the diffusion of CO2 was provided by Terashima and Ono (2002), showing that HgCl2, a nonspecific inhibitor of aquaporins, reduced gm. Later, it was confirmed by Uehlein et al. (2003), who demonstrated that tobacco aquaporin NtAQP1 facilitates transmembrane CO2 transport by expression in Xenopus oocytes. Subsequent studies with transgenic plants, rice, tobacco and Arabidopsis thaliana have reported the role of some specific aquaporins (HvPIP2,1; NtAQP1 and AtPIP1,2 respectively) in the regulation of gm (Hanba et al., 2004; Flexas et al., 2006c; Heckwolf et al. 2011). In addition, Uehlein et al. (2008) showed that NtAQP1 is also located in the inner chloroplast membranes and it considerably affects leaf CO2 transport. On the other hand, Miyazawa et al. (2008) studied the role of aquaporins in gm under drought conditions in tobacco plants, however, the variations in gm were not clearly explained by the total plasma membrane aquaporin (all PIP). Although the regulation of aquaporin activity in the short term is not fully understood, several mechanisms have been proposed, including direct phosphorylation of aquaporins (Kjellbom et al., 1999), an osmotically driven cohesion/tension mechanism (Ye et al., 2004), pH-dependent gating of aquaporins (Tournaire-Roux et al., 2003) and transcriptional regulation and protein stability (Eckert et al., 1999). 1.4.1.3. Mesophyll conductance (gm) in grapevines Studies about gm in grapevines are relatively scarce. Patakas et al. (2003) described that gm in grapevines could have a genetic basis. In this study, important differences in leaf anatomy traits among three different cultivars affecting internal CO2 gas phase conductance (gias) were described, although gm was not determined. Regarding to changes of gm in response to environmental conditions, Flexas et al. (2002) showed that gm is progressively reduced under drought in the long term, under field conditions; and Düring et al. (2003) showed that gm declined at high CO2 supply in field-grown Riesling vines. Afterwards, several studies in grapevines confirmed that gm decreases under increasing drought conditions (Moutinho-Pereira et al., 2004; Ferrio et al., 2012), being restored after rewatering (Flexas et al., 2009; Pou et al., 2012). In addition, Pérez-Martin et al. (2009) studied the interaction of soil water deficit and VPD on gm, where drought dominated the response of gs and gm.. 23.
Figure


+7


Documento similar
The main idea behind it is that there are two almost independent transport channels: (i) Direct excitonic transport through hopping between the molecules, which dominates in
midday leaf water potential (A) and midday stomatal conductance vs midday stem water potential (B) in response to different irrigation regimes in 3 year-old pear trees planted
The exact expression for the phase-dependent linear conductance of a weakly damped superconducting quantum point contact is obtained.. The calculation is performed by summing up
In this Letter, we demonstrate that the quantum degeneracy of frontier electronic states of two interacting bodies forming an atomic point contact can be explored by precise
It has previously been shown that the STM-BJ method favors the formation of high conductance molecular junctions, and this has been interpreted in terms of the contact atoms binding
We then further divided the traces into two more groups for those with plateaus above or below log(G/G 0 ) = −3.8. Dividing the traces using a value slightly above or below this
Spatial mapping of the zero-bias conductance in magnetic field reveals the vortex lattice, which allows us to unequivocally link the observed conductance gap to superconductivity
tip, leaving the other weakly bonded or freely suspended. This implies that the binding to the tip is relatively constant from one curve to another, so that
