European Journal of Government and Economics
ISSN: 2254-7088
Why regions fail (or succeed). The Role of Government Institutions in
the Long-Run
Filippo Bonannoa*
a Universidad Complutense de Madrid, Spain
* Corresponding author at: [email protected]
Article history. Received 21 January 2019; first revision required 1 August 2019; accepted 29 September 2019.
Abstract. This paper represents an attempt to reconcile some general intuitions provided by Daron Acemoglu and James A. Robinson in the book “Why Nations Fail” with the case of the deep regional disparities in the economic performances observed within the “Western” European Union during the period 2001-2015. By adopting an approach to growth analysis based on binary response models, this paper quantifies the extent to which the quality of government institutions has shaped regional economic performances in the European Union throughout the period comprising the Great Recession. Empirical results show that: 1) The higher is the quality of institutions, the higher is the probability that a region with high income per capita will grow above the levels of the European Union as a whole. 2) The higher is the quality of institutions, the lower is the probability that a low-income region will grow below the levels of European Union as a whole. 3) The higher is the quality of institutions, the higher (lower) is the probability that any region, regardless of its income per capita, will outperform (underperform) the European Union as a whole. 4) The higher is the quality of Institutions, the lower is the probability that a region will “fail” to grow.
Keywords. Quality of Institutions; Probit; Regions; European Union, Economic Performances
JEL Codes. H1; N4; R1; C10
DOI. https://doi.org/10.17979/ejge.2019.8.2.4989
1. Introduction
The period 2001-2015 was characterized by very poor regional economic performances in the old Member states European Union (EU-15)1. However, despite the financial crisis and
economic downturn that affected the European countries and in particular in the Euro area, some regions performed much better than others while a group of 44 regions recorded negative rates of average economic growth. The worst economic performances were generally observed in the Italian and Greek regions that are also the region with the poorest quality of government institutions.
The objective of this essay is to analyse the role of the quality of government in shaping regional performances and intends to contribute to the existing literature about the relationship between economic growth and institutions by adopting an ex-post approach for the analysis of
1 By EU-15 it is meant the group of countries from Western Europe that have progressively joined the
economic growth. Regions will be grouped according to their economic performances compared to the performance of the whole European Union over the period 2001-2015 and four binary dependent variables will be constructed. These binary dependent variables in the dataset will take on value 1 if one of the four performances is observed or 0 otherwise. Next, a Probit model will be estimated for each of the four cases in order to explain to what extent institutional quality has shaped regional economic performances during the period under analysis.
The empirical findings are remarkably interesting. Both the educational attainment of the working-age population and the industrial sector generally play a positive role in shaping regional performances. However, in the long run, the quality of institutions turns out to be always the ultimate determinant of the increase/decrease in the probability that a region will be recording a positive or negative economic performance.
2. Literature Review
Neoclassical Growth Model and its empirical extensions for growth analysis have traditionally focused on exogenous factors such as saving rate, population growth and technological progress (Solow, 1956). Within the stream of the neoclassical approach, Mankiw et al. (1991) have also remarked the relevant role played by human capital in the transitional dynamics to the steady state output per worker. Other streams of theoretical and empirical literature about economic growth have focused on human capital and endogenous technological change arguing that innovation is the engine of economic growth and it is endogenously generated (Romer, 1986; Lucas, 1988). The consequence of the fact that human capital accumulation is not subjected to decreasing returns as physical capital can explain the discontinuity or the slow speeds of convergence often observed within groups of regions or countries (Martin and Sunley, 1998).
By including variables that can broadly be considered as proxies for institutional quality in a cross-section of 98 countries, Barro (1991) finds out that economic growth is positively related to measures of political stability and negative related to the market distortions induced in the economy by the political sphere. Also in a panel of around 100 countries with data collected from 1960 to 1990, Barro (1996) finds out that for a given level of initial GDP per Capita, the growth rate is enhanced among others also by better maintenance of the rule of law.
Acemoglu and Robinson (2012) argue that rich countries are rich because they have
inclusive institutions, while poor countries are poor because they have extractive institutions. By “institutions” also the authors mentioned above mean the rules that govern and organize the economic and political life. Inclusive institutions create the fundamental incentives and opportunities that stimulate investment and entrepreneurship, while extractive economic institutions consist of a system where a small group of people is permitted to exploit the rest of the population that is kept out the political and economic process. However, throughout history, most of the societies have been ruled by extractive economic institutions with different levels of intensity 2.
Acemoglu et al. (2001) individuate the origins of the economic backwardness of former Western colonies in Asia, Africa and Latin America in the fact that colonial powers set up
extractive state structures in those territories. Those institutions did not introduce much
protection for private property, nor did they provide checks and balances against the government because the explicit aim of the Europeans settled in those overseas territories was the sole extraction of resources. This colonization strategy and the associated institutions contrast with the institutions Europeans set up in other colonies where they settled in large numbers, for example, the United States, Canada, Australia, and New Zealand (Acemoglou and Robinson, 2008:4).
At the same time, the quality of institutions also affected the economic development of the colonial powers themselves. Achemoglu et al. (2002) argue that the discovery of America in 1492 benefited much more, in terms of economic development, the countries that had already established a systems of checks and balance to the Monarchy, as Great Britain and the Netherlands, rather than countries where the monarchy was highly absolutist, as in the case of Spain or Portugal.
The institutionalist explanation of disparities in economic development has been well received in academic circles and in the sphere of international organisations (Alonso, 2009:12). As a matter of facts, it has progressively arisen an increasing recognition among practitioners in international organizations that corruption and other aspects of poor governance have substantial and adverse effects on economic development (Mauro, 2002). Mauro (1995) also finds out a negative relationship between the malfunctioning of institutions and investment rate, therefore between institutional inefficiency (and corruption) and economic growth.
Somewhat contrary to the capital accumulation model of regional growth, institutional theorists argue that differences in growth and prosperity across countries, regions and cities are strictly related to the quality of political and economic institutions that shape the economic activity (Huggins and Thompson, 2017).
2 In relation to “extractive” economic institutions in the ancient history, prominent historian MacMullen
By estimating the contribution to income levels of different forces like geography and trade in a large sample of countries, also Rodrik et al. (2002) find out that the quality of institutions is the main determinant of income levels. Roughly said, after controlling for institutional quality, in the output of the regression model measures of geography and trade result at best to exert weak effects on income levels while the institutional quality remains the main determinant of economic development.
Turning to the more focused topic of regional performances in Europe, a wide body of literature has been produced to study the relationship between economic growth and the quality of institutions. However, most of these studies use “quality of institutions” as a predictor of economic growth with a “neoclassical approach” where economic growth is regressed on the natural logarithm of initial levels of GDP per capita and other control variables, including quality of institutions or regional geographic spillover (Ascani et al., 2012; Harris, 2008; Feldkircher, 2006; Rodríguez-Pose, 1998; Pons-Novell and Viladecans-Marsal, 1998). Other empirical studies assess the impact of the quality of institutions on innovative capacity and investment in European regions or countries (Rodriguez -Pose and Di Cataldo, 2018; Canton and Solera, 2016).
This essay contributes to the existing literature by modelling the relationship between regional economic performances and the quality of institutions with an econometric approach based on binary response models. These models attempt to estimate the marginal probability that a certain economic performance will be attained in a region, conditional on the quality of institutions and other control variables commonly used in the analysis of economic growth.
3. Data and empirical strategy
The annual data are averaged from 2001 to 2015 for each of the 195 sampling units and the dataset includes 14 NUTS-1 territories (Belgium: Brussels; Germany: Berlin, Brandenburg, Bremen, Hamburg, Mecklenburg-Vorpommern, Saarland, Sachsen-Anhalt, Schleswig-Holstein and Turingen; France: Ile-de-France and Nord-Pas-de-Calais; Greece: Attica; Spain: Community of Madrid; United Kingdom: Northern Ireland), 1 NUTS-0 territory (Luxembourg) and 180 NUTS-2 regions3 located in EU-15 countries4. The sample is composed only by the regions
of Western Europe where the heterogeneity in terms of initial conditions is smaller (despite the remarkable cross country differences) than the cross regional heterogeneity observed in the post-enlargement European Union. Therefore, regions of transition economies from Eastern Europe are not included in the sample because they outperformed the average rate of growth of the European Union despite their very low institutional quality and this is mainly due to the fact
3 Nuts 0 territories of Cyprus and Malta are excluded from the sample together with the 7 Nuts-2
Territories of Norway because of the lack of the availability of data concerning Quality of Institutions and because Norway is not a member state of the Union.
4 Here, by EU-15 group it is meant all the Western member states of the European Union excluding
that they started with very low levels of income per capita their process of transition and economic integration with the Western countries of the European Union.
Data related to GDP per Capita and investment rates are sourced from Cambridge Econometrics European Regional Database.
The data concerning the educational attainment of the population are sourced from the regional database made available online from the European Commission.
Data related to the quality of regional governments consist of the EQI Score developed by Charron at al (2015) from The Quality of Government Institute of the University of Gothenburg and made available in the European Quality of Government Index (EQoG) database downloadable from the website of the Swedish academic institution. EQoG database is relatively new, and the indicators have been developed only for the years 2010, 2013 and 2017.
Given the fact that the “success” or the “failure” of institutions reflects a wide range of historical, local, sociological and anthropological factors (Alesina, 2014; Greif, 1994), it is possible to suppose that changes and adjustments in the quality of institutions occur very slowly. Also, Acemoglu and Robinson (2012:435) argue that replacing extractive institutions with inclusive institutions is neither an automatic nor a simple process. Indeed, it is often needed a convergence of historical or political factors, in particular, a critical conjuncture combined with a broad coalition of people that support and push for the reforms.
As a consequence, for the purpose of this analysis, the choice of “EQI Score” of the year 2013 as a predictor of economic performances over the period 2001-2015 represents a very reasonable strategy to remedy the fact that the selected time series data for institutional quality are not available on an annual basis from 2001 to 2015.
The estimation methodology applied in this essay partially follows the methodology developed by Ainginger et al. (2013).
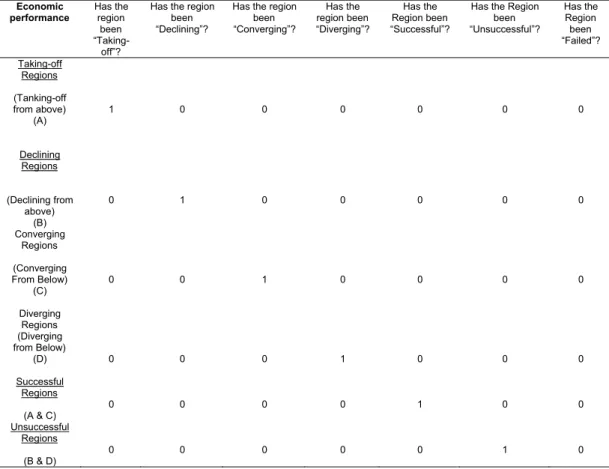
Regions are assigned to 4 groups according to their economic performances over the period 2001-2015 and their initial income per capita levels:
1. Group A (Taking off from Above): Regions with GDP per Capita above EU GDP per Capita level in 2001 growing faster than the EU average over the period 2001 – 2015.
2. Group B (Declining from above): Regions with GDP per Capita above EU GDP per Capita level in 2001 growing below the EU average over the period 2001 – 2015 3. Group C (Converging from below): Regions with GDP per Capita below EU GDP per
Capita level in 2001 growing above the EU average over the period 2001 – 2015 4. Group D (Diverging from below): Regions with GDP per Capita below EU GDP per
Capita level in 2001 growing below the EU average over the period 2001 – 2015
The methodology developed in order to construct the binary dependent variables is explained in Table 1.
Table 1. Methodology of construction of binary dependent variables.
Economic
performance Has the region been the probability that a region will be “Taking-off” (Diverging) with respect to European Union as a whole given its GDP per Capita in 2001. Then it will be possible to estimate both the conditional probabilities that a region will be “Successful” (or Unsuccessful) at performing better than the European Union as a whole in terms of economic growth and the conditional probabilities that a region will “fail” (negative growth) regardless of its GDP per capita levels in 2001.
3.1. Some Stylized facts about regional economic performances in the European Union
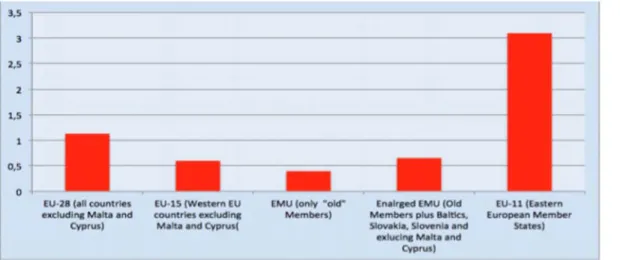
Figure 1. Average annual regional GDP per capita growth by groups of countries (2001-2015)
As it possible to notice from Figure 1, regional economic growth in the European Union was essentially driven by the “converging” economies of Eastern Europe. Indeed, EU-15 regional average economic growth was nearly the half of the economic growth observed in the EU-28 over the period 2001-2015.
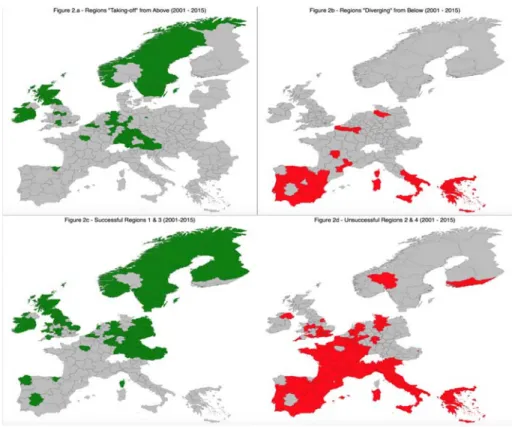
Figure 2 shows the statistical maps of regional performances A, B, A&C and B&D as formalized through the methodology developed in Table 1. As it is possible to note in Figure 2, most of regions with GDP per capita lower than the European Union GDP per capita in 2001 that underperformed the European Union (diverging regions) are located in Southern Europe while the regions that outperformed the European Union “from above” are mainly located in Central and Northern Europe (South-East and North Germany, most of Austrian regions, Scotland, North of England and Ile-de-France). Basque Country is the only Southern European region that has been “taking-off from above”.
At the same time, most of the regions that have been “diverging from below” are located in Spain, Portugal, Italian “Mezzogiorno” while most of the regions that have been “unsuccessful”
Figure 2. Maps of regional performances.
3.2. Quality of Institutions in the European regions. A Graphical Overview
The European Quality of Government Index (EQI) for the year 2013 has been developed by the
Quality of Government Institute of the University of Gothenburg, and it is the result of a regional
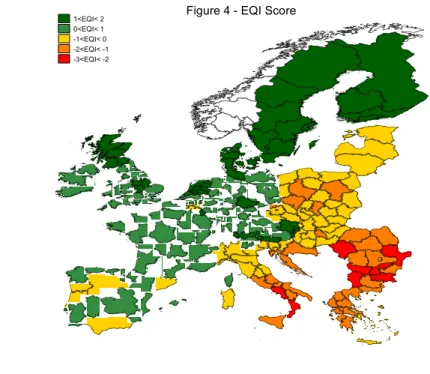
survey answered by a large sample of 85.000 citizen respondents5. The data focus “on both perception and experiences with public sector corruption along with the extent to which citizens believe various public sector services are impartially allocated and of good quality”. Figure 4
shows the statistical maps of the regional EQI score as calculated for each region of the European Union (when the index it is not available at NUTS-2 level, the NUTS-2 region will take on the score of its upper-level territorial unit NUTS-1).
As Figure 4 shows, EQI score tends to be generally very high or high in Northern and Central Europe (Scandinavian, German, Austrian and British regions), in France and the majority of regions of the Iberian Peninsula. At the same time, the wealthiest regions of Northern Italy like Lombardy have the approximately the same EQI score of the Madrid Community and of Catalonia while all the regions of Mezzogiorno have the same EQI score of
the most of the Greek regions. The only Italian region with a “northern European” EQI score is the NUTS2 region ITH1 (Trentino-Alto Adige/Südtirol). The regions with the lowest EQI in the Western countries of the European Union are Campania and Calabria that are also two of the poorest regions of Italy and among the poorest regions in the EU-15. The extent to which the Quality of Institutions affects regional economic performances can be easily shown by plotting the marginal effects of the EQI score on the predicted probability that a region will be “taking off from above” or “diverging from below”.
5 A more detailed definition of the EQI score is provided in Appendix 1. 1<EQI< 2
0<EQI< 1 -1<EQI< 0 -2<EQI< -1 -3<EQI< -2
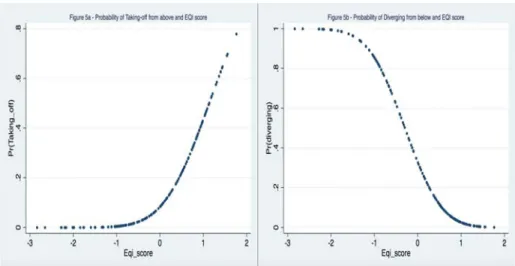
Figure 5. Probability of “taking-off” from above and “diverging” from below.
As it is possible to note in Figure 5a, the higher is the EQI score, the higher is the probability that a region will be “Taking-off” from above. At the same time, the higher is the EQI score, the lower is the marginal probability that a region will be “diverging” from below (Figure 5b). Said more technically, as the Quality of Institutions tends to the maximum score, the predicted probability for a region to be “Taking off” approaches 1, while the predicted probability for a region to be “Diverging from below” approaches 0.
4. The Specification of the Model: Institutions in the Long-run
Probit regression is nonlinear regression model specifically utilized for binary dependent variables. A model with binary dependent variable models the probability that Y=1 when a change in the predictor X occurs. Cumulative probability distribution function (c.d.f.) is used in
Probit regressions because it produces probabilities between 0 and 1 in the form (Y=1|X). Therefore, when Y is binary, its conditional expectation is the marginal probability that the variable Y equals 1, and the expected change arising from a change in X is the change in the probability that Y=1 (Stock and Watson, 2012:431). For the Probit model F(x´β) is the cumulative density function (C.d.f) of a standard normal distribution
𝑌 𝐹 𝑋`𝛽 ` 𝛷 𝑧 𝑑𝑧 𝑤𝑖𝑡ℎ 𝛷 𝑧 ∈ 0,1 [1]
Therefore, coefficient estimate β represents the increase/decrease in the z-score of the probability Y=1|X when X changes by 1 unit. The model is specified as follows:
Pr 𝑌 1|𝑋`𝑠 𝛷 𝛼 𝛽 𝑋, 𝛽 𝑋, 𝛽 𝑋 ,, [2]
certain economic performance (“diverging”, “converging”, “unsuccessful”/“successful” or “failed”) and 0 otherwise. X1 denotes the EQI score calculated in 2013, X2 denotes a vector of control
variables related to sectorial investment rates to GDP or the regional economic structure while X 3 denotes the vector of control variables related to the educational attainment of the
working-age population. All the variables other than EQI score are expressed as annual averworking-ages during the period 2001-2015.
The model will be estimated for four cases:
Regions “taking-off” from above, regions “diverging” from below, unsuccessful regions (GDP per capita growth<EU GDP per capita growth), or symmetrically, successful regions (GDP per capita growth > EU GDP per capita growth)6 failed regions (GDP per capita growth < 0).
Higher EQI score is expected to increase the probability that a region will be “taking off from above” or be “Successful” while it is expected to reduce the probability that a region will be “Diverging from below” or be “Unsuccessful”. Investment rates to GDP are expected to affect the binary variable according to the sector of the economy (Industry, Market services, Non-Market services, Agriculture and Constructions) while labour force higher education is expected to confirm the results common to the empirical literature about economic growth.
In the tables of the regression outputs, I report directly the marginal effects or the predicted probability that Y=1 given the values of X1 , X2 …, Xk calculated by computing the z-value.
Indeed, the coefficient β1 is the change in z-value arising from a unit change in X1, holding
constant X2 …, X. The Probit model is fitted with Maximum Likelihood estimator and also
provides a Pseudo R Square7, 8. In order to provide a more in-depth analysis, I also run the
same models with variables averaged during the period 2001-2008. With this strategy, it is possible both to exclude the crisis period characterized by a general drop in regional economic activity and to compare the role of institutions in the short run and the long run9.
6 The coefficient estimates and their statistical significance of the models with “Successful” or
“Unsuccessful” regions are exactly the same with opposite signs. Therefore, in the paper only the regression output for “Unsuccessful” regions (regions “declining from above” and “diverging from below”) is reported
7 In Table 13 of Appendix 2, I will report the regression diagnostic for the detection of the eventual
presence of multicollinearity in the model. As it will be shown, no multicollinearity is detected between the variables in the model.
8 Figures 10 and 11 in Appendix 3 show the plots of the marginal probabilities estimated with the Probit
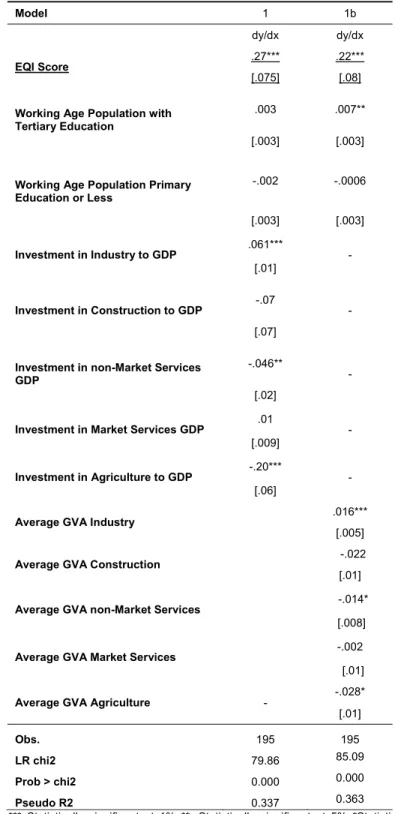
Table 2. Marginal effects on probability Y=1|X. Group A.
Investment in Agriculture to GDP -.20*** -
[.06]
Average GVA Industry .016***
[.005]
Average GVA Construction -.022
[.01]
Average GVA non-Market Services -.014*
[.008]
Average GVA Market Services -.002
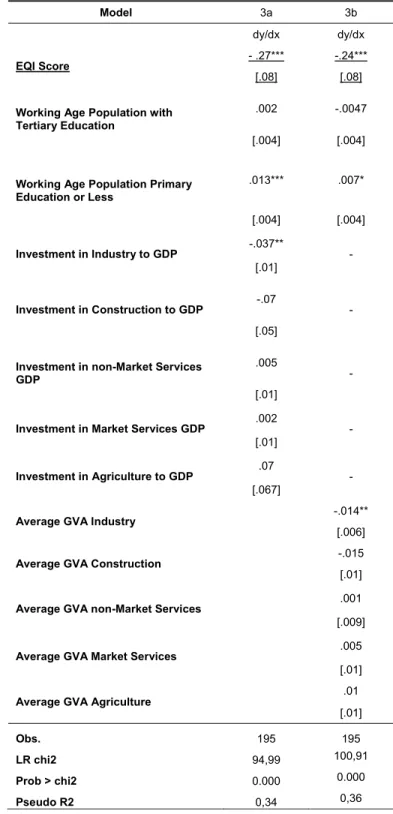
Table 3. Marginal effects on probability Y=1|X. Group D.
Average GVA non-Market Services .026***
Table 4. Marginal effects on probability Y=1|X. Group B + Group D.
Average GVA non-Market Services .001
Table 5. Marginal effects on probability Y=1|X. Group E.
Investment in Market Services GDP .005
5. Robustness check of the model: Institutions in the short-run
In order to further investigate the role of the quality of institutions in shaping regional economic performances in the EU-15, I run the same model with annual data averaged during the period 2001-2008. With this strategy, it will be possible to insulate the pre-crisis period and compare the long run and short run results of the econometric analyses in order to assess to what extent the quality of government institutions makes European regions more resilient to economic shocks. As already mentioned the data for European Quality of Government Index (EQI score) developed by the Quality of Government Institute are available only for the years 2010, 2013
and 2017. Given the fact that changes in the quality of institutions occur very slowly it is plausible to suppose that the quality of government institutions observed in 2010 in the European regions was not sensibly different from the quality of government institutions that had characterised the period 2001-2008. As a consequence, the EQI score of the year 2010 calculated on a survey of 34.000 respondents is chosen as a predictor of regions economic performance.
Also, the Quality of Government Institute remarks that “a relative stability in quality of government can be noted across the three editions” of the database and such stability further induces to confidently conjecture that quality of government institutions in 2010 was nearly the same of the quality of regional institutions of the previous years. The relationship between the quality of government institutions and economic performances in the short run is expected at best weak or negligible. Indeed, countries or regions can experience short run fast economic growth, convergence or growth accelerations regardless the quality of government institutions and as a consequence of episodes of speculation on real estate, stock market and commodity prices that drive economic growth until the bubble bursts and the subsequent macroeconomic adjustment. Furthermore, during the periods of financial euphoria or financial/housing bubbles regions or countries with lower income levels can experience short-run periods of fast economic growth and convergence because of high debt-driven investment rates and decreasing returns to physical capital. Anyways, stable economic development is ensured in the long run only by sound government institutions as pointed out by Acemoglu and Robinson (2005).
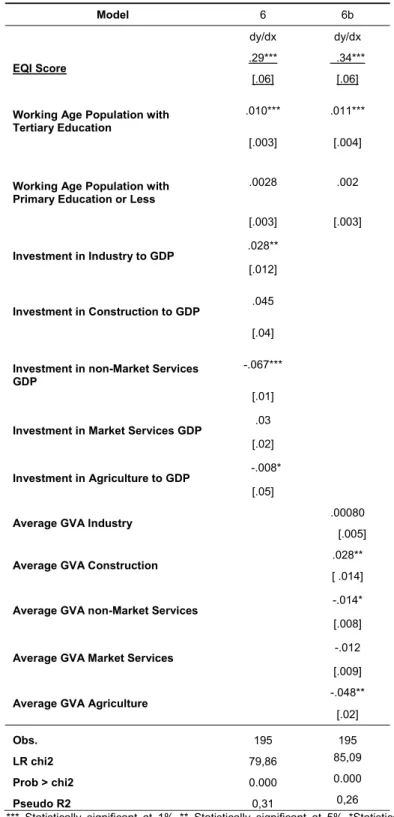
Table 6. Marginal effects on probability Y=1|X. Group A – robustness check.
Investment in Industry to GDP .028**
[.012]
Investment in Market Services GDP .03
[.02]
Average GVA non-Market Services -.014*
Table 7. Marginal effects on probability Y=1|X. Group B – robustness check.
Investment in Industry to GDP .001
Table 8. Marginal effects on probability Y=1|X. Group B + Group D – robustness check.
Average GVA non-Market Services -.011
[.009]
Average GVA Market Services -.021**
[.009]
Average GVA Agriculture -.039**
Table 9. Marginal effects on probability Y=1|X. Group E – robustness check.
Model 9 9b
EQI Score .0008 .008
[.01] [.01]
Working Age Population with Tertiary Education
-.001 -.001 [.001] [.001]
Working Age Population Primary Education or Less
-.0005 -.00005
[.0007] [.0009]
Investment in Industry to GDP -.002 -.002
[.005] [.002]
Investment in Construction to GDP -.003
[.01]
Investment in non-Market Services GDP
.001 [.004]
Investment in Market Services GDP .010
[.006]
Investment in Agriculture to GDP -.016
[.02]
Average GVA Industry -.002
[.002]
Average GVA Construction .003
[.004]
Average GVA non-Market Services -.003
[.003]
Average GVA Market Services .0001
[.001]
Average GVA Agriculture -.005
[.008]
Obs. 195 195
LR chi2 18,27 12,26
Prob > chi2 0.000 0.000
Pseudo R2 0,54 0,41
6. Discussion
Despite the results of the model perfectly fit the expectations derived from the theory and the previous empirics in the literature, it is surprising to empirically demonstrate how the quality of institution turns out to be the most important determinant of regional performances even compared to investment rate in highly productive sectors as the manufacturing industry. In particular, when controlling for sectorial investment rates to GDP, a percentage point increase in EQI score is expected to determine an increase of 27% in the probability that a region will be “taking off from above” (Table 2 Model 1a) while it is expected to reduce by 15% the probability that a region will be “diverging” from below (table 3, Model 1a).
The results of the model reported in Table 4 (Model 1a) also tells that a one-unit increase in the EQI score will reduce by 27% the probability that a region will be “unsuccessful” either “declining from above” or “diverging from below”. Symmetrically, a one-unit increase in the EQI score will increase by 27% the probability that a region will be successful either in “taking off from above” or “converging” from below.
Beside the quality institutions, the role investment in manufacturing industry to GDP seems to be very relevant for increasing the probability that a region will be “taking off from above”, as reported in Table 2, and reducing the probability that a region will be “diverging from below” or being “unsuccessful” (Table 3 and Table 4).
As regards the “failed” regions (table 5), the industrial sector size plays a marginal role while the EQI score is the main determinant of regional performances because a one-unit increase in the EQI score is expected to reduce by 19% the probability that a region will "fail” to grow.
Human capital proxied as the educational attainment of the working-age population generally plays an effect in shaping regional performances, in particular the labour force with primary education or less is expected to increase the probability that a region will be “diverging from below” or “unsuccessful” while the labour force with tertiary education is expected to reduce the probability that a region will fail to grow.
7. Conclusions
economic performances. The results of the model clearly confirm the thesis of Acemoglu and Robinson (2012) about to the tight relation between quality of institution and failures of nations, or regions in our case. As shown in the statistical map (Figure 4), most of the regions with very low indices of the Quality of Government Institutions are the regions of Southern Europe, in particular, the Italian and the Greek ones. Those regions were also the ones that suffered more from the financial crisis and sovereign debt crisis (they have been regions “diverging from below”) while most of the Northern Italian regions with income higher than EU income levels in 2001 have been “declining” from above or unsuccessful.
According to the estimations, a one-unit increase in EQI score is expected to increase by 27% the probability that a region will be “taking off from above” (Table 2, model 1a), while it will reduce by 12.5% the probability that a region will be “diverging from below” (Table 3, Model 2a). Finally, a one-unit increase in the EQI score is expected to reduce by 27% the probability that a region will be “unsuccessful” either by “diverging from below” or “declining from above” (Table 4, Model 3a)10.
The empirical finding of this paper are very relevant for governments in diverging or declining regions of the European Union, mainly in the peripheral countries of the EMU. Indeed, the results show how the Quality of Institutions ends up to be the most relevant determinant of regional economic performances. In particular, the regression output for “diverging from below” regions (Table 3) clearly shows that for regions, whose per capita income is lower than the per capita income of the European Union as a whole, the quality of institutions is much more important than other variables such as the investment rate in manufacturing sector or it size.
Indeed, according to the coefficient estimates reported in Table 3 (Model 2a), a one-unit increase in the EQI score is expected to reduce by 12.5% the probability that a region will be “diverging from below” while the coefficient estimates investment rate in industry or the size of the industrial sector are not statistically significant.
Quality of Government Institutions exerts a huge impact on the probability that a region will be “unsuccessful” by either “diverging from below” or declining from above”. According the regression output reported in table 4 (model 3a), while a 1% increase in investment rate in industry is expected to reduce by 3.7% the probability that a region will be “unsuccessful”, a one-unit increase in the EQI score is expected to reduce by 27% (more than one quarter) the probability that a region will be “unsuccessful” either by “declining from above” (as in the case of all the Northern and Central Italian regions) or “diverging from below” as in the case of the Greek regions.
Last but not least, according to the estimations reported in Table 5, one unit increase in the EQI index is expected to reduce by 19% (Model 4a) or 18% (Model 4b) the probability that a region will fail to grow. During the period under analysis 20 Italian regions out of 21 and 10 Greek regions out of 13 recorded negative average GDP per capita growth, meaning that over the same period, 31 regions out of 44 European Regions that recorded negative economic
10 Symmetrically a one-unit increase in EQI score is expected to increase by 27% the probability that a
growth were Greek or Italian. The two countries are also the countries with the lowest quality of regional institutions in terms of EQI score. Given these further considerations and the empirical evidence provided by the econometric estimations, it is straightforward to conclude that the quality of institutions is the main determinant of regional economic performances in the long run. As a consequence, it is possible to assert that the poor quality of institutions has hampered both the resilience of Northern Italian regions to the financial crisis and their ability to “take-off from above” as in the case of the most industrialized regions located in Germany. At the same time, the poor quality of government institutions has remarkably contributed to the process of “divergence from below” observed in the Greek and Southern Italian regions. As empirically estimated and reported in Table 3, the quality of government institutions is much more relevant than the investment rate in the manufacturing industry for lower-income regions to avoid further divergence from the EU income levels.
Furthermore, by comparing the results estimated for the same model in the long run and in the short run, it is also possible to assert that the soundness of government institutions makes regions more resilient to financial crises or macroeconomic shocks. As a matter of facts, Greek regions, that recorded high rates of economic growth before the financial crisis, have recorded the worst economic performances in Europe over the period 2001-2015 together with the Italian regions.
According to Rothstein and Uslaner (2005), the quality of government institutions mainly reflects the social trust that characterizes a local community, and many empirical studies show
that higher degrees of social trust are generally associated with higher levels of quality of government institutions.
Lack of social trust within a community means that citizens have faith only in their family,
clan or social group and this makes them less eager to contribute to the provision of general public goods, such as paying taxes, respecting and protecting public spaces and, very importantly, engaging in social and political mobilisations asking for improvements in quality of government. Generally speaking, free-riding becomes more frequent at all social levels. In turn, public authorities lack both adequate resources and incentives to deliver policies, consolidating a “vicious cycle” (Charron et all, 2012:10).
In this framework, central governments in peripheral countries (especially in Italy and Greece) should focus their efforts on promoting a set of institutional reforms aimed at breaking up the nexus between the lack of social trust in local communities and political clientelism, thus
reforms aimed at breaking the linkages between decentralised governance and rent extraction by private parties, social groups or local bureaucrats. These sets of reforms would be very effective especially in countries like Italy where central government assigns large autonomy to regional governments in the management and provision of costly public services in the framework of a process of progressive devolution of the power from the State to regions.
(Lee-Jones, 2018). Such tailor-made institutional reforms should be accompanied by both the setup of independent national authorities responsible for monitoring and combatting corruption and the introduction of a more stringent code of laws to prosecute episodes of corruption of public officials or policy-makers.
References
Acemoglu, D. & Robinson, J. A. (2012). Why Nations Fail. The Origins of Power, Prosperity, and Poverty. New York: Crown Business. Doi: https://doi.org/10.1355/ae29-2j
Acemoglu, D. & Robinson, J. (2008). The Role of Institutions in Growth and Development. The International Bank for Reconstruction and Development / The World Bank On behalf of the Commission on Growth and Development. Working Paper No.10
Acemoglu, D., Johnson, S. & Robinson, J. A. (2005). Institutions as Fundamental Cause of Economic Growth. In Aghion, P. and Durlauf, S. (eds.) Handbook of Economic Growth 1A. Amsterdam: Elsevier B.V. Doi: https://doi.org/10.1016/S1574-0684(05)01006-3
Acemoglu D., Johnson, S. & Robinson, J. A. (2005a). The Rise of Europe: Atlantic Trade, Institutional Change, and Economic Growth. NBER Working Paper No. 9378. Doi:
https://doi.org/10.1257/0002828054201305
Aiginger, K.; Firgo, M. & Huber, P. (2013). What can the EMU’s Peripheral Countries Learn from Regional Growth? In Lacina, L., Rosmahel, P. & Rusek, A. (eds.) Political Economy of the Eurozone crisis. Reforms and their Limits. Mendel European Centre
Alonso, J. A. (2009). Colonisation, formal and informal institutions, and development. ICEI Working Paper No.13
Ascani, A; Crescenzi, R. & Iammarino, S. (2012). Regional Economic Development: A Review.
Search Working Paper 1/03
Barro, R. J. (1996). Determinants of Economic Growth. A Cross-country Empirical Study.
National Bureau of Economic Research, Working Paper N. 5698. Doi:
https://doi.org/10.3386/w5698
Barro, R. J. (1991). Economic Growth in a Cross-section of Countries. Quarterly Journal of Economics, 106 (2), 407-443. Doi: https://doi.org/10.2307/2937943
Canton, E. & Solera, I. (2016). Greenfield Foreign Direct Investment and Structural Reforms in
Europe: What Factors Determine Investments? European Commission, European Economy
Discussion Paper No. 033
Charron, N., Dijkstra, L. & Lapuente, V. (2015). Mapping the Regional Divide in Europe: A Measure for Assessing Quality of Government in 206 European Regions. Social Indicators Research, 122 (2), 315-346. Doi: https://doi.org/10.1007/s11205-014-0702-y
Charron, N., Dijkstra, L. & Lapuente, V. (2012). Regional Governance Matters. A study on Regional Variation in Quality of Government in the EU. European Commission Working Paper No. 01/2012
Feldkircher, M. (2006). New Regional Economics in Central European Economies: the Future of Centrope. Oesterreichische Nationalbank Working Paper No.9
Greif, A. (1994). Cultural beliefs and the Organization of Society. Theoretical reflection on Collectivist and Individualist Societies. The Journal of Political Economy, 102 (5), 912-950.
Doi: https://doi.org/10.1086/261959
Harris, R. (2008). Models of Regional Growth: Past, Present and Future. SERC Discussion Papers, SERCDP0002. Spatial Economics Research Centre (SERC), London School of
Economics and Political Science.
Huggins, R, & Thompson, P. (2017). Introducing Regional Competitiveness and Development: Theories and Perspectives. In Huggins, R. & Thompson, P. (eds.) Handbook of Regions and Competitiveness: Contemporary Theories and Perspectives on Economic Development.
Chaltam: Edward Elgar Publishing Limited. Doi:
https://doi.org/10.4337/9781783475018.00005
International
Lucas, J. R, (1988). On the Mechanics of Economic Development. Journal of Monetary Economics, 22, 3-42. Doi: https://doi.org/10.1016/0304-3932(88)90168-7
MacMullen, R. (1988). Corruption and the Decline of Rome. New Heaven: Yale University Press
Mankiw, G.; Romer, D. & Weil, D. (1992). A Contribution to the Empirics of Economic Growth.
The Quarterly Journal of Economics, 107 (5), 407-437. Doi: https://doi.org/10.2307/2118477
Martin, R. & Sunley, P. (1998). Slow Convergence? The New Endogenous Growth Theory and
Regional Development. Economic Geography, 74(3), 201-227. Doi:
https://doi.org/10.2307/144374
Mauro, P. (2002). The Persistence of corruption and Slow Economic Growth. The International Monetary Fund. IMF Working Paper No.02/13. Doi:
https://doi.org/10.5089/9781451874952.001
Mauro, P. (1995). Corruption and Growth. The Quarterly Journal of Economics, 110 (3), 681-712. Doi: https://doi.org/10.2307/2946696
North, D.C. (1991). Institutions. Journal of Economic Perspectives, 5(1), 971-112. Doi:
https://doi.org/10.1257/jep.5.1.97
Pons-Novell, J. & Viladecans-Marsal, E. (1998). Kaldor’s Law and Spatial Dependence:
Evidence for the European Regions. Regional Studies, 33(5), 443-451. Doi:
https://doi.org/10.1080/00343409950081284
Rodríguez-Pose, A., & Di Cataldo, M. (2014). Quality of government and innovative performance in the regions of Europe. Journal of Economic Geography, 15(4), 673-706. Doi:
https://doi.org/10.1093/jeg/lbu023
Rodrik, D.; Subramianan, A. & Trebbi F. (2002). Institutions Rule: the Primacy of Institutions over Geography and Integration in Economic Development. NBER Working Paper No. 9305.
Doi: https://doi.org/10.3386/w9305
Romer, P. M. (1986). Increasing Returns and Long Run Growth. Journal of Political Economy, 94, 1002–37. Doi: https://doi.org/10.1086/261420
Appendix 1. Composition and Definition of the EQI score.
EQI score is developed by The Quality of Government Institute of the University of Gothenburg
within the framework of a European Commission-funded project on measuring the Quality of Government Institutions in the European Regions. The index is built on the largest survey ever undertaken to measure the Quality of Government (EQoG). at the sub-national level. In order to capture the most relevant sub-national variation in EQoG, surveyors focus on three public services that are often financed, administrated and politically accounted for by subnational authorities: Education, Healthcare and Law Enforcement. Surveyors asked respondents “to rate these three public services with respect to three related concepts of QoG – the quality, the impartiality and the level of corruption of said services”.
The regional data combine 16 survey questions about the Quality of Government in a region. To construct the regional index, surveyors followed carefully the guidelines provided in the “Handbook on Constructing Composite Indicators; Methodology and User Guide” published in 2008 by the OECD. All the QoG questions are aggregated from the individual to regional level. Next, the 16 regional scores are standardised so as to obtain a common range via standardisation. Then the standardised scores are assigned to three different groups named “pillars” containing scores related to question about impartiality, corruption and quality. Each
variable is given the same weight in each pillar. Finally, the three pillars are combined using equal weighting to form the regional index (Charron et al., 2012).
Appendix 2
Multicollinearity occurs when a high correlation is detected among the predictors in a regression model. More precisely, multicollinearity arises when one of the regressors is a perfect linear combination of the other regressors. In the case of the model specified in this article, investment rates in the different sectors of the economy (or the share of a sector of the total GVA). may be correlated, especially averaged over the long period. For example, an increase in investment in the constructions, a very important steel-using sector, may be positively correlated to an increase in the investment rate in the manufacturing activity involved in the production of steel. A first possible strategy to check for multicollinearity is to examine the correlation matrix of the predictors, where correlation coefficients would indicate the presence of multicollinearity. Therefore, the pairwise correlation coefficients between two explanatory variables would be close to 1 if a regressor is a linear function of another regressor.
Table 10. Pairwise correlations between classes of investment rates.
Table 11. Pairwise correlations between the sectorial components of the total Gross Value Added.
GVA Average
services (-.55). In Table 11, the larger correlation coefficient in absolute terms is the one detected between industry GVA and GVA in market services (-.64). All the correlation coefficients in absolute values lay below the threshold of 0.50.
Table 12. OLS version of the original probit models. Dependent variable: average GDP per capita growth
2001-2015.
Investment in Market Services GDP -.00007
[.0001]
Average GVA Market Services -.0002**
[.0001]
Although the correlation matrix analysis indicates that there exists no multicollinearity problem in the model, I also perform the Inflation Variance Factor (IVF) test. In order to perform this test, it is necessary to perform an OLS regression because the IVF is an index that measures to what extent the variance of the estimated regression coefficient is increased as a consequence of multicollinearity. Let Rj2 indicates the coefficient of determination of a
regression equation in which xj is regressed on all the other predictors of the model. Let VIFj be
determined as VIFj =1/ (1-Rj2). for j=1,2,…p-1. Therefore, when Rj2 is equal to 0 the VIFj would
be equal to 1 (=1/ (1-02), meaning that the jth is not linearly related with the other predictors.
Symmetrically when Rj2 is equal to 1 (the highest possible coefficient of determination), the VIFj
would be equal to ∞ (=1/ (1-12), meaning the jth is linearly related with the other predictors. The
rule to establish whether there exists multicollinearity within a model is provided by Montgomery (2001). that individuates VIF threshold values. If the VIF values exceed 5 or 10 it means that the model is poorly estimated because of the presence of multicollinearity. Table 12 shows the regression output of the OLS version of the Probit model whose dependent binary variable replaced with the average GDP per capita growth in the period 2001-2015. Also, the natural logarithm of GDP per capita in 2001 is included in the linear regression in order to control for initial conditions. Once the OLS model has been estimated, it is possible to estimate the VIF for each variable. The estimation of the two models is reported in Table 13.
Table 13. VIF.
IVF Model 9a IVF Model 9b
EQI Score 4.05 GVA Manufacturing Industry 4.44
Working Age Population with
Primary Education or Less 3.48 Log of GDP pc in 2001 4.10
Investment in Construction to
GDP 2.44 Market Services GVA 3.51
Log of GDP pc in 2001 2.35 Non-Market Services GVA 3.42
Working Age Population with
Tertiary Education 2.35 Primary Education or Less Working Age Population 3.22 Investment in non-Market
Services GDP 2.09 EQI Score 2.77
Investment in Agriculture to
GDP 1.48 Construction GVA 2.11
Investment in Maunufacturing
Industry 1.21 Working Age Population with Tertiary Education 2.07 Investment in Market Services
GDP 1.18 Agriculture GVA 1.77