Monitoring mitochondrial [Ca2+] dynamics with rhod 2, ratiometric pericam and aequorin
Texto completo
Figure
![Fig. 1. Monitorization of [Ca 2+ ] M with mitRP. HeLa cells expressing mitRP were stim- stim-ulated with 100 M histamine as indicated](https://thumb-us.123doks.com/thumbv2/123dok_es/2890334.549230/3.892.479.805.631.1093/monitorization-mitrp-hela-cells-expressing-ulated-histamine-indicated.webp)
![Fig. 2. Effects of two consecutive agonist stimulations on [Ca 2+ ] M measured with rhod-2, aequorin or pericam](https://thumb-us.123doks.com/thumbv2/123dok_es/2890334.549230/4.892.219.693.528.1047/fig-effects-consecutive-agonist-stimulations-measured-aequorin-pericam.webp)

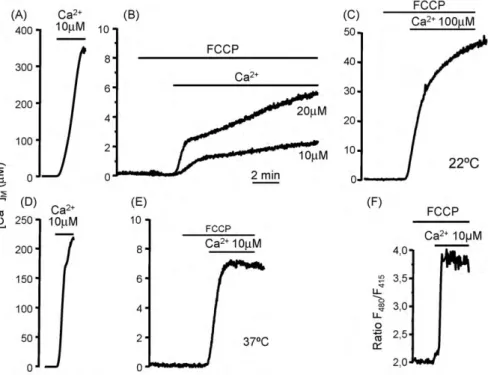
![Fig. 3 shows the effect on [Ca 2+ ] M of repetitive addition of a Ca 2+](https://thumb-us.123doks.com/thumbv2/123dok_es/2890334.549230/6.892.172.738.345.1106/fig-shows-effect-ca-m-repetitive-addition-ca.webp)
Documento similar
In recent years, photometric redshift galaxy surveys have arisen as powerful probes of the Large Scale Structure (LSS) of the Universe and dark energy.. The Dark Energy Survey (DES)
No changes were observed in EC co-cultured with mock-treated B cells or stimulated B cells; only in the condition where EC were co-cultured with HIV-1 NL4-3 -treated B cells did
The success of computational drug design depends on accurate predictions of the binding free energies of small molecules to the target protein. ligand-based drug discovery
Chapter 3 proposes several structures of transmission lines loaded with electrically small resonators, which include a coplanar waveguide (CPW) loaded with a pair of split ring
On behalf of the CMS Collaboration On behalf of the CMS Collaboration.. Higgs Production via Vector Boson Fusion Higgs Production via Vector Boson Fusion Higgs Production via
HCT116 cells were incubated with H89 or db-cAMP or were left untreated prior to mitochondrial extraction to study the effect of IF1 phosphorylation on the hydrolase and
(e–g) Phagocytosis assays were carried out as above, with MnCl 2 -stimulated shCtrl and shRIAM cells, which were left to phagocytose for a set amount of time, and the Association
Propagation 35–37 method, ADMP, as implemented in the Gaussian09 Package 38 (see Methods). Figure 3a shows the calculated number of trajectories as a function of the migration time
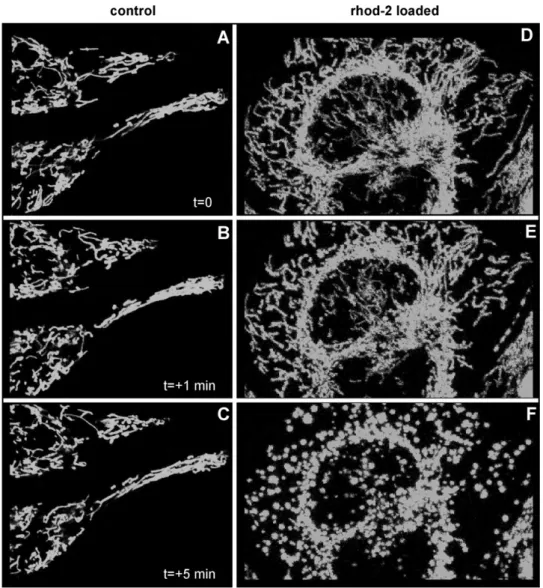
![Fig. 6. Effect of loading with rhod-2 or rhod-FF on agonist-induced cytosolic and mitochondrial [Ca 2+ ] peaks](https://thumb-us.123doks.com/thumbv2/123dok_es/2890334.549230/7.892.184.696.616.1077/fig-effect-loading-agonist-induced-cytosolic-mitochondrial-peaks.webp)

