Nitrogen carbon graphite like semiconductor synthesized from uric acid
41
0
0
Texto completo
(2) 25. 9. 26 27. Guevara E11-253 Quito, Ecuador. 10. 28 29. Escuela Politécnica Nacional, Departamento de Formación Básica, Ladrón de. Instituto Nacional de Eficiencia Energética y Energías Renovables (INER), Iñaquito N3537 y Juan Pablo Saenz, Quito, Ecuador.. 11. Departamento de Química, Centro de Investigación y de Estudios Avanzados del. 30. Instituto Politécnico Nacional (CINVESTAV-IPN). Av. IPN 2508, Col. San Pedro. 31. Zacatenco, Apdo. Postal 14-740, Mexico D.F. 07360, Mexico.. 32 33. Abstract. 34. A new carbon-nitrogen organic semiconductor has been synthesized by pyrolysis of uric. 35. acid.. 36. (naphthyridine)- and graphitic-like nitrogen, as evinced by infrared and X-ray. 37. photoelectron spectroscopies. Quantum chemistry calculations support that it would. 38. consist of a 2D polymeric material held together by hydrogen bonds. Layers are stacked. 39. with an interplanar distance between 3.30 and 3.36 Å, as in graphite and coke. Terahertz. 40. spectroscopy shows a behavior similar to that of amorphous carbons, such as coke, with. 41. non-interacting layers. This material features substantial differences from polymeric. 42. carbon nitride, with some characteristics closer to those of nitrogen-doped graphene, in. 43. spite of its higher nitrogen content. The direct optical band gap, dependent on the. 44. polycondensation temperature, ranges from 2.10 to 2.32 eV. Although in general the. 45. degree of crystallinity is low, the material synthesized at 600 °C is composed of globular. 46. hollow particles, in which spots with a certain degree of crystallinity can be found.. This. layered. carbon-nitrogen. material. contains. imidazole-,. pyridine. 47 48. Keywords: carbon nitride, nitrogen-carbon materials, organic semiconductor, THz. 49. spectroscopy, uric acid. 2.
(3) 50 51. 1. Introduction. 52. The piece of work presented herein on the products obtained from the pyrolysis of uric. 53. acid (UA) started with the objective to find an alternative pathway for the synthesis of. 54. polymeric carbon nitride (g-C3N4), an organic semiconductor that is receiving. 55. substantial attention due to its versatility and many potential applications [1-15].. 56. However, the chosen precursor yielded a material with a lower nitrogen content (N to C. 57. atomic ratio ~0.6) than that of g-C3N4 (N to C atomic ratio of 1.5) and different polymer. 58. structure and electronic properties.. 59. This novel carbon-nitrogen material would also belong to the class of organic. 60. semiconductors, which combines the electronic advantages of semiconducting materials. 61. with the chemical (and mechanical) benefits of organic compounds. Therefore, the. 62. ability to absorb light and conduct electricity is coupled with a structure with a flexible. 63. backbone that can easily be modified by chemical synthesis (however, the control of. 64. modifications may depend on several factors).. 65. The new synthesized material can be regarded as a graphitic material with imidazole-,. 66. pyridine (naphthyridine)- and graphitic-like nitrogen. Nonetheless, whereas the. 67. concentration of nitrogen in the either nitrogen-doped or defective graphite is around 2. 68. or 3 at% (N to C atomic ratio of ca. 0.03%), the nitrogen content in this new material is. 69. much higher (~33 at%), forcing to a less randomized distribution of defects. For. 70. example, the recently synthesized C2N exhibited a very organized 2D structure. C2N, in. 71. combination with g-C3N4, offers a potential way to improve the efficiencies of both. 72. photoabsorption and electron–hole separation of g-C3N4 without involving any transition. 73. metals. Fechler et al. synthesized nitrogen rich graphitic materials starting from various. 74. types of quinones and urea as precursors, showing that the amount of nitrogen in the. 3.
(4) 75. final materials depended on reaction temperature [16-19].. 76. Another extensively nitrogen-doped (mesoporous) carbon was synthesized by Goel et. 77. al. from melamine and formaldehyde. They obtained an interesting cross-linked. 78. structure by nanocasting that would mainly be ascribed to a certain type of melamine-. 79. formaldehyde resin with a high content of bridging oxygen atoms. On the contrary, the. 80. material under study has a very low content of oxygen [20]. Organic semiconductors of. 81. the indolocarbazole family have similar nitrogen-containing basic units and tend to have. 82. a π-π stacking and band gaps between 2.50 and 2.90 eV, depending on the side chains. 83. and the oligomer type [21-23]. Their degree of crystallinity has been shown to depend. 84. largely on the side chains and oligomer length, copolymers, as well as on the deposition. 85. method [21,22]. When they are part of large polymers, they tend to be more amorphous. 86. and the diffraction peaks become much broader and can be considerably shifted [23]. An. 87. example of these basic semiconductors is shown in Fig. 1, where R can be a side chain.. 88 R N. N. 89 90. R. Fig. 1. Chemical structure of based oligomers, R is a side chain [22].. 91 92. The specific combination of imidazolic, pyridinic, and graphitic nitrogen of the. 93. materials synthesized with UA is actually determined by the decomposition pathway of. 94. the crystalline UA and can be regarded as one of the upper limits of nitrogen-doped. 95. graphite (graphene) materials, such as those reported by Fechler et al. and Mahmood et. 96. al. [17,19].. 4.
(5) 97 98. Fig. 2. Formulas of uric acid (left) and melamine (right).. 99 100. 2. Experimental. 101. 2.1. Materials. 102. Uric acid was supplied by Aesar and melamine was supplied by Sigma-Aldrich with. 103. purities higher than 99% (the chemical formulas are displayed in Fig.2). A mixture of 95. 104. wt% of uric acid and 5 wt% of melamine was prepared and milled in an agate mortar for. 105. 5 min (both materials are solids). Portions of 5 g of the blend were treated at different. 106. temperatures and times in air: 450 °C for 15 min, 550 °C for 15 min, 600 °C for 15 and. 107. 30 min. Samples were identified as CN450, CN550, CN600-1, CN600-2, respectively.. 108. The (weight) reaction yields were 74.33%, 67.87%, 44.89%, and 34.36%, respectively,. 109. corresponding to different decomposition advancements and to the formation of. 110. nitrogen-rich powder products. The products exhibited different colors from brown. 111. (CN450) to intense black (CN600-2).. 112 113. 2.2. Analytical Methods. 114. FT-IR spectroscopy: The infrarred spectra were obtained by means of a Agilent Carey. 115. 630 Fourier Transform-Infrarred (FT-IR) spectrometer (Agilent Technologies, Santa. 116. Clara, CA, USA). The IR spectra were obtained directly from the solid materials by. 117. attenuated total reflectance (ATR).. 118. X-ray diffraction measurements: The X-ray diffraction patterns were obtained with a. 119. Rigaku ULTIMA-IV Bragg-Brentano powder diffractometer (Rigaki Corp., Tokyo, 5.
(6) 120. Japan) with Cu Kα radiation. Glass capillaries were used for sample mounting. The. 121. measurements always lasted for 1 hour, and crystalline silicon was used as a standard.. 122. TEM characterization: Samples were studied by transmission electron microscopy. 123. (TEM) with a JEM-2010F and a JEM-1010 (JEOL, Akishima, Tokyo, Japan) in order to. 124. observe the particles morphology at lower magnifications and to find structural. 125. information complementary to the X-ray diffraction data. The samples’ preparation. 126. consisted of dispersing the materials into 2-butanol, treating them in an ultrasonic bath. 127. for 30 min, and then depositing a micro-droplet (2.5 μl) of the suspended fraction on a. 128. Cu grid. Once the 2-butanol was evaporated, the grids were ready for observation.. 129. Thermal analysis: The thermal stability and decompostion rate of the products was. 130. evaluated by thermogravimetric analysis using a SETSYS Evolution 1750 TGA-. 131. DTA/DSC (SETARAM Instrumentation, Caluire-et-Cuire, France) with an nitrogen. 132. flow rate of 30 mL/min and a temperature increment rate of 10 °C/min up to 900 °C.. 133. UV-vis spectroscopy: UV-Vis diffuse reflectance spectra were measured using a. 134. Perkin Elmer Lambda 35 UV-Vis spectrophotometer (Perkin Elmer Inc., Waltham, MA,. 135. USA). A Spectralon® blank was used as reference. The reflectance data were. 136. transformed to absorbance data applying the Kubelka-Munk method (Equation 1):. 137. 𝐹𝐹(𝑅𝑅) =. (1−𝑅𝑅)2 2𝑅𝑅. (1). 138. where R is the reflectance and F(R) is the Kubelka-Munk (K-M) function. The band gap. 139. was estimated through a Tauc plot [24,25].. 140. TeraHertz-time domain spectroscopy measurements: The materials under study were. 141. dispersed in polyethylene (PE) powder in a variable low concentration and the mixture. 142. was thoroughly milled in an agate mortar in order to form a uniform mixture. Ultra-high. 143. molecular weight surface-modified, 53–75 μm particle size PE from Sigma–Aldrich was. 144. employed. The resulting samples were pressed, using a Graseby Specac press, to form. 6.
(7) 145. pellets with a diameter of 13 mm. A Menlo Tera K15 Spectrometer (Menlo Systems. 146. GmbH, Planegg, Germany) was used for the THz-TDS analysis. The system was. 147. operated in a nitrogen rich atmosphere in order to avoid the signature of water. 148. absorption in the recorded samples. In order to reduce the noise, the results from at least. 149. twenty consecutive samples and reference measurements were averaged to obtain the. 150. spectral data. The material parameters in the spectral range of interest were calculated. 151. from the time domain photocurrent traces measured with the spectrometer. These time. 152. domain waveforms depend not only on the material data but also on the width of the. 153. pellets due to the contributions from multiple reflections at the pellet-air interfaces.. 154. Signal processing techniques similar to those described by Duvillaret et al. and flat-top. 155. windowing of the time-domain data were employed in order to obtain the THz spectra of. 156. the materials [26,27].. 157. X-ray photoelectron spectroscopy: X-ray photoelectron spectroscopy (XPS) analyses. 158. were performed using a Versa Probe II X-ray photoelectron spectrometer (Physical. 159. Electronics, Chanhassen, MN, USA) with a monochromatic Al Kα X-ray source (1486.6. 160. eV) and a base pressure of 1×10⁻⁹ Torr in the analytical chamber. The X-rays were. 161. microfocused at the source to give a spot size on the sample of 100 µm in diameter,. 162. using the standard-lens mode. The analyzer was run in constant analyzer energy (CAE). 163. mode. Survey and high resolution spectra were collected using analyzer pass energies of. 164. 120 and 40 eV, respectively. The binding energy at of 284.6 eV of C-C carbon was used. 165. as a reference and a starting point for the C1s peak deconvolution. High resolution. 166. spectra were deconvoluted using Gaussian–Lorentzian mix function and Shirley-type. 167. background subtraction.. 168 169. Quantum. chemistry. calculations:. The. semiempirical. quantum. chemistry. computations were performed with the PM6 method using the parallel implementation. 7.
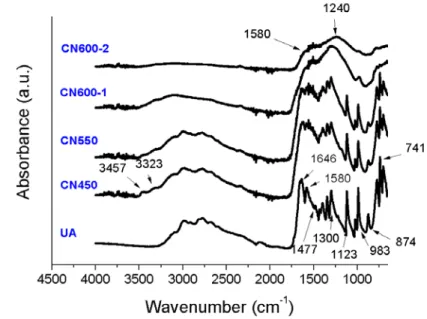
(8) 170. for multi-threaded shared-memory CPUs and massively parallel GPU acceleration of the. 171. MOPAC2012 software package. A Fedora Linux server with a 12 cores Intel Xeon. 172. processor and a NVIDIA Tesla K20 GPU were used for the computations [28-30].. 173 174. 3. Results and discussion. 175. 3.1. Structural and physical-chemical characterization. 176. 3.1.1. Infrared spectroscopy. 177. The IR spectrum of solid UA (see Fig. 2) was dominated by the absorptions related to. 178. three chemical groups: NH, OH, and carbonyl CO. The amidic carbonyl generates two. 179. bands at 1650 and 1580 cm-1, typical of secondary amides; the band at 1477 cm-1 can be. 180. related to C-OH bending; and the broad band at around 3000 cm-1 is connected to OH. 181. stretching vibrations, all interacting by hydrogen bond. The observation of vibrations. 182. associated with OH, instead of only CO, is due to imide-amide tautomerism. The imide. 183. form of uric acid would be predominant in this supramolecular solid, held by hydrogen. 184. bonds. The series of bands between 1410 and 1300 cm-1 can be ascribed to O-H in-plane. 185. bending vibrations, while the vibration of out-of-plane bending is located at 680 cm-1.. 186. The two main peaks between 1123 and 983 cm-1 correspond to C-O stretching vibrations. 187. of COH. The peaks at 874 and 780 cm-1 are due to N-H bending and N-H wagging,. 188. respectively.. 189. 8.
(9) 190 191. Fig. 2. IR spectra of uric acid (UA) and its pyrolysis products obtained at 450 °C, 550. 192. °C and 600 °C: CN450, CN550, CN600-1 and CN600-2 (CN600-1: 15 min of treatment,. 193. CN600-2: 30 min of treatment).. 194 195. The spectrum of CN450 showed the same bands discussed for the UA starting. 196. material. However, it was possible to notice that some small bands appeared at 3457 and. 197. 3323 cm-1. These new bands correspond to OH stretching vibrations not interacting via. 198. hydrogen bond, and so they would be indicative of the beginning of the disaggregation. 199. of the supramolecular network. Moreover, the bands of carbonyl stretching and those of. 200. OH in-plane bending seemed to be overlapped with two new growing broad bands. The. 201. situation for CN550 was similar, since the forming pyrolysis product was mixed with the. 202. initial UA and their bands were still overlapped. This transition phase is supported by. 203. the appearance of free OH stretching vibration from the remaining UA molecules, which. 204. are no longer interacting via hydrogen bond due to the transformation of their UA. 205. neighbors into the pyrolysis products.. 206. The situation radically changed in CN600-1 and CN600-2 spectra, in which most. 207. bands associated to OH, CO and NH groups disappeared. In the spectrum of the former,. 9.
(10) 208. some residual C-OH bands were still present, such as the small peak at around 983 cm-1.. 209. A shoulder due to carbonyl stretching could also be discerned above 1600 cm-1. It is. 210. worth noting that the stretching bands of non-interacting OH (above 3300 cm-1) were. 211. proportionally higher than those of CN450 and CN550 samples, indicating that the. 212. pyrolysis process was more advanced. Conversely, in CN600-2 spectrum the OH. 213. stretching bands had almost disappeared. The broad bands at 1580 and 1240 cm-1 seem. 214. to be associated to vibrations of 6-5 atoms nitrogen-containing rings [I. López Tocón,. 215. M.S. Woolley, J.C. Otero, J.I. Marcos “Vibrational spectrum of 3-methyl and 4-. 216. methylpyridine” Journal of Molecular Structure 470 (1998) 241-246] [31-32]. Indeed,. 217. the band at 1580 cm-1 may belong to ring stretching vibrations from both pyridine-like. 218. and imidazole (or pyrrole) -like rings, while the band at 1240 cm-1 can be associated to. 219. C-N stretching of imidazole-like rings [S. Gunasekaran , G. Sankari, S. Ponnusamyc,. 220. “Vibrational spectral investigation on xanthine and its derivatives—theophylline,. 221. caffeine and theobromine”, Spectrochimica Acta Part A 61 (2005) 117–127]. This latter. 222. claim is also supported by the similarity of the spectrum of CN600-2 to that of nitrogen-. 223. doped graphene, where pyrrole-like and pyridine-like nitrogen atoms are present, apart. 224. from graphitic nitrogen [31-33].. 225 226. 3.1.2. Morphology of the products: TEM analysis. 227. TEM micrographs, representative of the suspended fraction (see Section 2.2) of each of. 228. the pyrolysis products, are depicted in Fig. 3.. 10.
(11) 229 230. Fig. 3. TEM micrographs of CN450, CN550, CN600-1 and CN600-2.. 231 232. It is noteworthy that the morphology of CN450, with crumpled particles, was similar. 233. to that observed in the formation of g-C3N4 from melamine cyanurate, which occurs. 234. through a topotactic transformation [34]. In CN550 and CN600-1 samples the particles. 235. were mainly composed of nanosheets, while in CN600-2 these nanosheets tended to. 236. form also hollow structures, as a consequence of the topotactic transformation. 237. advancement. As regards CN600-2 sample, it was possible to observe diffraction planes. 238. (see Fig. 4). The interplanar distance, 3.36 Å, was found to be compatible with the main. 239. peak in the XRD pattern.. 11.
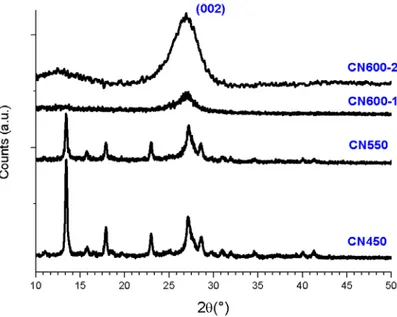
(12) 240 241. Fig. 4. Diffraction planes in TEM micrographs of CN600-2 sample. Left: a view on a. 242. particle showing an ordered spot in the middle of a more disordered area; Right: an. 243. insight view on the ordered spot.. 244 245. 3.1.3. X-ray diffraction (XRD) measurements. 246. The powder X-ray diffraction patterns of CN450 and CN550 samples, shown in Fig. 5,. 247. were in agreement with that of crystalline UA. This further supports that the starting. 248. material (UA) would be still present in considerable amounts in samples treated below. 249. 600 °C (the XRD pattern of CN450 is substantially identical to that of anhydrous uric. 250. acid) [Supplementary Information, Yuya Oaki, Soichiro Kanekoa and Hiroaki Imai,. 251. Morphology and orientation control of guanine crystals: a biogenic architecture and its. 252. structure mimetics, J. Mater. Chem., 2012,22, 22686-22691]. Moreover, the XRD. 253. pattern of CN600-1 corresponded to a quite amorphous material with a broad peak. 254. around 27°, which seems to result directly from the UA peak at 27°, provided that the. 255. basic layered features of the original structure would be preserved (topotactic. 256. transformation). Nevertheless, all the other peaks were not visible. The intensity of the. 257. reflection at 26.97°, corresponding to an interplanar spacing of 3.31 Å, became much. 12.
(13) 258. higher (26.97°), still remaining quite broad, and the broad peak at 12.58° (spacing of. 259. 7.03 Å), corresponding to an in-plane structural packing motif, became more evident. It. 260. should be pointed out that in the final product the stacking order seems to prevail over. 261. the in-plane one. The crystallization process driven by temperature was also revealed by. 262. the broad exothermic band found in differential scanning calorimetry at ca. 600 °C.. 263. 264 265. Fig. 5. X-ray diffraction patterns of CN450, CN550, CN600-1, and CN600-2.. 266 267. The typical diffraction peak at around 27° has also been found in other nitrogen-. 268. doped graphene or graphite materials. In fact, Horibe et al. reported that this interplanar. 269. distance decreases monotonously with increasing N/C content ratio [35,36]. According. 270. to Horibe’s reports, an interplanar distance of 3.31 Å would correspond to an N/C. 271. atomic ratio close to 0.6, which is actually very close to the one found by X-ray. 272. photoelectron spectroscopy for the materials under study.. 273 274. 3.1.4. Thermal behavior analysis. 13.
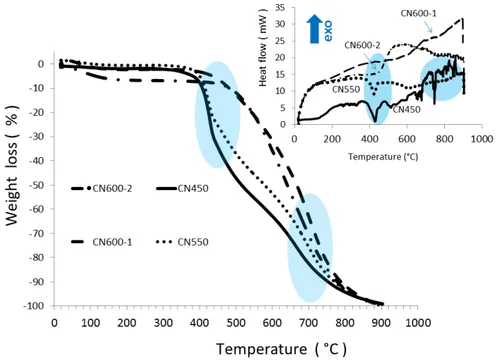
(14) 275. The weight losses in the thermogravimetric analysis (TGA) curves of both CN450 and. 276. CN550 samples (see Fig. 6) in nitrogen atmosphere above 400 °C can be ascribed to UA. 277. and melamine decomposition. The loss at around 400 °C (first circle in the TGA. 278. thermograms in Fig. 6) was more pronounced in CN450 than in CN550 because of the. 279. higher starting material concentration in the former (in which polycondensation was. 280. conducted at a lower temperature). These losses were no longer present in CN600-1 and. 281. CN600-2 samples, indicating that in the both cases UA had been completely consumed.. 282. The second weight loss above 600 °C (second circle in Fig. 6) in all samples was due to. 283. the final decomposition of the products.. 284. The endothermic peaks in the differential thermal calorimetry (DSC) curves of both. 285. CN450 and CN550 (see inset in Fig. 6) at around 400 °C can thus be associated to the. 286. starting materials’ decomposition. Other DSC peaks above 600 °C may be due to the. 287. decomposition of by-products in CN450. The endothermic peaks around 400 °C were no. 288. longer present in CN600-1 and CN600-2. On the contrary, broad exothermic peaks at. 289. around 600 °C appeared in both CN600-1 and CN600-2 (especially evident in CN600-. 290. 2). It seems that, in conjunction with the final (endothermic) decomposition, a. 291. (exothermic) process of crystallization occurred. These processes were eventually. 292. confirmed by X-ray diffraction.. 293. 14.
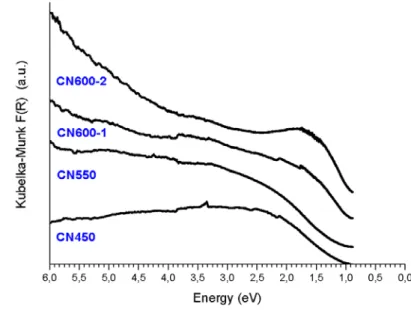
(15) 294 295. Fig. 6. Thermogravimetric curves of CN450, CN550, CN600-1, and CN600-2. Inset:. 296. differential scanning calorimetry curves of the same samples. The circles in the graphics. 297. highlight the main transformations.. 298 299. 3.1.5. UV-visible spectroscopy. 300. The UV-visible spectra of the four samples exhibited an increase in the absorption as the. 301. polycondensation temperature was increased, as shown in Fig. 7. In the spectrum of. 302. CN600-2 there was an evident but broad peak between 1.7 and 1.5 eV (around the. 303. wavelength of 750 nm) in the red region. The increment in this band intensity would. 304. correspond to the enrichment of the samples in final product as a function of the thermal. 305. treatment temperature, also confirmed by other techniques.. 306. 15.
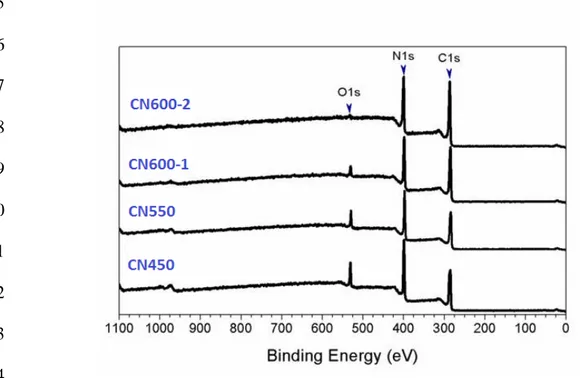
(16) 307 308. Fig. 7. UV-visible Kubelka-Munk, F(R), spectra of CN450, CN550, CN600-1, and. 309. CN600-2.. 310 311. The direct band gap values estimated by Tauc plot were 2.10, 2.22 and 2.32 eV for. 312. CN550, CN600-1 and CN600-2, respectively. The direct band gap could not be. 313. determined by Tauc plot for CN450, since the final product yield was still low in this. 314. case. Moreover, the indirect band gap was considerably lower and had values around. 315. 0.90 eV for all the samples, indicating that this gap is more related to the assembly of the. 316. product molecules.. 317 318. 3.1.6. X-ray photoelectron spectroscopy. 319. In order to confirm the incorporation of nitrogen atoms into the polymer network and to. 320. identify the carbon-nitrogen species formed during the synthesis process, XPS analysis. 321. of the four semiconducting polymer samples was conducted. The evolution and. 322. quantification of the carbon, nitrogen and oxygen species was established by comparison. 323. of the relative intensities of the C1s, N1s and O1s peaks (Fig. 8) and by elemental. 324. quantification of the carbon, nitrogen and oxygen contents (Table 1).. 16.
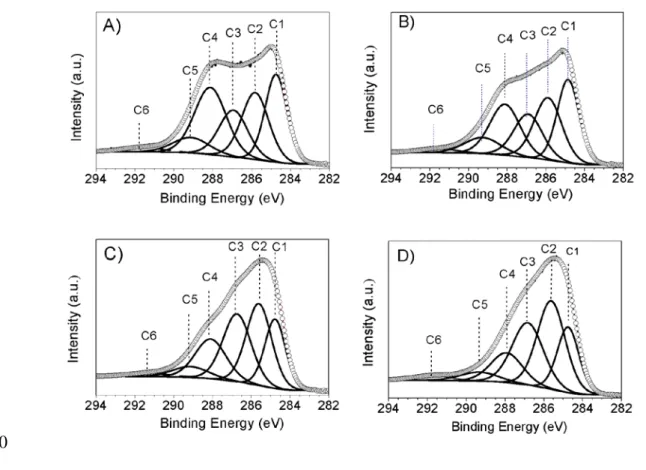
(17) 325 326 327 328 329 330 331 332 333 334 335. Fig. 8. XPS survey spectra of the samples CN450, CN550, CN600-1, and CN600-2.. 336 337 338 339. Table 1. Estimated elemental carbon, nitrogen and oxygen contents for the different UA. 340. polycondensation products. Sample. C [%]. N [%]. O [%]. CN450. 52.4. 36.1. 11.5. CN550. 55.3. 34.4. 10.3. CN600-1. 56.3. 36.7. 7.0. CN600-2. 58.2. 37.4. 4.4. 341 342. The high-resolution XPS spectra in the C1s region of the four samples are shown in. 343. Fig. 9. The spectra were fitted by six Gaussian-Lorentzian contributions with binding. 344. energies (BE) centered at 284.8, 285.8, 286.9, 288.1, 289.1 and 291.6 ±0.2 eV, and. 345. corresponding to C-C and sp2 (C=C) (C1), pyridinic (naphthyridinic) C-N (C2), C=O. 17.
(18) 346. and imidazolic C-N-H (C3), -COOH and imidazolic C=N (C4), O-C(=O)-O (C5) and π-. 347. π* (C6), respectively [37-43]. The binding energies and relative weight percent (wt%). 348. associated with each contribution are summarized in Table 2.. 349. 350 351. Fig. 9. High-resolution XPS spectra in the C1s region: deconvoluted peaks for the. 352. various UA polycondensation products: A) CN450, B) CN550, C) CN600-1 and D). 353. CN600-2.. 354 355. Table 2. Deconvolution and carbon chemical species quantification results for C1s core. 356. level spectra (BE: binding energies). Sample BE CN450 CN550 CN600-1 CN600-2. BE [± 0.2 eV] wt% wt% wt% wt%. C1 284.8 24.2 25.8 20.0 19.5. C2 285.8 22.8 24.4 29.0 33.8. C3 286.9 16.9 17.6 26.6 26.7. C4 288.1 26.8 21.9 17.2 12.9. C5 289.1 7.1 8.3 5.5 4.7. C6 291.6 2.3 2.1 1.9 2.4. 357. 18.
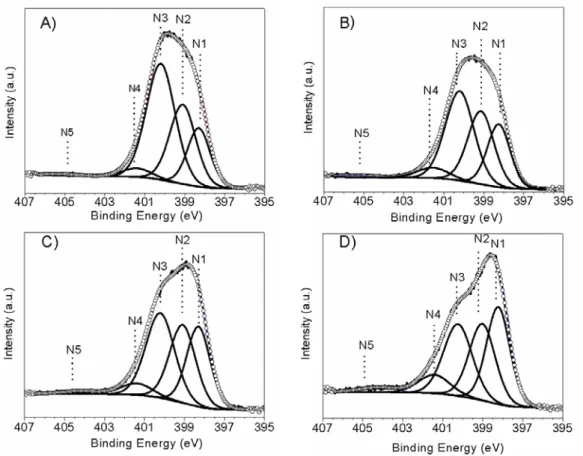
(19) 358. The presence of five nitrogen species in the N1s region, 395.0–407.0 eV, was verified. 359. upon deconvolution of the high-resolution spectra of the four samples under study (see. 360. Fig. 10). The BEs of the five Gaussian-Lorentzian contributions (viz. 398.3, 399.1, 400.2. 361. and 404.2 ±0.2 eV), corresponding to pyridinic (naphthyridinic) N (N1), imidazolic C-. 362. NH (N2) (a small part of N2 can be also due to nitrile species since a very weak peak. 363. can be seen in the IR spectrum of CN600-2), imidazolic C-N-C (N3), graphitic N (with. 364. latitude it means a 3-coordinated N similar to that of amorphous CNx) or C-O-N (N4). 365. and π-π* (N5), respectively [36-42], and relative weight percent (wt%) values are. 366. presented in Table 3.. 367. The ratio N1:N2:N3 for CN600-2 was approximately 1:1:1, suggesting that these. 368. types of nitrogen could belong to a well-defined structure (not randomly distributed). It. 369. is noteworthy that imidazole seems to be formed before than naphthyridine (in fact, the. 370. N2 and N3 contents were higher than those of N1 in the samples treated below 600°C),. 371. which implies the condensation of the 6 atoms-rings of two UA molecules.. 372. 19.
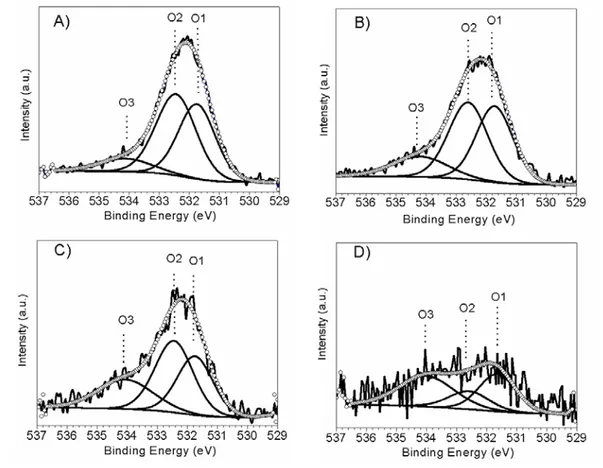
(20) 373 374. Fig. 10. High-resolution XPS spectra in the N1s region: deconvoluted peaks for the. 375. various UA polycondensation products: A) CN450, B) CN550, C) CN600-1 and D). 376. CN600-2.. 377 378 379. Table 3. Deconvolution and nitrogen chemical species quantification results for N1s. 380. core level spectra (a) BE was 404.2 eV for both CN600-1 and CN600-2. Sample BE CN450 CN550 CN600-1 CN600-2. BE [± 0.2 eV] wt% wt% wt% wt%. N1 398.3 19.0 22.8 27.6 31.9. N2 399.1 29.4 30.2 29.8 28.2. N3 400.2 47.0 40.5 35.5 28.9. N4 401.4 3.8 5.3 5.4 8.4. N5 405.0 0.8 1.3 1.7(a) 2.6(a). 381 382. The O1s peaks (in the 529.0–537.0 eV region), arising from the oxygen-carbon. 383. species or from water absorbed on the surface of the semiconductor polymers, are. 384. depicted in Fig. 11, together with their fit to three Gaussian-Lorentzian contributions.. 20.
(21) 385. These contributions, centered at 531.8, 532.5 and 534.2 ± 0.2 eV, were correlated with. 386. N-C-O (O1), C-O or C-OH (O2) and adsorbed H2O (O3), respectively. The oxygen. 387. bonds and their relative mass fractions (wt%) are condensed in Table 4.. 388. 389 390. Fig. 11. High-resolution XPS spectra in the O1s region: deconvoluted peaks for the. 391. various UA polycondensation products: A) CN450, B) CN550, C) CN600-1 and D). 392. CN600-2.. 393 394. Table 4. Deconvolution and oxygen chemical species quantification results for O1s core. 395. level spectra(BE: binding energies). Sample BE CN450 CN550 CN600-1 CN600-2. BE [± 0.2 eV] wt% wt% wt% wt%. O1 531.8 41.2 40.3 32.5 36.3. O2 532.5 48.6 43.4 42.3 19.3. O3 534.1 10.3 16.3 25.2 44.5. 396 21.
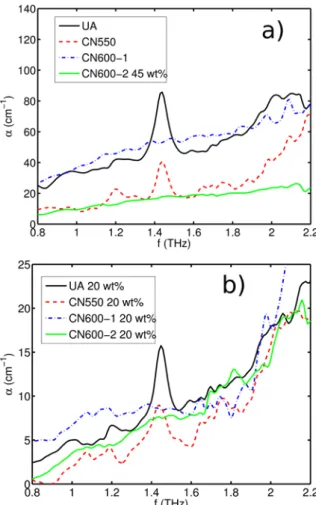
(22) 397. 2.1.7. THz-TDS measurements. 398. The room temperature THz-TDS spectra of the four pyrolysis products in the 0.8–2.2. 399. THz range are shown in Fig. 12(a) displays the results for pure material pellets –except. 400. for CN600-2, which was diluted at a 45 wt% concentration in a PE matrix (since it was. 401. impossible to prepare a pure sample pellet)–, while Fig. 12(b) shows the spectra for all. 402. the samples dispersed in PE at a 20 wt% concentration. Even though the total absorption. 403. was much smaller in this case, which made the measurements noisier, it provided a fair. 404. comparison between all the samples.. 405. Previously reported THz-TDS measurements of UA at 77 K showed two peaks in this. 406. band: a very strong resonance close to 1.5 THz and a much smaller peak near 1.35 THz. 407. [44]. Both peaks were clearly present in the UA and CN550 samples, in particular the. 408. strongest absorption band, albeit with a red-shift of both resonances, as they were. 409. measured at room temperature. This temperature dependence is typical of THz. 410. vibrational resonances associated with crystal lattice modes [45]. In the present case, the. 411. main signature of the THz spectrum was shifted to 1.44 THz when the measurement was. 412. performed at room temperature. A contribution to the total attenuation –that increased. 413. monotonically with frequency– was present, which would be due to scattering. There. 414. was also a small absorption band at 1.99 THz, which can be due to the presence of. 415. melamine at a small concentration [46].. 416. 22.
(23) 417 418. Fig. 12. THz-TDS measurements of the samples. The results in (a) correspond to pure. 419. samples, except for CN600-2, for which a pellet in a PE matrix with 45 wt% was used.. 420. In (b), all the samples were dispersed at a 20 wt% concentration in PE.. 421 422. The significant reduction of the signature contributed by the precursor material to the. 423. total attenuation after thermal treatment at 550 ºC indicates its transformation into the. 424. carbon-nitrogen product. When the processing temperature was further increased to 600. 425. ºC, the attenuation traces of the reagent completely disappeared and the attenuation. 426. features typical of disordered materials dominated [47]. There was a reduction of the. 427. total attenuation of CN600-2 when compared to that of CN600-1. Also, the faint. 428. resonance in the higher frequency end of the spectrum that was common to the CN550. 429. and CN600-1 samples vanished in CN600-2. In spite of the fact that the observed. 430. spectral peak was very weak, the THz spectra can be interpreted as an effect of the initial. 23.
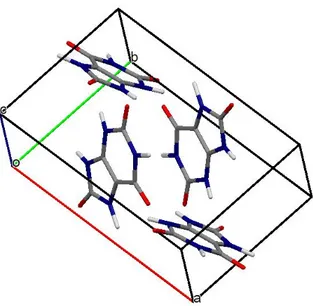
(24) 431. production of the 2D polymer, supporting its presence at an appreciable concentration in. 432. CN550 and CN600-1 samples. This conformation has a lattice mode that has been. 433. calculated at 2.28 THz and a stronger resonance at 3.23 THz (see below). The presence. 434. of this type of lattice resonances in a disordered material can contribute to the generation. 435. of a broad spectral feature similar to that observed in CN600-1, and the reduction of the. 436. attenuation can indicate a progressive condensation of the material into the 3D phase. 437. (stacking of layers) [48]. A similar transition has also been previously explained for g-. 438. C3N4 on the basis of THz-TDS measurements [49].. 439 440. 3.2. Semi-empirical quantum chemistry calculations. 441. 3.2.1. Geometry optimization. 442. Uric acid crystals are monoclinic with four molecules in a unit cell (Fig. 13), with. 443. parameters a=14.464 Å, b=7.403 Å, c=6.208 Å, β=65.10o [50]. The crystal geometry. 444. was optimized with these parameters as the initial conditions using the PM6 method and. 445. periodic boundary conditions. The computational period spanned 1×2×3 crystal unit. 446. cells in the a, b, and c directions, respectively, in order to fulfill the accuracy. 447. requirements of MOPAC calculations [51] .. 448. The crystal parameters of the geometry optimized with the PM6 Hamiltonian were. 449. a=14.870 Å, b=7.307 Å, c=6.401 Å, α=89.76o, β=64.67o and γ=89.78o, very close to. 450. their actual values. In these conditions, it can be expected that the vibrations predicted in. 451. the THz range will be close to those of the measured data [45,52].. 452. 24.
(25) 453 454 455. Fig. 13. Unit cell of uric acid.. 456. Fig. 14 shows the optimized geometry corresponding to the new carbon-nitrogen,. 457. consistent with the observed elemental ratio by XPS. It consists of an alternating. 458. sequence of imidazole and naphthyridine units resulting in a material with an average. 459. formula of C5N3H2 (with atomic ratio of nitrogen to carbon of 0.6), which would be. 460. formed by condensation of uric acid molecules, as indicated in Equation 2:. 461. 2𝑛𝑛C5 H4 N4 O3 → (C10 N6 H4 )𝑛𝑛 + 2𝑛𝑛H2 O + 2𝑛𝑛NO2. (2). 462. In the polymer unit, shown in Fig. 14, the ratio of N1:N2:N3 is 1:1:1, as determined. 463. by XPS. The experimental ratio of N to C of 0.64 for the CN600-2 product, as. 464. determined by XPS, could be ascribed to the presence of a certain amount of graphitic. 465. nitrogen (a nitrogen bonded to three carbon atoms in the naphthenic ring) as a defect in. 466. the polymer chain with three N atoms in the naphthenic rings. Indeed, the N to C ratio. 467. becomes 0.6 when such graphitic nitrogen is neglected.. 25.
(26) 468. The calculations were performed with the PM6 Hamiltonian and periodic boundary. 469. conditions using MOPAC. The length of the polymer repeat unit was a=10.353 Å. In. 470. spite of the large polarity of imidazole, the symmetric combination of two constituents. 471. of this type in the polymer repeat unit permits to cancel out the dipole moment. PM6. 472. calculations using MOPAC assign a dipole moment of 4.083 D and 2.772x10⁻³ D to the. 473. imidazole molecule and to the monomer of the carbon-nitrogen system, respectively.. 474. Fig. 15 shows the resulting geometry for a 2D polymer obtained by the arrangement. 475. of linear chains linked by hydrogen bonds, in a similar fashion to those linking the linear. 476. polymer chains in the 2D melon system [49]. The lattice parameters for the 2D polymer. 477. were a=10.360 Å, b=6.251 Å and γ=89.25o. Both the 1D and 2D polymers would have a. 478. very good planarity.. 479. 480 481. Fig. 14. Optimized geometry for the 1D polymer using the PM6 Hamiltonian. Bond. 482. lengths (in Å) are labeled in the figure. N1, N2, and N3 correspond to the nitrogen types. 483. identified by XPS. The N1:N2:N3 ratio is 1:1:1, as determined by XPS.. 484. 26.
(27) 485. 486 487. Fig. 15. Optimized geometry for the 2D polymer using the PM6 Hamiltonian. Hydrogen. 488. bonds linking the 1D chains are shown with dotted lines. Interatomic distances are in Å.. 489 490. The optimized geometry of the 3D crystal obtained with the PM6 method is shown in. 491. Fig. 16. The corresponding lattice parameters were a=10.358 Å, b=6.280 Å, c=6.928 Å,. 492. α=85.09o, β=93.69 o and γ=89.61 o. The comparison of these results with those of the 2D. 493. geometry shows that the 3D geometry would be constituted by piled-up 2D polymer. 494. layers which would remain essentially undistorted. The inter-layer distance would be. 495. d=3.451 Å, in reasonable agreement with the experimental value.. 496. 27.
(28) 497 498. Fig. 16. Optimized geometry for the 3D arrangement obtained from the stacking of 2D. 499. polymer layers using the PM6 Hamiltonian.. 500 501. The comparison of the XRD pattern simulated from the PM6 geometry with that. 502. experimentally measured for CN600-2, using Mercury software, is shown in Fig. 17. 503. [51]. There is a small shift of the peak at 2θ=25.84o due to reflections at consecutive. 504. material stacks when compared with the corresponding signal in the XRD measurements. 505. that is consistent with the previously calculated value of d. The peak at 2θ=14.14o is also. 506. identified in the XRD measurements and can be attributed to reflection at every-other. 507. layer. This is a characteristic feature (with varying relative intensity) of related ABAB. 508. stacked carbon-nitrogen materials [49].. 509. 28.
(29) 510 511. Fig. 17. Simulated X-ray powder diffraction pattern for the geometry optimized with the. 512. PM6 Hamiltonian shown in Fig. 16 (solid line) and experimental pattern for CN600-2. 513. sample (dotted line).. 514 515. The total energies per C10H4N6 unit of the 1D polymer, 2D polymer and 3D crystal. 516. for the geometries optimized with the PM6 Hamiltonian were -2353.83538 eV, -. 517. 2354.07442 eV, and -2354.19016 eV, respectively, thus indicating that the condensation. 518. sequence from the 1D to the 2D and, from there, to the 3D phase would be an. 519. energetically favorable process.. 520 521. 3.2.2. Vibrational analysis. 522. As discussed above, the study of periodic structures using MOPAC requires an extended. 523. computational period spanning several crystal cells such that the size is sufficient for an. 524. accurate calculation [52]. This has the effect that the calculated frequencies are not. 525. limited to those fulfilling the condition k≈0 that permits the conservation of total. 526. momentum in the interaction with photons and that, therefore, are relevant for the. 527. absorption spectrum. Thus, a requirement in the interpretation of the MOPAC. 29.
(30) 528. calculations of vibration modes in periodic systems is the selection of the relevant. 529. vibrations from the whole set of calculated modes [45,53].. 530. All the optimized geometries in this study corresponded to true ground states, except. 531. for the 3D system depicted in Fig. 16, for which it was not possible to obtain a geometry. 532. free from imaginary frequency vibrations.. 533 534. All the plots of displacements of vibration modes were produced with Gabedit [54]. In each case, the atomic displacements were scaled to facilitate their visualization.. 535. The atomic displacements associated to the main resonance of uric acid in the THz. 536. band are shown in Fig. 18. This mode was calculated at 1.41 THz, in excellent. 537. accordance with the THz-TDS measurements, as expected from the good. 538. correspondence between the calculated and experimental crystal parameters.. 539. 540 541. Fig. 18. Atomic displacements for the main vibration mode in the THz band calculated. 542. at 1.41 THz with the PM6 method using MOPAC.. 30.
(31) 543. 544 545. Fig. 19. Atomic displacements for the lowest k=0 vibration modes of the 1D (left) and. 546. 2D (right) polymers. The calculated vibration frequencies f and relative values of. 547. transition dipoles I are annotated in the plot.. 548 549. Fig. 19 displays the lowest k≈0 vibration mode calculated for the 1D (left) and 2D. 550. (right) polymers in the spectral region ranging from 0 up to 6 THz. The side by side. 551. comparison of the plots shows that there exists a direct correspondence between the. 552. vibration modes of the 1D and 2D polymers, even though some differences in the. 31.
(32) 553. resonance frequencies and relative intensities can be appreciated. The main vibrations in. 554. this band correspond to modes b and d in Fig. 19, at 3.15 THz (3.23 THz) and 3.90 THz. 555. (4.51 THz) for the 1D (2D) carbon-nitrogen polymer, respectively.. 556. As commented above, these vibrations may play a key role in the interpretation of the. 557. THz-TDS measurements for labeling the changes in the material morphology for. 558. different processing conditions.. 559 560. 3.2.3. Band gap calculation. 561. Whether a polymer has a direct or indirect band gap can often be predicted from the. 562. nodal pseudo-symmetries of the HOMO and LUMO of the constituent monomer at the. 563. connecting atomic sites [55]. In this case, such a simple approach is not possible because. 564. the monomer HOMO is a non-bonding orbital with nulls at the connecting sites. The. 565. electronic band structure calculated using MOPAC, depicted in Fig. 20(a), shows a. 566. direct band gap at the edge of the Brillouin zone. Also, the very low dispersive character. 567. of the valence band, consistent with the properties of the HOMO, can be appreciated.. 568. Besides, the stacking along the c axis, can produce the appearance of an indirect band. 569. gap in the 3D conformation [55].. 570. Even though solid-state MNDO calculations provide a good qualitative description of. 571. the band structure of materials, the quantitative estimates of the band gap can be largely. 572. biased, in contrast with the high predictive power of vibrational resonances of this type. 573. of methods. On the other hand, the bandgap of a polymer can be estimated with good. 574. accuracy using the INDO/S with configuration interaction singles (CIS) [56] by the. 575. extrapolation of the first excited state obtained for finite size oligomers as the chain. 576. length n grows [57]. The periodic 1D geometry optimized with the PM6 method. 577. implemented in MOPAC was used to generate oligomer geometries of several orders.. 32.
(33) 578. The energy of the first excited state in each case was calculated using the INDO/S-CIS. 579. method, implemented in the ORCA software package [58,59]. The results for the. 580. calculated energies for the n-mers are shown in Fig. 20(b) as a function of the inverse. 581. chain length 1/n, together with their corresponding least squares linear fit, which permits. 582. to extrapolate the value of Eg as 2.35 eV. This is in very good agreement with the. 583. experimental measurements.. 584. 585 586. Fig. 20. (a) Band structure of the 1D polymer calculated using MOPAC. The Fermi level. 587. is indicated with a dashed line. (b) Energies for the n-mers calculated with INDO/S-CIS. 588. as a function of the inverse chain length 1/n, together with their corresponding least. 589. squares linear fit.. 590 591. 4. Conclusions. 592. A new 2D carbon-nitrogen material was synthesized by pyrolysis of uric acid. The. 593. experimental results, obtained through XPS and vibrational spectroscopies, and the. 594. quantum chemistry simulations suggest that it would consist of a polymer containing. 595. imidazole-like and pyridine (naphthyridine)-like units, held together by a network of. 33.
(34) 596. hydrogen bonds. This organic semiconductor exhibits characteristics which substantially. 597. differ from those of g-C3N4, and can be regarded as one of the upper-limit cases of. 598. nitrogen-doped graphite (graphene), featuring an atomic ratio of nitrogen to carbon close. 599. to 0.6, corresponding to a formula of C5N3. The experimental ratio was 0.64 because of. 600. the presence of a certain amount of graphitic nitrogen as a defect in the polymer chain.. 601. The amount of this type of 3-coordinated nitrogen (possibly belonging to amorphous. 602. CNx species) increased in the samples synthesized at 600 °C, and can be subject of. 603. further studies. Its direct optical band gap ranged from 2.10 to 2.32 eV, depending on. 604. the polycondensation temperature, very close to the experimental value of 2.35 eV. 605. obtained from semiempirical calculations. This band gap is lower than that of g-C3N4,. 606. allowing this new material to absorb more visible light to be used as a photocatalyst. A. 607. good correspondence between experimental and calculated values was also attained for. 608. the interplanar distance (ca. 3.31 Å), which was consistent with a topotactic. 609. transformation, and for the THz-TDS spectroscopy spectra, which showed a behavior. 610. similar to that of amorphous 2D carbons, with non-interacting layer planes.. 611 612. References. 613. [1]. 614 615. M.L. Cohen, Calculation of bulk moduli of diamond and zinc-blende solids, Phys. Rev. B 32(12) (1985) 7988-7991.. [2]. A.Y. Liu, M.L. Cohen, Structural properties and electronic structure of low-. 616. compressibility materials: β-Si3N4and hypothetical β-C3N4, Phys. Rev. B 41(15). 617. (1990) 10727-10734.. 618. [3]. X. Li, J. Zhang, L. Shen, Y. Ma, W. Lei, Q. Cui, et al., Preparation and. 619. characterization of graphitic carbon nitride through pyrolysis of melamine, Appl.. 620. Phys. A 94(2) (2008) 387-392.. 34.
(35) 621. [4]. Y. Zhao, Z. Liu, W. Chu, L. Song, Z. Zhang, D. Yu, et al., Large-Scale Synthesis. 622. of Nitrogen-Rich Carbon Nitride Microfibers by Using Graphitic Carbon Nitride. 623. as Precursor, Adv. Mater. 20(9) (2008) 1777-1781.. 624. [5]. R.C. Dante, J. Martín-Gil, L. Pallavidino, F. Geobaldo, Synthesis under Pressure. 625. of Potential Precursors of CNx Materials Based on Melamine and Phenolic Resins,. 626. J. Macromol. Sci., Part B: Phys. 49(2) (2010) 371-382.. 627. [6]. G. Zhang, M. Zhang, X. Ye, X. Qiu, S. Lin, X. Wang, Iodine Modified Carbon. 628. Nitride Semiconductors as Visible Light Photocatalysts for Hydrogen Evolution,. 629. Adv. Mater. 26(5) (2014) 805-809.. 630. [7]. J. Zhang, J. Sun, K. Maeda, K. Domen, P. Liu, M. Antonietti, et al., Sulfur-. 631. mediated synthesis of carbon nitride: Band-gap engineering and improved. 632. functions for photocatalysis, Energy Environm. Sci. 4(3) (2011) 675.. 633. [8]. Y. Zhang, X. Bo, A. Nsabimana, C. Luhana, G. Wang, H. Wang, et al., Fabrication. 634. of 2D ordered mesoporous carbon nitride and its use as electrochemical sensing. 635. platform for H2O2, nitrobenzene, and NADH detection, Biosens. Bioelectron. 53. 636. (2014) 250-256.. 637. [9]. Y. Zhang, T. Mori, J. Ye, Polymeric Carbon Nitrides: Semiconducting Properties. 638. and Emerging Applications in Photocatalysis and Photoelectrochemical Energy. 639. Conversion, Sci. Adv. Mater. 4(2) (2012) 282-291.. 640. [10] Y. Zhang, Z. Schnepp, J. Cao, S. Ouyang, Y. Li, J. Ye, et al., Biopolymer-. 641. Activated Graphitic Carbon Nitride towards a Sustainable Photocathode Material,. 642. Sci. Rep. 3 (2013).. 643. [11] A. Vinu, K. Ariga, T. Mori, T. Nakanishi, S. Hishita, D. Golberg, et al.,. 644. Preparation and Characterization of Well-Ordered Hexagonal Mesoporous Carbon. 645. Nitride, Adv. Mater. 17(13) (2005) 1648-1652.. 35.
(36) 646. [12] H. Zhao, M. Lei, X.a. Yang, J. Jian, X. Chen, Route to GaN and VN Assisted by. 647. Carbothermal Reduction Process, J. Am. Chem. Soc. 127(45) (2005) 15722-. 648. 15723.. 649 650. [13] J.L. Zimmerman, R. Williams, V.N. Khabashesku, J.L. Margrave, Synthesis of Spherical Carbon Nitride Nanostructures, Nano Lett. 1(12) (2001) 731-734.. 651. [14] C. Cao, F. Huang, C. Cao, J. Li, H. Zhu, Synthesis of Carbon Nitride Nanotubes. 652. via a Catalytic-Assembly Solvothermal Route, Chem. Mater. 16(25) (2004) 5213-. 653. 5215.. 654. [15] A. Thomas, A. Fischer, F. Goettmann, M. Antonietti, J.-O. Müller, R. Schlögl, et. 655. al., Graphitic carbon nitride materials: variation of structure and morphology and. 656. their use as metal-free catalysts, J. Mater. Chem. 18(41) (2008) 4893.. 657. [16] D. Wei, Y. Liu, Y. Wang, H. Zhang, L. Huang, G. Yu, Synthesis of N-Doped. 658. Graphene by Chemical Vapor Deposition and Its Electrical Properties, Nano Lett.. 659. 9(5) (2009) 1752-1758.. 660. [17] J. Mahmood, E.K. Lee, M. Jung, D. Shin, I.-Y. Jeon, S.-M. Jung, et al.,. 661. Nitrogenated holey two-dimensional structures, Nat. Commun. 6 (2015) 6486.. 662. [18] H. Wang, X. Li, J. Yang, The g-C3N4/C2N Nanocomposite: A g-C3N4-Based. 663. Water-Splitting Photocatalyst with Enhanced Energy Efficiency, ChemPhysChem. 664. 17(13) (2016) 2100-2104.. 665. [19] N. Fechler, N.P. Zussblatt, R. Rothe, R. Schlögl, M.-G. Willinger, B.F. Chmelka,. 666. et al., Eutectic Syntheses of Graphitic Carbon with High Pyrazinic Nitrogen. 667. Content, Adv. Mater. 28(6) (2016) 1287-1294.. 668. [20] C. Goel, H. Bhunia, P.K. Bajpai, Mesoporous carbon adsorbents from melamine–. 669. formaldehyde resin using nanocasting technique for CO2 adsorption, J. Environ.. 670. Sci. 32 (2015) 238-248.. 36.
(37) 671. [21] Y. Wu, Y. Li, S. Gardner, B.S. Ong, Indolo[3,2-b]carbazole-Based Thin-Film. 672. Transistors with High Mobility and Stability, J. Am. Chem. Soc. 127(2) (2005). 673. 614-618.. 674. [22] P.-L.T. Boudreault, S. Wakim, N. Blouin, M. Simard, C. Tessier, Y. Tao, et al.,. 675. Synthesis,. Characterization,. and. Application. of. Indolo[3,2-b]carbazole. 676. Semiconductors, J. Am. Chem. Soc. 129(29) (2007) 9125-9136.. 677. [23] M. Akimoto, T. Kawano, Y. Iwasawa, Y. Takahashi, K. Yamashita, M.. 678. Kawamoto, et al., Syntheses and properties of copolymers containing. 679. indolocarbazole moiety in the side chain, Polym. J. 43(12) (2011) 959-965.. 680. [24] J. Tauc, R. Grigorovici, A. Vancu, Optical Properties and Electronic Structure of. 681. Amorphous Germanium, Physica Status Solidi B: Basic Solid State Physics 15(2). 682. (1966) 627-637.. 683 684. [25] J. Tauc, Optical properties and electronic structure of amorphous Ge and Si, Mater. Res. Bull. 3(1) (1968) 37-46.. 685. [26] L. Duvillaret, F. Garet, J.L. Coutaz, A reliable method for extraction of material. 686. parameters in terahertz time-domain spectroscopy, IEEE J. Sel. Top. Quantum. 687. Electron. 2(3) (1996) 739-746.. 688. [27] J. Vázquez-Cabo, P. Chamorro-Posada, F.J. Fraile-Peláez, Ó. Rubiños-López, J.M.. 689. López-Santos, P. Martín-Ramos, Windowing of THz time-domain spectroscopy. 690. signals: A study based on lactose, Opt. Commun. 366 (2016) 386-396.. 691. [28] J.J.P. Stewart, Optimization of parameters for semiempirical methods V:. 692. Modification of NDDO approximations and application to 70 elements, J. Mol.. 693. Model. 13(12) (2007) 1173-1213.. 694. [29] J.D.C. Maia, G.A. Urquiza Carvalho, C.P. Mangueira, S.R. Santana, L.A.F.. 695. Cabral, G.B. Rocha, GPU Linear Algebra Libraries and GPGPU Programming for. 37.
(38) 696. Accelerating MOPAC Semiempirical Quantum Chemistry Calculations, J. Chem.. 697. Theory Comput. 8(9) (2012) 3072-3081.. 698 699. [30] J.J.P. Stewart, MOPAC2012, Stewart Computational Chemistry, Colorado Springs, CO, USA, 2012.. 700. [31] Y. Zhang, Z. Sun, H. Wang, Y. Wang, M. Liang, S. Xue, Nitrogen-doped. 701. graphene as a cathode material for dye-sensitized solar cells: effects of. 702. hydrothermal reaction and annealing on electrocatalytic performance, RSC Adv.. 703. 5(14) (2015) 10430-10439.. 704. [32] S. Indrawirawan, H. Sun, X. Duan, S. Wang, Low temperature combustion. 705. synthesis of nitrogen-doped graphene for metal-free catalytic oxidation, J. Mater.. 706. Chem. A 3(7) (2015) 3432-3440.. 707. [33] G. Wang, L.-T. Jia, Y. Zhu, B. Hou, D.-B. Li, Y.-H. Sun, Novel preparation of. 708. nitrogen-doped graphene in various forms with aqueous ammonia under mild. 709. conditions, RSC Adv. 2(30) (2012) 11249.. 710 711. [34] J. Liu, H. Wang, M. Antonietti, Graphitic carbon nitride "reloaded'': emerging applications beyond (photo)catalysis, Chem. Soc. Rev. 45(8) (2016) 2308-2326.. 712. [35] L.T. Soo, K.S. Loh, A.B. Mohamad, W.R.W. Daud, The effect of varying N/C. 713. ratios of nitrogen precursors during non-metal graphene catalyst synthesis, Int. J.. 714. Hydrogen Energy (2016).. 715. [36] T. Horibe, K. Kusaba, K. Niwa, M. Hasegawa, K. Yasuda, R. Ishigami, Molecular. 716. routes syntheses of graphite-like C–N compounds with various N/C ratios. 717. in high pressure and temperature, J. Ceram. Soc. Jpn. 124(10) (2016) 1013-1016.. 718. [37] A.P. Dementjev, A. de Graaf, M.C.M. van de Sanden, K.I. Maslakov, A.V.. 719. Naumkin, A.A. Serov, X-Ray photoelectron spectroscopy reference data for. 720. identification of the C3N4 phase in carbon–nitrogen films, Diamond Relat. Mater.. 38.
(39) 721 722. 9(11) (2000) 1904-1907. [38] D. Hulicova-Jurcakova, M. Kodama, S. Shiraishi, H. Hatori, Z.H. Zhu, G.Q. Lu,. 723. Nitrogen-Enriched. Nonporous. Carbon. Electrodes. with. 724. Supercapacitance, Adv. Funct. Mater. 19(11) (2009) 1800-1809.. Extraordinary. 725. [39] S. Kundu, T.C. Nagaiah, W. Xia, Y. Wang, S.V. Dommele, J.H. Bitter, et al.,. 726. Electrocatalytic Activity and Stability of Nitrogen-Containing Carbon Nanotubes. 727. in the Oxygen Reduction Reaction, J. Phys. Chem. C 113(32) (2009) 14302-. 728. 14310.. 729. [40] H. Liu, Y. Zhang, R. Li, X. Sun, S. Désilets, H. Abou-Rachid, et al., Structural and. 730. morphological control of aligned nitrogen-doped carbon nanotubes, Carbon 48(5). 731. (2010) 1498-1507.. 732. [41] A. Kumar, A. Ganguly, P. Papakonstantinou, Thermal stability study of nitrogen. 733. functionalities in a graphene network, J. Phys.: Condens. Matter 24(23) (2012). 734. 235503.. 735. [42] T. Sharifi, G. Hu, X. Jia, T. Wågberg, Formation of Active Sites for Oxygen. 736. Reduction Reactions by Transformation of Nitrogen Functionalities in Nitrogen-. 737. Doped Carbon Nanotubes, ACS Nano 6(10) (2012) 8904-8912.. 738. [43] M. Scardamaglia, C. Struzzi, S. Osella, N. Reckinger, J.-F. Colomer, L. Petaccia,. 739. et al., Tuning nitrogen species to control the charge carrier concentration in highly. 740. doped graphene, 2D Materials 3(1) (2016) 011001.. 741 742. [44] P.C. Upadhya, Y.C. Shen, A.G. Davies, E.H. Linfield, J. Biol. Phys. 29(2/3) (2003) 117-121.. 743. [45] P. Chamorro-Posada, Study of the terahertz spectra of crystalline materials using. 744. NDDO semi-empirical methods: polyethylene, poly (vinylidene fluoride) form II. 745. and a-D-glucose, arXiv:1604.03919 [physics.chem-ph] (2016).. 39.
(40) 746. [46] M.H. Mingxia He, J.H. Jiaguang Han, M.L. Meng Li, Z.T. Zhen Tian, Y.Y.. 747. Yanjun Yu, W.Z. Weili Zhang, Terahertz spectroscopy studies of far-infrared. 748. optical and dielectric signatures of melamine, Chin. Opt. Lett. 9(s1) (2011). 749. s10507-310509.. 750. [47] M. Walther, B.M. Fischer, P. Uhd Jepsen, Noncovalent intermolecular forces in. 751. polycrystalline and amorphous saccharides in the far infrared, Chem. Phys. 288(2-. 752. 3) (2003) 261-268.. 753. [48] P. Chamorro-Posada, J. Vázquez-Cabo, Ó. Rubiños-López, J. Martín-Gil, S.. 754. Hernández-Navarro, P. Martín-Ramos, et al., THz TDS study of several sp2. 755. carbon materials: Graphite, needle coke and graphene oxides, Carbon 98 (2016). 756. 484-490.. 757. [49] P. Chamorro-Posada, J. Vázquez-Cabo, F.M. Sánchez-Arévalo, P. Martín-Ramos,. 758. J. Martín-Gil, L.M. Navas-Gracia, et al., 2D to 3D transition of polymeric carbon. 759. nitride nanosheets, J. Solid State Chem. 219 (2014) 232-241.. 760 761. [50] H. Ringertz, The molecular and crystal structure of uric acid, Acta Crystallogr. 20(3) (1966) 397-403.. 762. [51] C.F. Macrae, P.R. Edgington, P. McCabe, E. Pidcock, G.P. Shields, R. Taylor, et. 763. al., Mercury: visualization and analysis of crystal structures, J. Appl. Crystallogr.. 764. 39(3) (2006) 453-457.. 765 766. [52] J.J.P. Stewart, Application of the PM6 method to modeling the solid state, J. Mol. Model. 14(6) (2008) 499-535.. 767. [53] P. Chamorro-Posada, I. Silva-Castro, J. Vázquez-Cabo, P. Martín-Ramos, J.M.. 768. López-Santos, J. Martín-Gil, A Study of the Far Infrared Spectrum of N-Acetyl-D-. 769. Glucosamine Using THz-TDS, FTIR, and Semiempirical Quantum Chemistry. 770. Methods, J. Spectrosc. 2016 (2016) 1-7.. 40.
(41) 771 772. [54] A.-R. Allouche, Gabedit-A graphical user interface for computational chemistry softwares, J. Comput. Chem. 32(1) (2011) 174-182.. 773. [55] D.-K. Seo, R. Hoffmann, Direct and indirect band gap types in one-dimensional. 774. conjugated or stacked organic materials, Theor. Chem. Acc. 102(1-6) (1999) 23-. 775. 32.. 776 777. [56] J. Ridley, M. Zerner, An intermediate neglect of differential overlap technique for spectroscopy: Pyrrole and the azines, Theor. Chim. Acta 32(2) (1973) 111-134.. 778. [57] P.M. Lahti, J. Obrzut, F.E. Karasz, Use of the Pariser-Parr-Pople approximation to. 779. obtain practically useful predictions for electronic spectral properties of. 780. conducting polymers, Macromolecules 20(8) (1987) 2023-2026.. 781. [58] M.C. Zerner, G.H. Loew, R.F. Kirchner, U.T. Mueller-Westerhoff, An. 782. intermediate neglect of differential overlap technique for spectroscopy of. 783. transition-metal complexes. Ferrocene, J. Am. Chem. Soc. 102(2) (1980) 589-599.. 784. [59] F. Neese, The ORCA program system, Wiley Interdiscip. Rev.: Comput. Mol. Sci.. 785. 2(1) (2012) 73-78.. 41.
(42)
Figure
+7
Documento similar
In this chapter, we investigate the emergence of discrete Landau levels in the band structure of a honeycomb lattice under the effect of a gauge field.. We first comment the basis
To link our INT I-band observations to our INT r-band ob- servations, we obtained a set of r-band out-of-transit frames on July 29, 2010, in order to measure the change in
17,18 Contrary to graphene, the band gap in ML-MDS separating the valence and conduction bands is naturally large and due to the absence of inversion symmetry in ML-MDS the
Band structure of Sb(111) films of various thicknesses. The shaded areas indicate projected bulk band regions. Reproduced with permission.. a) Optical micrograph showing up to
The ground-state band in 32 Mg, in particular the observed change in moment of inertia between the ground state and 6 + state, is well reproduced by large-scale shell-
The background is normalized to the SM expectation; the uncertainty band (shown as a hatched band in the stack plot and a green band in the ratio plot) includes statistical
Calculated energy splittings E(I )-E(I − 2) in MeV in the ground band of 44 Ti as a function of the strength of the (a) isoscalar pairing interaction and of the (b) isovector
In the Supporting Information we include density functional theory calculations of thickness dependent bandgap, density functional theory calculations of the band structure with
