Validation of an analytical method by HPLC applicable to the cuban Mangiferin
7
0
0
Texto completo
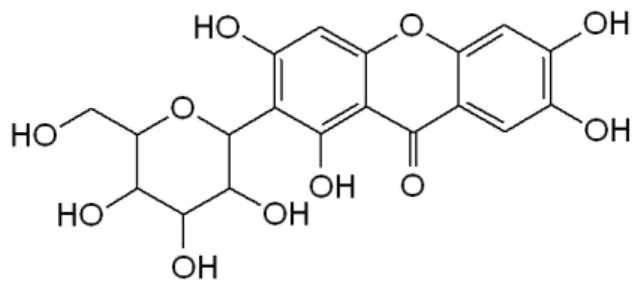
(2) García C, Felipe A, Naessens T, et al.. Conclusiones: El método usado en la cuantificación de mangiferina resultó específico, lineal, preciso, exacto y robusto y puede ser empleado en el control de la calidad y estudio de estabilidad. Palabras claves: mangiferina; métodos cromatográficos; validación.. INTRODUCTION Mango (Mangifera indica L.) is one of the most important tropical fruits worldwide in terms of production and consumer acceptance(1). This plant contains important constituents, such as proteins, saponins, tannins, carbohydrates, terpenoids, mucilage and glycosides. Among the various polyphenolic compounds found in the mango(2), mangiferin (C-2-β-D-glucopyranosyl-1,3,6,7-tetrahydroxyxanthone, also named C-glucosyl xanthone) is a distinct one (figure 1). It’s considered a heat-stable molecule and a natural pharmacologically active phytochemical that was found to have various bioactivities, such as antioxidant, antitumor, antipyretic, neuroprotective and inmunomodulatory(3)-(7), and other effects. Because of this, it is considered a potent active pharmaceutical ingredient of natural origin, for the development of pharmaceutical formulations.. The method established for the quality control of the active pharmaceutical ingredient magiferin (MgF), in Cuba, employs gradient, we proposed as objective in the present work to make modifications in the chromatographic conditions of the analytical method, with the aim of optimizing the resources available in our center. It will also facilitate a reduction for the liberation of the lots for the elution of the mangiferin at the same time of smaller retention, decrease of the costs for concept of employment of reagents. When variations are made in analytical methods, it is necessary to perform the validation of the same, in order to obtain documentary evidence of the safety and reliability of the results offered by the new method, set by the State Center for Drug Control (CECMED), Cuba(8). It is also necessary to make statistical comparisons between the results obtained by both methods to demonstrate if there are significant differences between the results obtained. MATERIALS AND METHODS Reagents and materials Mangiferin standard was donated by the Center of Pharmaceutical Chemistry and certified by the CECMED, the HPLC purity of the reference material was 93.8%. The sample was obtained in the same center. The reagents used were of analytical grade (MERCK, Germany). Procedures. Figure 1: Chemical structure of mangiferin. In table 1, we report the chromatographic conditions of each method, the established and the new.. Table 1: Chromatographic conditions. Terms. Methods New. Established. 0.01 M potassium dihydrogen orthophosphate, pH 2.7 ± 0.2. A: acetic acid 0.2% and acetonitrile (85:15) B: acetonitrile. mode. Isocratic. Gradients 18 min -100 % A 20 min – 20 % A 22 min – 100 % A. columns. GraceSmart RP -18 (150 mm x 4.6 mm i.d., 5μm particle size), GraceSmart. Luna C-18 (150 mm x 4.6 mm i.d., 5μm particle size), Phenomenex. flow. 1 mL/min. absorbance. 254 nm. equipment. Agilent Technologies, United States. mobile phase. M: molar; A: A system; B: B system; min: minutes; i.d: internal diameter. 228. Ars Pharm. 2018; 59(4): 227-233.
(3) Validation of an analytical method by HPLC applicable to the cuban Mangiferin. The buffer solutions were prepared by dissolving 1.36 g of potassium dihydrogen orthophosphate in 900mL of water, and the pH was adjusted to 2.7 ± 0.2 using dilute orthophosphoric acid. Finally, the volume was made up to 1000 mL with distilled water(9). While the 0.2% acetic acid solution was prepared by taking 2 mL of acetic acid in 1000 mL of distilled water. Preparation of standard To construct the calibration curve, a stock solution of 100 ppm of reference compound MgF was prepared in a 50% dioxane solution. A series of dilutions were subsequently carried out to obtain 1/2, 1/4, 1/8, 1/16 and 1/32, of the original concentration for the preparation of standard solutions in distilled water(10). Preparation of samples About 10 mg of Cuban’s sample MgF were accurately weighed, transferred to a 100 mL volumetric flask, and made up to volume with a mixture of dioxane: water (1:1) v/v. A 4 mL aliquot was transferred to a 25 mL volumetric flask and made up to volume with the same mixture. Validation of the analytical method Specificity In order to evaluate the specificity of the method, the chemical reference substance and the MgF Cuban’s sample and samples subjected to drastic conditions such as acid hydrolysis (HCL 1N), basic hydrolysis (1N NaOH), oxidation (H2O2), light and temperature (70oC). The test samples remained degraded for 7 days. Criteria: No signs of degradation products should be obtained in the circumvention zone of the active ingredient(8), (11)-(14) . Precision The accuracy of the method was evaluated through the repeatability, intermediate precision and reproducibility studies. Repeatability was studied based on six determinations. The mean values, the standard deviation and the coefficient of variation were determined. The intermediate precision study involved two analysts, two different days, in the same laboratory. While the reproducibility studies were carried out in two different centers, in different countries, Cuba and Belgium. Six replicates were analyzed in each case of samples equivalent to 100%. The Fisher test was used to determine if there were significant differences between the results of the analysts who. Ars Pharm. 2018; 59(4): 227-233. used the same method and between the days on which the analyzes were performed. The Student t test was used to verify if the mean values obtained between the analysts, who used the same method, and the two days on which the analyzes were performed, were homogeneous, at a 95% confidence level. Criteria: Repeatability: CV ≤ 2.0 % and RSD ≤ 3.9 %. Intermediate accuracy (calculated t must be less t tabulated, calculated F must be less F tabulated), for a confidence level of 95 %(8), (11)-(14). Accuracy In the study of accuracy, the addition of a standard to a sample was used, adding increasing amounts of the same equivalent to 25, 50, 75 % of chemical reference substance. Criteria: mean recovery between 97.0 - 103.0%, the calculated G must be less than G tabulated for a 95% confidence level(8), (11)-(14). Linearity In order to evaluate the linearity parameter, five solutions of known concentrations of the chemical reference substance corresponding to 2, 4, 8, 16 and 32 ppm were prepared. Three replicates were made for each of the five solutions prepared. Criteria: equation of the line (Y = bX + a); correlation coefficient (r ≥ 0.999); coefficient of determination (r2 ≥ 0.980); relative standard deviation of slope: Sb (rel) ≤ 2.0%; coefficient of variation of response factors: CVf ≤ 5.0%(8), (11)-(14). Robustness The robustness of the developed method was evaluated carrying out variations under some conditions of the process: proportion of the column chromatographic and different flow determining if significant differences existed when being compared with the conditions of the proposed method(8), (11)-(14). Detection and quantification limits The detection limits (LOD) and quantification (LOQ) they were calculated using the expression: k x S.D/b, where k=3 for the LOD and 10 for the LOQ, being S.D: the standard deviation of the I intercept (or white) and b the slope of the calibration curve. For they were carried out it determinations to three inferior concentrations to the linealidad curve, carrying out the estimate of the answer of the target and the one intercepts from the equivalent curve to the standard deviation of the target(8), (11)-(14).. 229.
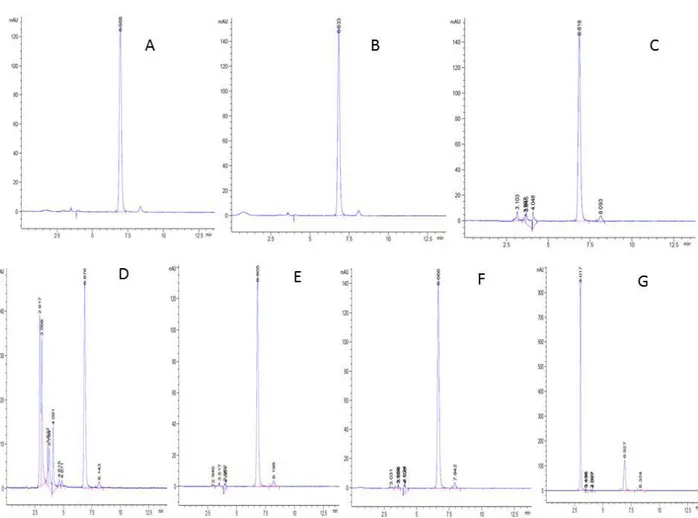
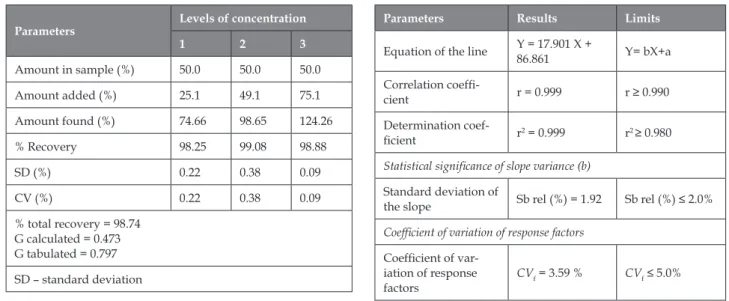
(4) García C, Felipe A, Naessens T, et al.. Statistical comparison between both methods To perform the statistical comparison, two chromatographic methods were used, reported in table 1. The means and corresponding deviations were calculated and the statistical treatment was then carried out using the Student’s test in order to determine if there were significant differences between the results obtained. Criteria: t calculated ≤ t tabulated RESULTS The chromatograms obtained from the results of the specificity study are shown in figure 2. As shown in table 2, all the results of the MgF percentage presented values very close to each other and in addition, there were no extreme concentration values very far from 100%. The results obtained in the analysis of the accuracy of the method are shown in table 3.. As can be seen in table 4, the values of the regression and determination coefficients obtained were very close to the unit, and also higher than those established in Annex I of Good Laboratory Practices of CECMED, Cuba, 2013 [8]. The value of the LOD was 10 % and that of the LOQ of 30 %. Experimentally they were checked these securities obtaining good results. In the Table 5 the results of the robustness study are shows, the values obtained from t-Student for each of the variables were lower than the tabulated value (2.20) demonstrating that there is no significant effect in the averages of values of the content of mangiferin against the changes studied. The results obtained by applying both methods were compared statistically using the Student test, the calculated statistician was 0.40. When purchasing this value with the tabulated (2.01) it was possible to appreciate that it meets the acceptance criteria previously established because the calculated t is less than the t tabulated for a 95% confidence.. Figure 2: Specificity of the method. A- Reference substance. B- sample. Sample subjected to drastic conditions: C- acid hydrolysis. Dbasic hydrolysis. E- oxidation. F- light. G- temperature.. 230. Ars Pharm. 2018; 59(4): 227-233.
(5) Validation of an analytical method by HPLC applicable to the cuban Mangiferin. Table 2: Results of the precision study Mangiferin (%) Intermediate precision Repeatability. Reproducibility. Analyst 1. Analyst 2. Cuba. Belgium. 93.96. 94.86. 95.19. 95.25. 93.04. 95.01. 94.12. 93.12. 94.96. 95.06. 94.77. 94.76. 94.37. 94.37. 93.48. 93.15. 93.02. 94.37. 93.95. 93.95. 94.02. 93.66. 92.47. 93.17. 93.95. 93.82. 93.82. 94.01. 93.59. 93.49. 93.94. 93.82. Xm = 94.37 RSD = 0.53 % CV = 0.55 %. Xm = 94.37 RSD = 0.53 % CV = 0.55 %. Xm = 94.37 RSD = 0.56 % CV = 0.55 %. Xm = 94.37 RSD = 0.83 % CV = 0.55 %. Xm = 93.53 RSD = 0.90 % CV = 0.96 %. Xm = 94.13 RSD = 0.88 % CV = 0.94 %. Xm = 94.37 RSD = 0.52 % CV = 0.55 %. Day 1. Day 2. Day 1. Day 2. 95.19. 95.19. 93.19. 95.03. 94.12. 94.12. 94.38. 94.76. 94.76. 94.37. Statistical analysis. Fischer test. F calculated (analysts) = 2.5047 F calculated (days) = 1.1886. F calculated = 2.8619. F tabulated = 5.0503. Student test. t calculated (analysts) = 0.401 t calculated (days) = 0.652. t calculated = 0.566. t tabulated = 2.015 Xm: medium value; CV: coefficient of variation; RSD: Relative standard desviation. Table 4: Results of the linearity study. Table 3: Results of the accuracy study. Parameters. Levels of concentration 1. 2. 3. Amount in sample (%). 50.0. 50.0. 50.0. Amount added (%). 25.1. 49.1. 75.1. Amount found (%). 74.66. 98.65. 124.26. % Recovery. 98.25. 99.08. 98.88. SD (%). 0.22. 0.38. 0.09. CV (%). 0.22. 0.38. 0.09. % total recovery = 98.74 G calculated = 0.473 G tabulated = 0.797 SD – standard deviation. Parameters. Results. Limits. Equation of the line. Y = 17.901 X + 86.861. Y= bX+a. Correlation coefficient. r = 0.999. r ≥ 0.990. Determination coefficient. r2 = 0.999. r2 ≥ 0.980. Statistical significance of slope variance (b) Standard deviation of the slope. Sb rel (%) = 1.92. Sb rel (%) ≤ 2.0%. Coefficient of variation of response factors Coefficient of variation of response factors. CVf = 3.59 %. CVf ≤ 5.0%. Sb rel: relative standard deviation of the slope. Ars Pharm. 2018; 59(4): 227-233. 231.
(6) García C, Felipe A, Naessens T, et al.. Table 5: Results of the robustness study Conditions. t calc GraceSmart. Columns (RP-18) (5 µm). Flow (mL/min). Lichrospher. 1.06. Lichrosorb. 1.77. 1.0 1.5. 1.95. DISCUSSION In the study of the specificity of the method, it is possible to observe the marked similarity between them as their retention times (tr) are the same for the chemical reference substance and for the MgF sample, respectively, analogous to each other. The chromatograms of samples subjected to stress conditions (C, D, E, F and G) suggest that the proposed procedure for the treatment of the samples was effective as evidences of the expected degradation of mangiferin were observed. These evidences were revealed from a significant decrease in the signal corresponding to MgF and the appearance of secondary peaks at other retention times. With the chromatograms C and D, it is shown that the peaks attributable to the degradation products of mangiferin, do not interfere in the determination of the IFA. This is because such degradation products do not elute at the same time as MgF. The results obtained evidenced the specificity of the method and the feasibility of its application in the quality control and stability study of the IFA(8), (15)-(16). This gives the data analyzed a fairly symmetrical distribution that guarantees the use of the mean in this case as a measure of reliable central tendency. The coefficient of variation eliminates the dimensionality of the variables and takes into account the ratio between the mean and the standard deviation, for this reason is a measure of variability relative to the mean. With the obtained CVs it is guaranteed that the variability of the results take place within the established limits for the chromatographic methods CV ≤ 2.0%, which shows that the method evaluated has good precision(8). Also, the relative standard deviation values obtained were within the limits established for chromatographic methods, whose limits in the active principle content are between 90.0 - 110.0% (≤ 3.9%)(17). In the studies of intermediate precision and reproducibility, the values of the Fischer and Student tests calculated were smaller than the tabulated, for a 95% probability, demonstrating that there were no significant differences between the variances and the means obtained by both analysts, on. 232. different days, or in different laboratories. The set of these results allows to assure the precision of the chromatographic method studied, so it can be affirmed with certainty that the random errors do not have significant repercussion in the evaluated method(8). The influence of the concentration factor on the variability of the precision results, when applying the Cochran test, we obtained that the calculated G was lower than the tabulated G for a probability of 0.05, k = 3 and n = 3. Therefore, the variations of the concentrations used are equivalent, which indicates that the concentration does not influence the variability of these. In the range selected in the accuracy study, the recovery percent values are within the limits established for the chromatographic methods (97.0 - 103.0%) and the values of the coefficient of variation, for each of the concentrations levels were less than 2.0%(8). The value of the coefficient of determination (r2) of 0.998 indicates that the line of linear regression achieved efficiently describes the relationship between the variables studied since the linear model fits favorably with the experimental data. The coefficient of linear regression (r) of 0.999 shows the intensity that characterizes the relationship between X and Y. The values obtained from both coefficients allow to demonstrate the existence of an adequate correlation. The values of the coefficient of variation of the response factors (CVf) and the standard deviation of the slope of the regression line (Sb rel) are below the established limit values: 5.0 and 2.0% respectively. These statisticians are considered point estimators that allow the characterization of variability. The value obtained from the coefficient of variation of the response factors indicates that there is a favorable variability in the concentration / response ratio for each level evaluated(8). The results obtained in this study demonstrate the linearity of the method by HPLC for MgF. It was demonstrated in the study of robustness that significant differences don’t exist among the securities averages with regard to the method proposed however, if variations are observed in the times of retention from the mangiferin when using different columns and different speeds of flow. For what the developed analytic method can be considered robust. For these reasons, it can be stated that the results obtained as part of the comparison between the two methods do not differ statistically, which shows that there are no significant differences between them. This study shows that the validated method can be applied indistinctly to the method established for the quality control of Cuban’s samples of. Ars Pharm. 2018; 59(4): 227-233.
(7) Validation of an analytical method by HPLC applicable to the cuban Mangiferin. MgF, since the results obtained with the use of both methods are similar. CONCLUSIONS The validated method for the active pharmaceutical ingredient MgF can be applied in quality control because it is specific, precise and linear in the range of concentrations studied. Using the method of this new method, we obtain precise results that do not differ statistically from those obtained by the method established in the Chemical Analysis Laboratory of CIDEM, Cuba. REFERENCES 1.. Food and Agriculture Organization. FAOSTAT database collections, agricultural data, food and agriculture organization of the United Nations. 2005. Available from: <http://faostat. fao.org>, accessed April 2006.. 2.. Masibo M, He Q. Major mango polyphenols and their potential significance to human health. Compr. Rev. Food Sci. Food Saf. 2008;7: 309–319. doi.org/10.1111/j.1541-4337.2008.00047.x. 3.. Kant S, Sinha SK, Prasad SK, Kumar R, Bithu BS, Sadish S. Synthesis and evaluation of novel analogues of mangiferin as potent antipyretic. Asian Pac. J. Trop. Med. 2011; 4(11): 866-9. doi.org/10.1016/S1995-7645(11)60210-1.. 4.. Choudhary R, Swarnkar P. Antioxidant activity of phenolic and flavonoid compounds in some medicinal plants of India. Nat. Prod. Res. 2011; 25(11): 1101-9. doi.org/ 10.1080/14786419.2010.498372. 5.. era indica L. leaves for their use as a source of Mangiferin. J Pharmacogn Phytochem. 2015; 7(3): 608-612. 11. Farmacopea de Estados Unidos. Formulario Nacional [USP 37/ NF 33]. Volumen (; III. The United States Pharmacopeial Convention. Rockville. MD: Twinbrook Parkway; 2015. 12. Guidance for Industry. Analytical Procedures and Methods Validation Chemistry, Manufacturing and Controls Documentation. FDA. Rockville, Maryland. Centre for Drug Evaluation and Research; 2001. 13. Bliesner DN. Validating Chromatographic Methods: A Practical Guide. NJ, USA: John Wiley & Sons, Inc; 2006. 14. Chan CC, Lam H, Lee YC, Zhang X. Analytical Method Validation and Instrument Performance Verification. Hoboken. NJ: John Wiley & Sons, Inc; 2004. 15. Curiel H, Sordo L, Vélez H. Determinación cuantitativa por electroforesis capilar de zona de mangiferina en ingrediente farmacéutico activo VIMANG®. Revista CENIC Ciencias Químicas. 2007; 38 (2): 337-343. 16. Romero JA, Nuevas-Paz L, López M, Ferradá C, Carballo C. Validación de una técnica por Cromatografía Líquida de Alta Resolución para la determinación del contenido de Mangiferina en hojas de Mangifera indica L. Revista cubana de Plantas Medicinales 2014; 19(3): versión online ISSN 1028-4796. 17. Jenke RD. Chromatographic Method Validation: A Review of Current Practices and Procedures. II. Guidelines for Primary Validation Parameters. J. Liq. Chromatogr. Relat. Technol. 1996; 19 (5): 737 – 757. doi.org/10.1080/10826079608005534. Muanza DN, Euler KL, William L, Newman DJ. Screening for antitumor and anti-HIV activities of nine medicinal plants from Zaire. Int. J. Pharmacol. 1995; 33 (2): 98-106. doi. org/10.3109/13880209509055207. 6.. Makare N, Bodhankar S, Rangari V. Immunomodulatory activity of alcoholic extract of Mangifera indica L in mice. J. Ethnopharmacol. 2001; 78 (2-3): 133-137. PMID:11694357. 7.. Gottlieb M, Leal-Campanari R, Campos MR, Sanchez M V, Alberdi E, Arranz, A. Neuroprotective by two polyphenols following excitotoxicity and experimental ischemia. Neurobiol Dis. 2006; 23 (2): 374-386. doi.org/10.1016/j.nbd.2006.03.017. 8.. Anexo I: Buenas Prácticas para Laboratorio de Control de Medicamentos. Validación de Métodos Analíticos. Centro Estatal para el Control de Medicamentos (CECMED); 2013: 3-25.. 9.. Nagaraj G, Pradeep K, Surender P, Mashru R. ICH Guidance in Practice: Validated Reversed – Phase HPLC Method for the determination of active Mangiferin from Extracts of Mangiferin Indica Linn. J Chromatogr Sci. 2010;48(2):156-160. PMID:20109296. 10. Romero JA, Vandama R, López M, Capote M, Ferradá C, Carballo C, Delgado R, VanderBerghe W, Apers S. Study of Physicochemical parameters of different cultivars of Mangif-. Ars Pharm. 2018; 59(4): 227-233. 233.
(8)
Figure

Documento similar