Evaluation of Disparity Maps
211
0
0
Texto completo
(2) -1-. Resumen El problema de visión estéreo es un problema inverso y mal planteado debido a la falta de información y la inestabilidad en el sistema. Debido a lo anterior, una pequeña perturbación en la estimación de la disparidad puede causar un gran error en el cálculo de la profundidad. Es posible encontrar en la literatura un gran número de trabajos abordando los métodos de estimación de puntos correspondientes. Por otra parte, las propuestas para evaluar cuantitativamente el comportamiento de los métodos de correspondencia estéreo sobre mediante la evaluación de mapas de disparidad son escasas. Más aun, la mayoría de dichas propuestas no tratan la estimación de disparidades como un paso intermedio en el problema de visión estéreo, desconociendo el impacto que tienen las estimaciones incorrectas en el cálculo de la profundidad. En consecuencia, podría no existir claridad en el estado-del-arte de las metodologías de evaluación, sobre cómo evaluar la precisión de los métodos de correspondencia estéreo en términos de los cálculos de profundidad. Esta tesis reporta una investigación concerniente al juzgamiento de los métodos de correspondencia estéreo, mediante la comparación de mapas de disparidad estimados contra datos de disparidad de referencia. La pregunta de investigación formulada se describe a continuación: ¿entre un conjunto dado de métodos de correspondencia estéreo a comparar, y un determinado escenario de evaluación, cuáles son los métodos que estiman correspondencias de manera más precisa permitiendo una mejor reconstrucción de la información 3D en términos de los cálculos de profundidad? En la tesis se presenta una metodología de evaluación para métodos de correspondencia estéreo. La metodología incluye un conjunto elementos y métodos interactuando en una secuencia ordenada de pasos. Los elementos de evaluación identificados abarcan un conjunto de imágenes de prueba, datos de disparidad de referencia y criterios de evaluación; mientras que los métodos de evaluación abarcan tanto medidas de evaluación, como modelos de evaluación. Un conjunto innovador de elementos y métodos es propuesto con el propósito de abordar la pregunta de Evaluation of Disparity Maps.
(3) -2-. investigación formulada. Las contribuciones del trabajo de investigación se sintetizan a continuación: . Se propone un fundamento teórico para los criterios de evaluación con el propósito de permitir una adecuada asociación entre el cálculo de errores y las áreas en las cuales estos se encuentran.. . Se diseñan dos medidas de evaluación que consideran tanto la magnitud del error de estimación como la relación inversa entre disparidad y profundidad.. . Se presenta una caracterización de las medidas de evaluación.. . Se presenta un modelo evaluación que aborda la comparación de métodos de correspondencia estéreo como un problema de optimización incluyendo múltiples objetivos. El modelo propuesto se basa en el concepto de dominancia de Pareto, e incluye una formulación para la interpretación de resultados. Las propuestas son validadas en una plataforma disponible en línea, y. ejemplificando su impacto sobre los resultados obtenidos mediante el proceso de evaluación, así como su relevancia con la pregunta de investigación formulada.. Palabras Clave: visión estéreo, puntos correspondientes, métodos de correspondencia estéreo, estimación de mapas de disparidad, metodologías de evaluación.. Evaluation of Disparity Maps.
(4) -3-. Abstract The stereo vision problem is an inverse and ill-posed problem due to the lack of information and system instability. Thus a small perturbation in an estimated disparity may cause a large error on the calculated depth value. In contrast to the plethora of stereo methods that have been proposed for decades, and are available in the literature, the approaches for quantitatively assessing the behaviour of stereo correspondence methods, by evaluating estimated disparity maps are not so many. Moreover, most of them do not consider disparity estimation as an intermediate step in the stereo vision problem, ignoring the impact of mismatches on depth calculations. Consequently, it may be still not clear in the state-of-the-art on evaluation methodologies, how to assess the accuracy of stereo correspondence methods in terms of depth calculations. This thesis reports research work concerning the assessing of stereo correspondence methods, by evaluating estimated disparity maps against disparity ground-truth data. The formulated research question is as follows: Which are the method or methods accurately matching corresponding points, in order to allow a better 3D information recovery in terms of depth calculations, among a set of stereo correspondence methods being compared, under an specific evaluation scenario?. In the thesis, an evaluation methodology for stereo correspondence methods is proposed. The methodology involves a set of elements and methods interacting in an ordered sequence of steps. Considered evaluation elements include stereo imagery testbed, disparity ground-truth data, and evaluation criteria, whilst evaluation methods involve evaluation measures, and evaluation models. A set of innovative evaluation elements and methods are presented in order to tackle the formulated research question. In particular, the contributions of the research work can be briefly listed as follows: . A theoretical foundation for evaluation criteria is proposed in order to allow a proper relation between gathered errors, and challenging stereo image phenomena.. Evaluation of Disparity Maps.
(5) -4-. . Two evaluation measures, considering disparity estimation errors magnitude, as well as the inverse relation between depth and disparity, are devised.. . A characterisation of evaluation measures is introduced.. . An evaluation model based on the Pareto dominance relation, addressing the comparison of stereo correspondence methods as a multiobjective optimisation problem, and considering a formal interpretation of evaluation results, is proposed. The proposals are validated using a developed on-line evaluation framework.. The framework allows an interactive selection of evaluation elements and methods, exemplifying the impact of this selection, into evaluation results, as well as their relevance with the formulated research question.. Evaluation of Disparity Maps.
(6) -5-. Declaration. I hereby declare that I am the author of this thesis, and conducted the research to which it refers. The cited references have been consulted by me. Any idea or quotation from the work and research of a third person are fully acknowledged in accordance with the standard referencing practice of the discipline. No portion of the work referred to in this thesis has been submitted in support of an application for another degree or qualification of any other university or other institution of learning.. Signed by Ivan M. Cabezas T.. Evaluation of Disparity Maps.
(7) -6-. Acknowledgments / Agradecimientos I would like to manifest my gratitude and sincere thanks to many people. I have a debt with some of them that I will be paying, day after day, not only with my performance but also by trying to advise and encourage many others. To Maria Patricia Trujillo Uribe, my restless supervisor for teaching me by her example, not only about computer vision, but also on ethic and commitment for hard working, for caring about others, and for being a role model. To Professor Panos Liatsis for sharing with me his knowledge and expertise, his advice and encouragement, as well as his sincere opinion and point of view on several topics. To the entire staff of the Multimedia and Vision Laboratory, at the Universidad del Valle for allowing me to learn with and from them in a nice and friendly work environment. To my father, my brother, and my sister, for their endless love and support. To my nephews for being the ambassadors of the coming generations. To Ruth and Antonio for caring about me as a son. To Ruth Margaret, the other half of myself for being always supportive, enthusiastic, clever, and pragmatic. Moreover, for being my shelter, my friend, my truthful and beloved companion in this valley of shadows, laughs, happiness and tears.. I would like to dedicate this work to my mother and into her memory.. Ivan Mauricio Cabezas Troyano. Evaluation of Disparity Maps.
(8) -7-. Contents CHAPTER 1.. INTRODUCTION ..............................................................................................15. 1.1 RESEARCH PROBLEM AND MOTIVATION ..............................................................................15 1.2 INVESTIGATED APPROACH ...................................................................................................18 1.3 DATA USED IN THE THESIS ..................................................................................................22 1.4 CONTRIBUTIONS ...................................................................................................................25 1.5 SUMMARY OF THE CANDIDATE’S ACTIVITIES .......................................................................26 1.6 THESIS OUTLINE...................................................................................................................27 CHAPTER 2.. THEORETICAL BACKGROUND ..................................................................29. 2.1 IMAGE FORMATION PROCESS ..............................................................................................29 2.1.1 Geometrical Models in Imagery ...............................................................................30 2.1.2 Radiometric Models ...................................................................................................36 2.1.3 Digitising Models ........................................................................................................37 2.2 STEREO CORRESPONDENCE ...............................................................................................38 2.2.1 Stereo Correspondence Problem ............................................................................39 2.2.2 Disparity Estimation ...................................................................................................40 2.2.3 Stereo Constraints .....................................................................................................40 2.3 3D RECONSTRUCTION .........................................................................................................44 2.3.1 Projective Reconstruction .........................................................................................44 2.3.2 Affine Reconstruction ................................................................................................45 2.3.3 Metric Reconstruction................................................................................................45 2.4 DISTANCE FUNCTIONS .........................................................................................................46 2.4.1 Dissimilarity Functions ..............................................................................................47 2.4.2 Correlation and Similarity Functions .......................................................................50 2.4.3 Non-parametric Distance Functions ........................................................................52 2.5 MULTI-OBJECTIVE OPTIMISATION ........................................................................................53 2.6 CHAPTER SUMMARY ............................................................................................................56 CHAPTER 3.. LITERATURE REVIEW ...................................................................................57. 3.1 CLASSIFICATION OF STEREO CORRESPONDENCE METHODS .............................................57 3.2 STEREO CORRESPONDENCE METHODS FOR A SEARCH IN 2D ..........................................58. Evaluation of Disparity Maps.
(9) -8-. 3.2.1 Corner Detectors ........................................................................................................60 3.2.2 Feature Points Descriptors .......................................................................................66 3.3 STEREO CORRESPONDENCE METHODS FOR A SEARCH IN 1D ...........................................68 3.3.1 Local Methods ............................................................................................................69 3.3.2 Global Methods ..........................................................................................................80 3.4 PRE AND POST-PROCESSING PROCEDURES RELATED TO STEREO CORRESPONDENCE ..85 3.4.1 Pre-processing Procedures ......................................................................................85 3.4.2 Post-processing Procedures ....................................................................................86 3.5 STEREO CORRESPONDENCE EVALUATION METHODOLOGIES ............................................88 3.5.1 Evaluation without Disparity Ground-truth Data ....................................................89 3.5.2 Evaluation Based on Disparity Ground-truth Data ................................................91 3.6 DECISION MAKING IN MULTIOBJECTIVE OPTIMISATION PROBLEMS ..................................108 3.7 CHAPTER SUMMARY ..........................................................................................................110 CHAPTER 4.. EVALUATION OF DISPARITY MAPS........................................................111. 4.1 AN EVALUATION METHODOLOGY FOR DISPARITY MAPS ..................................................111 4.2 A REVIEW ON EVALUATION METHODOLOGIES AVAILABLE IN THE LITERATURE ...............114 4.2.1 Imagery Test-bed .....................................................................................................115 4.2.2 Evaluation Criteria ...................................................................................................115 4.2.3 Measures for Comparing Estimated Maps against Ground-truth Data ............117 4.2.4 Evaluation Model and Interpretation of Results ..................................................119 4.2.5 Lack of Flexibility ......................................................................................................121 4.3 PROPOSAL ON EVALUATION ELEMENTS AND METHODS ...................................................121 4.3.1 Evaluation Criteria ...................................................................................................122 4.3.2 Comparing Estimated Maps against Ground-truth Data ....................................127 4.3.3 Evaluation Model and Interpretation of Results ..................................................133 4.4 CHAPTER SUMMARY ..........................................................................................................137 CHAPTER 5.. EXPERIMENTAL EVALUATION .................................................................139. 5.1 AN ADAPTIVE AND INTERACTIVE EVALUATION FRAMEWORK ............................................139 5.2 NEAR REAL-TIME, REAL-TIME, AND GPU BASED STEREO METHODS COMPARISON......142 5.2.1 Selection of Evaluation Criteria ..............................................................................142 5.2.2 Selection of Evaluation Measures .........................................................................151 5.2.3 Selection of the Evaluation Model .........................................................................156 5.2.4 Evaluation in a Combination of Proposed Elements and Methods ..................158 5.3 EVALUATION OF STEREO METHODS IN OCCLUDED AREAS ..............................................161 5.3.1 Selection of Evaluation Elements and Methods ..................................................161. Evaluation of Disparity Maps.
(10) -9-. 5.4 EVALUATION OF METHODS IN NEAR AND FAR FROM DEPTH DISCONTINUITIES AREAS ...164 5.4.1 Selection of Evaluation Elements and Methods ..................................................164 5.5 CHAPTER SUMMARY ..........................................................................................................169 CHAPTER 6.. FINAL REMARKS AND FUTURE WORK .................................................170. 6.1 DISCUSSION .......................................................................................................................170 6.2 REMARKS ON OBTAINED EVALUATION RESULTS ..............................................................171 6.3 SUMMARY OF CONTRIBUTIONS ..........................................................................................172 6.4 FUTURE W ORK ...................................................................................................................174. Evaluation of Disparity Maps.
(11) - 10 -. Figures Figure 1-1 Stereo correspondence method. ...........................................................................................16 Figure 1-2 Estimated Disparity Maps for Tsukuba Image. ...................................................................19 Figure 1-3 Steps involved in an evaluation methodology for stero correspondence methods. ......22 Figure 1-4 Middlebury Benchmark dataset. ............................................................................................23 Figure 1-5 Generation of Disparity Ground-truth data. .........................................................................24 Figure 2-1 Pinhole camera. .......................................................................................................................31 Figure 2-2 Pinhole camera model. ...........................................................................................................32 Figure 2-3 - Light convergence in a thin lens camera model. ..............................................................33 Figure 2-4 Relation between the camera and the world coordinate system. .....................................35 Figure 2-5 Relation between the camera and the world coordinate system. .....................................36 Figure 2-6 Epipolar constraint in a convergent camera model. ...........................................................41 Figure 2-7 Epipolar constraint in a canonical stereo camera model. ..................................................43 Figure 2-8 Image comparison under the full reference approach. ......................................................46 Figure 2-9 Different Image distortion showing the same MSE score (Wang et al., 2002). ..............49 Figure 2-10 A MOP evaluation function mapping between the decision and the objective space. 54 Figure 2-11 Objective function space in a two criteria problem. ..........................................................55 Figure 3-1 USAN structure for corner detection. ....................................................................................64 Figure 3-2 Illustration of the distortions and inaccuracies generated in conventional stereo local methods: (a) Tsukuba left view, (b) ground truth disparity map, and estimated disparity maps with windows sizes of (c) 3x3, (d) 5x5, (e) 17x17 (f) 21x21. ........................................................................70 Figure 3-3 Asymmetric windows a) distribution of windows in relation to the point of interest, b) conflictive vs. convenient location of windows in relation to depth discontinuities. ..........................71 Figure 3-4 Artefacts in estimated maps using the SMW stereo method. ...........................................71 Figure 3-5 Adaptation of weights: (b) and (e) in (Yoon & Keon, 2005), (c) and (f) in (Hosni et al., 2009).............................................................................................................................................................74 Figure 3-6 Bidirectional constraint applied to points in the background of a scene. .........................87 Figure 3-7 Illustration of average error and percentage of errors, respectively, according to disparity values (Hsieh et al., 1992). .......................................................................................................93 Figure 3-8 Masks associated to evaluation criteria of the Tsukuba image: (a) all, (b) nonocc, and (c) disc. .........................................................................................................................................................95. Evaluation of Disparity Maps.
(12) - 11 -. Figure 4-1 Steps for an Evaluation Methodology. ................................................................................112 Figure 4-2 Relation among conventionally used error criteria. ..........................................................116 Figure 4-3 Conventional Evaluation criteria for Teddy image. ...........................................................117 Figure 4-4 Variation on location accuracy estimation according to depth on a commercial stereo camera system (PtGrey, 2012). ..............................................................................................................118 Figure 4-5 Illustration of the Relation between disparity estimation errors and triangulation errors: (a) a small estimation error of a farther point, (b) a large estimation error of a farther point, (c) a small estimation error of a close point, and (d) a large estimation error of a close point. .............119 Figure 4-6 Illustration of the steps followed in the Middlebury’s evaluation methodology. ............120 Figure 4-7 Illustration of the evaluation interior, boundary, and occluded criteria using the Teddy left view. .....................................................................................................................................................124 Figure 4-8 Illustration of the relation among the interior, boundary, and occluded criteria, as partition sets. .............................................................................................................................................125 Figure 4-9Depth related evaluation criteria of the Teddy stereo image: (a) near, (b) mid, and (c) far. ...............................................................................................................................................................126 Figure 4-10 Depth related evaluation criteria of the Cones stereo image: (a) near, (b) mid, and (c) far. ...............................................................................................................................................................126 Figure 5-1 Screen shot of the on-line evaluation framework: selection of imagery test-bed.........140 Figure 5-2 Screen shot of the on-line evaluation framework: selection of evaluation criteria. ......140 Figure 5-3 Screen shot of the on-line evaluation framework: selection of evaluation measures. 140 Figure 5-4 Screen shot of the on-line evaluation framework: selection of stereo methods. ..........141 Figure 5-5 Screen shot of the on-line evaluation framework: selection of the evaluation model. 141 Figure 5-6 – Screen shot of the on-line evaluation framework: obtained evaluation results. ........141 Figure 5-7 Intermediate computed values of function u2 for the methods composing the Group 1 shown in Table 5-20. ................................................................................................................................160 Figure 5-8 Intermediate computed values of function u2 for the CostFilter method. ......................161 Figure 5-9 - Compendium of evaluation results obtained for diverse setreo methods of results162 Figure 5-10 Composition of groups for the comparison of stereo methods under the interior and boundary criteria, using the A*Groups model. ......................................................................................165 Figure 5-11 Intermediate computed values of function u2 for the methods composing the group 1 shown in Table 5-25. ................................................................................................................................167 Figure 5-12 Intermediate computed values of function u2 for the method DoubleBP. ...................167. Evaluation of Disparity Maps.
(13) - 12 -. Tables Table 4-1 Ambiguous counting of error using conventional criteria. ................................................117 Table 4-2 Properties of evaluation measures for comparing estimated maps against disparity ground-truth data. .....................................................................................................................................130 Table 4-3 Contradictories Evaluation Scores Obtained by Selected Stereo Correspondence Methods According to Different Evaluation Measures ........................................................................131 Table 5-1 Selected stereo methods of near real-time and real-time performance .........................142 Table 5-2 Evaluation results by Middlebury’s methodology stereo methods of near real-time and real-time performance. .............................................................................................................................143 Table 5-3 Quantity of badly matched pixels for the Tsukuba image estimated by selected methods of near real-time and real-time performance ........................................................................144 Table 5-4 Quantity of badly matched pixels for the Venus image estimated by selected methods of near real-time and real-time performance ........................................................................................144 Table 5-5 Quantity of badly matched pixels for the Teddy image estimated by selected methods of near real-time and real-time performance ........................................................................................145 Table 5-6 Quantity of badly matched pixels for the Cones image estimated by selected methods of near real-time and real-time performance ........................................................................................146 Table 5-7 Evaluation of selected methods of near real-time and real-time performance under the proposed criteria and using Middlebury’s evaluation model ..............................................................148 Table 5-8 Evaluation of selected methods of near real-time and real-time performance under interior and boundary criteria, using Middlebury’s evaluation model ................................................149 Table 5-9 Evaluation of selected methods of near real-time and real-time performance under interior criterion, using BMP measure and Middlebury’s evaluation model .....................................150 Table 5-10 Evaluation of selected methods of near real-time and real-time performance under boundary criterion, using BMP measure and Middlebury’s evaluation model .................................150 Table 5-11 Evaluation of selected methods of near real-time and real-time performance under all criterion, using BMP measure and Middlebury’s evaluation model ...................................................151 Table 5-12 Evaluation of selected methods of near real-time and real-time performance under all criterion by combining the MSE and the BMP measure, and using Middlebury’s evaluation model .....................................................................................................................................................................152. Evaluation of Disparity Maps.
(14) - 13 -. Table 5-13 Evaluation of selected methods of near real-time and real-time performance under all criterion, using MSE measure and Middlebury’s evaluation model ...................................................153 Table 5-14 Evaluation of selected methods of near real-time and real-time performance under all criterion by combining the BMP and the BMPRE measure, and using Middlebury’s evaluation model ..........................................................................................................................................................154 Table 5-15 Evaluation of selected methods of near real-time and real-time performance under all criterion based on the BMPRE measure, and using Middlebury’s evaluation model .....................155 Table 5-16 Evaluation of selected methods of near real-time and real-time performance under all criterion based on the SZE measure, and using Middlebury’s evaluation model ...........................156 Table 5-17 Evaluation results of methods with near real-time and real-time performance, under the all criterion, using the SZE measure, by applying the A* model. ................................................157 Table 5-18 Evaluation results of methods with near real-time and real-time performance, under the all criterion, using the SZE measure, by applying the. evaluation model ...........158. Table 5-19 Values of functions u1 and u2 applied to stereo method composing group 1 under the all criterion and using the SZE measure. ..............................................................................................158 Table 5-20 Evaluation results of methods with near real-time and real-time performance, under the boundary, interior, and occluded criteria, using the SZE measure, by applying the evaluation model .....................................................................................................................159 Table 5-21 Values of functions u1 and u2 applied to stereo method composing Group 1 in Table 5- 20, under the boundary, interior, and occluded criteria and using the SZE measure ................160 Table 5-22 Evaluation results of stereo methods under the occluded criterion using the SZE measure and the. evaluation model ................................................................................163. Table 5-23 Top 15 ranked stereo methods under the occluded criterion using the SZE measure and the Middlebury’s evaluation model .................................................................................................163 Table 5-24 Values of functions u1 and u2 applied to stereo method composing Group 1 in Table 5- 22, under the occluded criterion, using the SZE measure .............................................................164 Table 5-25 Evaluation results of diverse stereo methods under the boundary and interior criteria, using the BMPRE measure and the. model...................................................................165. Table 5-26 Values of functions u1 and u2 applied to stereo methods composing the group 1 in Table 5-25, under the boundary and interior criteria, using the BMPRE measure. ........................166 Table 5-27 Evaluation Results using Midleburry’s Evaluation Model ...............................................168. Evaluation of Disparity Maps.
(15) - 14 -. Acronyms ADC. Analog to Digital Conversion. BMP. Bad Matched Pixels. GMP. Good Matched Pixels. MRE. Mean Relative Error. SZE. Sigma– Z–Error. DOG. Difference of Gaussians. SCP. Stereo Correspondence Problem. MOP. Multi objective optimisation Problem. NCC. Normalised Cross Correlation. MSE. Mean Square Error. PSNR. Peak Signal to Noise Ratio. dB. decibels. SSD. Sum Square Differences. SAD. Sum Absolute Differences. TSAD. Truncated Sum Absolute Differences. MAD. Mean Absolute Differences. SSIM. Structural Similarity Measure. Evaluation of Disparity Maps.
(16) - 15 -. CHAPTER 1. INTRODUCTION Chapter Contents 1.1 Research Problem and Motivation 1.2 Investigated Approach 1.3 Data Used in the Thesis 1.4 Contributions 1.5 Summary of the Candidate’s Activities 1.6 Thesis Outline. 1.1 Research Problem and Motivation The stereo vision problem consists in recovering the 3D information of a scene from at least two 2D images captured at slightly different viewpoints. It is an inverse and ill-posed problem due to lack of information about depth and system instability. It has multiple applications such as: autonomous navigation (Mark & Gavrila, 2006; Ranftl et al., 2012), tele-presence (Isgro et al., 2001; Terrile & Noraky, 2012), tele-operation (Hirschmuller, 2003; Tao et al., 2011), 3DTV (Schereer et al., 2006; Dongbo et al., 2010), planetary exploration (Goldberg et al., 2002; Howard et al., 2012), and terrain analysis (Hsieh et al., 1992; Matthies et al., 2008), among others. The stereo vision problem can be tackled using the information provided by a stereo camera system, and a set of corresponding points. A pair of image points does correspond if they are projections of a same point in the 3D scene. However, the relation between corresponding pairs is not known beforehand (i.e. for a given point in the reference image, it is unknown where the corresponding point lies in the target image, and even if it really exists). Thus, the stereo vision problem entails a sub-problem: the stereo correspondence problem. The stereo correspondence problem can be addressed using a method for determining which points, in the left and in the right images, respectively, Evaluation of Disparity Maps.
(17) - 16 -. are projections of the same 3D space point. A stereo correspondence method, as is sketched in Figure 1-1, takes as input a stereo image pair and estimates a disparity map as output. A disparity map is a computational representation of the shift between corresponding points. More precisely, disparity can be viewed as a vector, relating corresponding points. Its magnitude is inversely proportional to depth. The stereo correspondence problem involves two inherent problems: occlusion and multiplematching. Occlusion arises when a point in one image lacks of correspondence in the conjugated image. The location of occluded points is unknown beforehand and their presence makes difficult estimating disparities of nearby image points. The multiplematching arise due to the lack of information for uniquely identifying the correspondence of a point. It is associated to areas lacking of texture or to repetitive patterns in stereo images content.. Figure 1-1 Stereo correspondence method.. The stereo correspondence problem has been widely addressed in the literature, and many methods with an increasing complexity have been proposed over the past decades. A stereo method can be described and analysed as a set of constitutive modules upon which a classification can be build. As it is shown in Figure 1-1, four main constitutive modules can be indentified (Scharstein & Szeliski, 2002): matching cost computation, cost aggregation, disparity optimisation and disparity refinement. The interaction and synergy achieved by constitutive modules is reflected on estimated disparities. If the disparity of a point is known, the depth can be calculated by triangulation. In this way, the output of a stereo correspondence method allows to approximate a solution to the stereo vision problem. However, mismatched points may cause a large impact on the calculated depth, due to the inverse and the ill-posed nature of the problem. It gives rise to a research question: . Which are the method or methods accurately matching corresponding points, in order to allow a better 3D information recovery in terms of depth calculations, Evaluation of Disparity Maps.
(18) - 17 -. among a set of stereo correspondence methods being compared, under an specific evaluation scenario?. An evaluation of estimated disparity maps can be conducted by following an evaluation methodology. It may involve multiple disparity maps, estimated for an imagery test-bed by several methods, as well as multiple evaluation criteria and measures. Although the use of an evaluation methodology is nowadays a common practice in the literature, the evaluation elements and methods commonly used present the following main drawbacks: . Evaluation criteria are motivated and related to image phenomena that may cause innacuracies in the disparity estimation process. However, they lack of a proper formal foundation and are computationally represented as overlapping image segmentations. This overlapping implies that some image points are associated to different image pehenomena, and, consequently, if an estimation error is present in such points, it will be counted more than once during the error gatehering process. This multiple counting will cause a biasing on obtained scores. Moreover, tradittitionally used evaluation criteria do not follow the advances on state-of-the-art methods, and do not allow the evaluation on areas on which disparity asignmets are required by different application domains such as occluded areas.. . Commonly used evaluation measures are based on a counting of disparity estimation errors beyond a specified threshold. This characteristic makes the measure sensitive to the threshold selection. Moreover, such measure does not consider the magnitude on which a threshold is exceeded. In this way, a large magnitude disparity estimation error may be concealed, and considered in the same way that a small disparity error. In addition, an inherent property of disparity is ignored: its inverse relation with depth. Thus, in practice, an estimation error in a point, far from the stereo system, has a larger impact on depth calculation, that an error (of the same magnitude) in a point near to the camera system.. . Commonly used evaluation models are based on rankings. Consequently, the interpretation of obtained evaluation results may be limited, and suited more for a. Evaluation of Disparity Maps.
(19) - 18 -. contest than for a fair comparison of methods. Moreover, different conclusion may arise from the same evaluation data results, leading to a misinterpretation of the state-of-the-art. . The selection of. evaluation elements and methods used in existing. methodologies is fixed beforehand. Consequently, provided evaluation scenarios are also fixed. However, in the same way that a stereo correspondence method may require tuning of parameters in order to adjust its behaviour, an evaluation process may require of different evaluation scenarios by varying the selection of elements and methods, in order to properly reveal the behaviour of stereo methods, as well as for providing useful information on which aspects a stereo method requires adjustments, and or improvements.. 1.2 Investigated Approach The investigated approach is motivated by an example. Estimated disparity maps by selected stereo correspondence methods for the Tsukuba stereo image (Scharstein & Szeliski, 2012) are shown in Figure 1-2. Figure 1-2 (a), (b), (c) and (d) illustrate disparity maps estimated by methods proposed in (Yoon & Kweon, 2005; Hosni et al. 2009; Gonzalez & Cabezas, 2009; Cabezas, 2009) respectively. The left and right views of the Tsukuba stereo image, as well as its associated disparity ground-truth data, are illustrated in Figure 1-4 (a), Figure 1-4 (b), and Figure 1-4 (c), respectively.. Evaluation of Disparity Maps.
(20) - 19 -. Figure 1-2 Estimated Disparity Maps for Tsukuba Image. (a) Yoon & Kweon, 2005, (b) Hosni et al. 2009, (c) Gonzalez & Cabezas, 2009, and (d) Cabezas, 2009. A visual inspection of the maps shown in Figure 1-2, by a well trained human grader allows obtaining qualitative opinions about their accuracy. A trained human grader may conclude from the map in Figure 1-2 (d) that the used method (Cabezas, 2009) has problems with foreground objects: some thin objects have disappeared, whilst others have fattened. In addition, from the map shown in Figure 1-2 (c) may be concluded that the used method (Gonzalez & Cabezas, 2009) shows poor depth discontinuities location due to the presence of some streaking artefacts. In fact, it may seem that the method used for generating the map shown in Figure 1-2 (c) is producing better results than the method used for generating the map shown in Figure 1-2 (d), but worse than the methods used to obtain the maps shown in Figure 1-2 (a) (Yoon & Kweon, 2005) and in Figure 1-2 (b) (Hosni et al. 2009). A qualitative analysis of each map is still possible when defects or artefacts in estimated maps tend to be less obvious, but the qualitative comparison among them tends to be more and more difficult (Leclercq et al., 2003). Moreover, a qualitative evaluation of disparity maps may vary largely according to several observer or observation related factors (i.e. such as observer’s Evaluation of Disparity Maps.
(21) - 20 -. experience, knowledge, fatigue, visual acuity or environmental conditions, display used, illumination, among others). In addition, the fact that a disparity map be free of noticeable artefacts or defects does not imply that the estimation is error free. In practice, a qualitative evaluation of disparity maps is a time and resources consuming task, which output is very difficult to be repeated under slightly different evaluation conditions. Moreover, obtained results by a qualitative evaluation process are inherently subjective. Hence, evaluation elements and methods interacting in an ordered sequence of steps and allow processing a large number of images in an objective, effective and efficient manner are required. Although a quantitative evaluation process of estimated disparity maps offers advantages over a qualitative one, there are just few works addressing the quantitative evaluation of stereo correspondence methods, independently of the application domain (Guelch, 1991; Szeliski, 1999; Szeliski & Zabih; 1999 Leclerc et al., 2000; Kostliva et al., 2007), and other works within a particular domain (Hsieh et al., 1992; Mulligan et al., 2001), as well as a particular emphasis on driver assistance systems (Morales et al., 2009; Kelly et al, 2008; Morales & Klette, 2009; Klette et al., 2011; Schneider et al., 2011; Geiger et al., 2012). On the one hand, quantitative evaluation approaches without disparity groundtruth data rely on additional views of the captured scene (Szeliski, 1999; Morales & Klette, 2009) or in a different type of ground-truth data (i.e. about the camera parameters) (Leclerc et al., 2000). However, these requirements have an impact on the generation process of stereo data (i.e. increasing the costs of the used camera system, as well as increasing the complexity of image capturing process). Moreover, these requirements are not always fulfilled in already available stereo data. On the other hand, apart from the generation of highly reliable disparity groundtruth data, for different type of scenes (Scharstein & Szeliski 2003; Blanco et al., 2009; Smith et al., 2009; Haeuler & Klette, 2010; Geiger et al., 2012), most evaluations elements and methods commonly used still keep a resemblance with the first proposals in evaluation of disparity maps made in the early and mid 90´s by (Hsieh et al., 1992) and (Maimone & Shafer, 1996), respectively.. Evaluation of Disparity Maps.
(22) - 21 -. Nevertheless, there is still not a consensus on a standard set of evaluation elements and methods to assess stereo correspondence methods. This lack of consensus may have an impact on gauging advances on the stereo vision field, as well as on researchers and practitioners on the field. In other words, it may be not clear, among a set of stereo correspondence methods, which one, or which ones, are estimating disparity maps allowing accurate depth calculations. The above scenario involves a decision problem: . When is possible to determine that, comparatively, depth calculations based on a specific stereo correspondence method, are accurate, similar, or inaccurate, than depth calculations allowed by another stereo method?. The research presented in the thesis targets the formulated research question,. as a decision making problem based on multi-objective optimisation concepts and the Pareto dominance. The presented research aims to provide a formal foundation for achieving a proper quantitative evaluation of estimated disparity maps, by tackling the drawbacks of some evaluation elements and methods commonly used for the comparison of stereo correspondence methods, considering the impact of mismatches on calculated depths, and allowing a clear, unbiased and useful computation and interpretation of evaluation results.. Evaluation of Disparity Maps.
(23) - 22 -. Figure 1-3 Steps involved in an evaluation methodology for stero correspondence methods.. The aim of the conducted research is motivated using the Figure 1-3, which illustrates the steps involved in a methodology for comparing stereo correspondence methods. The relevance of each one of the evaluation elements and methods used in an evaluation process is discussed. A theoretical foundation for evaluation criteria is proposed. Two evaluation measures are devised, taking into account disparity inherent properties, as well as the capabilities of a stereo camera system. A characterisation of evaluation measures is introduced. Two evaluation models based on the Pareto dominance relation are formulated, introducing a formally supported interpretation of evaluation results. Proposals are validated using an interactive on-line evaluation framework, and compared against the most commonly used evaluation elements and methods of state-of-the-art evaluation methodologies.. 1.3 Data Used in the Thesis The Middlebury’s stereo benchmark data set (Scharstein & Szeliski, 2002; 2003; 2012) is used in the thesis. This data set was selected due to it is widely used and Evaluation of Disparity Maps.
(24) - 23 -. known by the stereo vision research community. It is composed by four indoor stereo images captured under controlled conditions: the Tsukuba, the Venus, the Teddy, and the Cones, which are illustrated, with their associated disparity ground truth data, in Figure 1-4.. Figure 1-4 Middlebury Benchmark dataset.. The disparity ground-truth data of these images were generated by different ways. The Tsukuba stereo image is composed by front-parallel objects, and has a disparity range of 16 pixels. The disparity ground-truth data of the Tsukuba stereo image pair was generated manually and are of integer precision (Nakamura et al., 1996). It Evaluation of Disparity Maps.
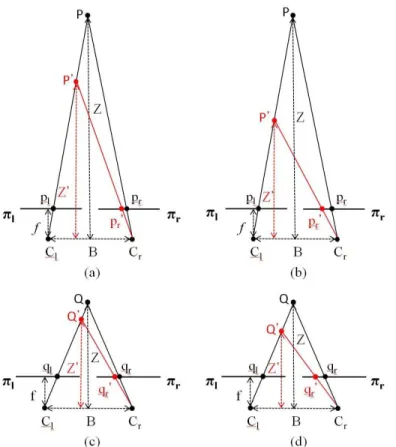
(25) - 24 -. excludes a border of 18 pixels, where no disparity value is provided. The Venus stereo image is composed by piecewise, planar slanted objects, and has a disparity range of 20 pixels. Each planar component was manually labelled, as is illustrated in Figure 1-5 (a), and a direct alignment technique (Baker & Szeliski, 1998) was used on each planar region for estimating the affine motion of each patch. The horizontal component of these motions was used to compute the ground-truth disparity map (Scharstein & Szeliski, 2002). The Teddy and the Cones stereo images contain several objects with a different geometry, and a disparity range is of 60 pixels. Their disparity ground-truth data were generated using a structured light technique (Scharstein & Szeliski, 2003). Structured light techniques rely on projecting one or more special light patterns onto a scene, usually in order to directly acquire a range map of the scene, typically using a single camera and a single projector (Boyer & Kak, 1987; Salvi et al., 2004; Koninckx & Van Gol, 2006; Chen et al., 2008; Quiang et al., 2011). The capturing setup and the illumination by structured light patterns using for the generation of the disparity groundtruth data of the Teddy and the Cones image pairs are shown in Figure 1-5 (b) and Figure 1-5 (c), respectively. In particular, a series of structured light patterns (i.e. binary Gray-code and sine waves patterns) were projected onto the scene.. Figure 1-5 Generation of Disparity Ground-truth data.. Projected intensities are coded to uniquely labelling each pixel. These labels are matched among the stereo views, which are illuminated from different positions. Pixels which estimated disparity do not agree under the different illumination setups are excluded from the ground-truth. Nevertheless, some areas may be shadowed under different illumination positions, and consequently the disparity ground-truth data at those regions cannot be generated. In fact, as long as each pixel is illuminated by at least one. Evaluation of Disparity Maps.
(26) - 25 -. of the projections, its correspondence in the conjugated image or even its lack of it (i.e. indicating occlusion) can be unambiguously determined. With regard to the estimated disparity maps, inter-technique comparisons are mainly based on the maps reported to the Middlebury repository by the authors themselves. In this way, obtained results by a particular stereo method cannot be tampered by the implementation specific details missing in respective papers (Courtney et al., 1997).. 1.4 Contributions A list of the main contributions of the conducted work is presented below. Some context of each contribution is provided. . A methodology model is presented to integrate the evaluation elements and methods in an evaluation process.. . The thesis contains a formulation of evaluation criteria based on set partitions. It allows a proper analysis of the behaviour of stereo methods regarding each evaluation criterion, without being affected by other criteria. Following the proposed formulation evaluation criteria are used in an innovative way which includes the evaluation on occluded areas.. . Two evaluation measures considering the disparity error magnitude, and overcoming the above drawbacks are presented in the thesis: Sigma-Z-Error (SZE) and Bad Matched Pixels Relative Error (BMPRE). The SZE is inherently related to the depth recovering based on estimated disparities. It does not require threshold specification by users, and is suited to be used on robotic domain applications. The BMPRE considers the error magnitude of disparity estimation over exceeding a specified threshold with regard to its inverse relation between depth and disparity. It can be used in conjunction with previously published evaluation data in order to properly quantify error impact of estimated disparity maps.. Evaluation of Disparity Maps.
(27) - 26 -. . A characterisation of evaluation measures is presented. Five criteria are identified: automatic, reliable, meaningful, unbiased and consistent. Among them, the consistent criterion is the most challenging to identify.. . An evaluation model termed. is proposed in the thesis. The model is based on. the Pareto Dominance relation. It determines the set of stereo methods which performance can be seen as comparable (i.e. since their associated error vector values are incomparable among them in terms of Pareto dominance), and at the same time, superior to the rest of considered stereo methods. The extended in the. model is. model, incorporating the capability of grouping the. entire set of stereo methods under evaluation into groups of comparable behaviour and providing feedback for each stereo method under evaluation. . A method for reducing the cardinality of the Pareto front is proposed in the thesis. It does not require specification of preferences nor weights by a decision maker. It is applied to the context of evaluating stereo correspondence methods to the output produced by the. but it is of general purpose, and can be. used during the decision making stage of any other multi objective optimisation problem.. 1.5 Summary of the Candidate’s Activities The research work presented in the thesis has been reported in book chapters and conference proceedings, as is outlined below: Book Chapters . A Measure for Accuracy Disparity Maps Evaluation. Cabezas I., Padilla V., and Trujillo M., In: Progress in Pattern Recognition, Image Analysis, Computer Vision, and Applications, San Martin C. and. Kim S. (Eds.), LNCS 7042, Springer-Verlag, pp. 223–231, 2011.. . A Method for Reducing the Cardinality of the Pareto Front. Cabezas I., and Trujillo M., In: Progress in Pattern Recognition, Image Analysis, Computer Vision, and Applications, Alvarez L. et al., (Eds.), LNCS 7441, Springer-Verlag, pp 829836, 2012. Evaluation of Disparity Maps.
(28) - 27 -. . Methodologies for Evaluating Disparity Estimation Algorithms. Cabezas I., and Trujillo M., In: Robotic Vision: Technologies for Machine Learning and Vision Applications, García-Rodriguez J. and Cazorla Quevedo M. (Eds.), IGI Global, 2013. Conference Proceedings. . A Non-Linear Quantitative Evaluation Approach for Disparity Estimation - Pareto Dominance Applied in Stereo Vision. Cabezas I., and Trujillo M., In: Proceedings of the International Conference on Computer Vision Theory and Applications VISAPP, SciTePress, pp. 704-709, 2011.. . An Evaluation Methodology for Stereo Correspondence Algorithms. Cabezas I., Trujillo M. and Florian M., In: Proceedings of the International Conference on Computer Vision Theory and Applications - VISAPP, SciTePress, pp. 154-163, 2012.. . On the Impact of the Error Measure Selection in Evaluating Disparity Maps. Cabezas I., Padilla V., Trujillo M., and Florian M., In: Proceedings of the IEEE World Automation Congress - WAC, pp. 24-28, 2012.. . BMPRE: An Error Measure for Evaluating Disparity Maps. Cabezas I., Padilla V., and Trujillo M., In Proceedings of the IEEE International Conference on Signal Processing - ICSP, vol 2, pp. 1051-1055, 2012.. 1.6 Thesis Outline The thesis comprises six chapters. It is structured and organised as follows: . An overview of different concepts and required background for a better understanding of the topics discussed in the thesis is provided in Chapter 2. It begins by considering the components of a mathematical model of imaging, describes the stereo correspondence problem and their two inherently associated problems, some of the constraints that make possible addressing the stereo correspondence problem using a computer, as well as the stratified reconstruction approach. Chapter 2 ends pointing out most commonly used distance functions and presenting the basics of multi-objective optimisation. Evaluation of Disparity Maps.
(29) - 28 -. . A review and a discussion on related approaches as well as on stereo correspondence methods are presented in Chapter 3. It includes the existing classifications of stereo methods, stereo methods used for matching key points in unrectified stereo image pairs, stereo methods for matching points in 1D after the imposition of the epipolar constraint doing special emphasis on local methods, modular components used in post-processing stages, as well as evaluation methodologies with and without disparity ground-truth data. Chapter 3 ends with a brief review on decision making strategies in multi objective optimisation.. . The proposals of the thesis are presented, formulated and discussed in Chapter 4. The evaluation element and methods, as well as the sequence of steps followed in an evaluation methodology of stereo correspondence methods are explicitly identified. A formulation for evaluation criteria based on sets partition is presented. Two new measures for comparing estimated disparity maps against disparity ground-truth data are proposed. Their differences and advantages over conventionally used evaluation measures are discussed. A set of criteria for selecting an evaluation measure during the evaluation process is proposed and discussed. A method for reducing the cardinality of the Pareto Front in the context of multi objective optimisation decision making is presented. Chapter 4 ends with a discussion of a proposed adaptive online evaluation framework for the comparison of stereo correspondence methods.. . The experimental evaluation and the validation of the proposals are presented in Chapter 5. This Chapter is devoted to the discussion of the impacts of presented proposals. The experimentation and the validation of proposals are performed over the interactive and online developed evaluation framework.. . Finally, Chapter 6 concludes the thesis by summarising the research outcomes, highlights the contributions of this work, as well as pointing out work for future research in the addressed domain.. Evaluation of Disparity Maps.
(30) - 29 -. CHAPTER 2. THEORETICAL BACKGROUND 2.1. Image Formation Process 2.2. Stereo Correspondence 2.3. 3D Reconstruction 2.4. Distance Functions 2.5. Multi-objective Optimisation 2.6. Chapter Summary. 2.1 Image Formation Process The first step in the vision process is image formation. It occurs when a sensor registers irradiance interacting with (i.e. being reflected or radiated by) physical objects. (Ballard & Brown, 1982). A mathematical model of imaging may involve, among others, the following components: . An intensity function, it is the fundamental abstraction of an image.. . A geometrical model, it is used to represent how the 3D world is projected into 2D images.. . A radiometric model, it is built to represent how light sources and reflectance properties may affect irradiance measurement at the sensor.. . A digitising model, it describes the process of obtaining discrete samples. A digital image can be described as a matrix of irradiances or intensity discrete. samples, stored in a computer using a previously fixed limited precision. A definition of monochromatic (i.e. grey-level) digital image is given as follows:. Evaluation of Disparity Maps.
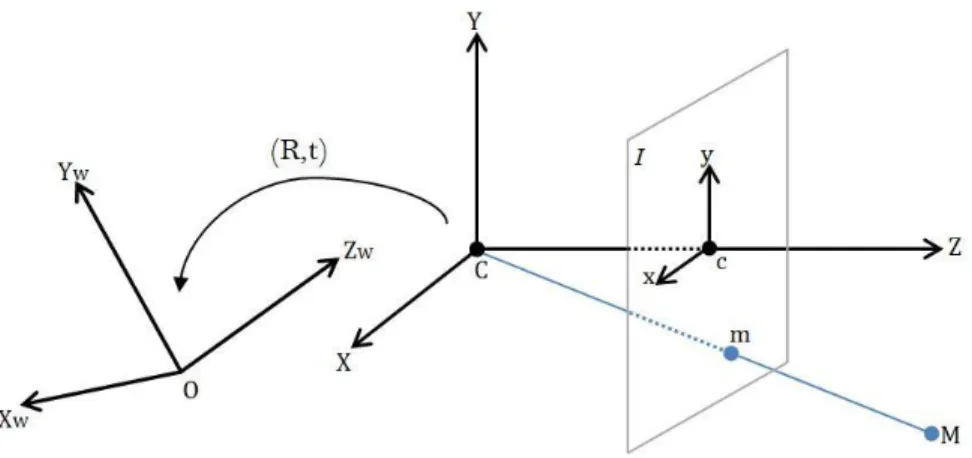
(31) - 30 -. Definition 2.1: Let. be a quantity of bits previously fixed. Let. , such that where. , and. and. be a function,. , subject to:. and. ,. are the amount of rows and columns in a grid. accommodation, respectively. In the above definition, a pixel, whilst. and. value is an intensity value in a picture element or a. values are spatial coordinates. In this way, an intensity function. relates a pair of spatial coordinates to a pixel value. In practice, a pixel value is not determined by a single point in 3D space, but by a small area in a surface.. 2.1.1 Geometrical Models in Imagery The relation between the 3D world and digital images can be modelled by geometry. The following notation is used for presenting some basic concepts of imaging geometry: . , a 3D point in world coordinate system. , a 3D point in camera coordinate system. , focal length (the distance between the image plane and the optical centre).. . , a 2D point in image coordinate system.. . , a 2D point in pixel coordinate system.. . , a 2D point in normalised image coordinate system.. . , a 2D point in normalised pixel coordinate system.. . , the 3x3 essential matrix.. . , the 3x3 fundamental matrix. A camera is, in brief, an electronic sensing device capable of producing a. mapping between the 3D world and a 2D image. In this mapping, there are inherent errors such as quantisation effects or geometric distortions, among others. From a geometric point of view, a camera can be analysed as a perspective projection model. In this regard, the Pinhole camera model is an ideal model.. Evaluation of Disparity Maps.
(32) - 31 -. 2.1.1.1 Pinhole Camera Model A pinhole camera can be constructed by an enclosure or a box with a small hole in the front of it. An inverted image is formed on the back of the box, when rays coming from world objects passing through the pinhole. A pinhole camera is illustrated in Figure 2-1 (Forsyth & Ponce, 2011).. Figure 2-1 Pinhole camera.. In this construction, the front of the box is acting as the focal plane. The pinhole, – denoted as. –, is the optical centre. The back of the box – denoted as. – is the. image plane. A pinhole camera model is a mathematical idealisation of the construction described above, on which a virtual image plane. is in front of the focal plane, at a. distance , obtaining a non-inverted image. The pinhole camera model, with a virtual image plane, is illustrated in Figure 2-2. In this model, light rays are converging at the optical centre. . The optical axis is the line going through the optical centre and. perpendicular to the image plane. It is intersecting with the image plane at the principal point, – denoted as . In order to establish a relation between, 3D camera coordinates, and 2D image coordinates, it is necessary to define coordinate systems. The image coordinate system is defined with the origin at. , and its axes are determined by the camera. scanning and sampling system. The 3D camera coordinate system with the origin at .. Evaluation of Disparity Maps. is defined.
(33) - 32 -. Figure 2-2 Pinhole camera model.. The -axis coincides the optical axis of the camera, and the. and. axes are. parallel to the image coordinate system - and - axes. In addition, the relation between the 3D camera coordinate system and the image coordinate system is defined as follows: (2.1) Thus, a 3D point. is expressed in the image coordinate system. according to: (2.2) and (2.3) The pinhole camera has two main weaknesses that make impractical its use (Xu & Zhang, 1996). First, an ideal pinhole, of an infinitesimal aperture does not allow the gathering of enough amount of light in order to measure brightness. Second, the diffraction that occurs at the pinhole, in addition with the wave nature of light, implies that a larger fraction of the incoming light is deflected far from the direction of the incoming ray. These weaknesses may be alleviated by a lenses system.. Evaluation of Disparity Maps.
(34) - 33 -. 2.1.1.2 Thin Lens Model A thin lens is an ideal lens, which should have the same smooth curvature in booth sides. By construction, a thin lens deflects all rays parallel to the optical axis and coming from one side onto the focus of the other, following two properties: . A ray passing through the centre of the lens is undeflected.. . All rays parallel to the optical axis converge to a point, on the other side of the lens, at a distance equal to the focal length. A thin lens model produces the same projection as the pinhole model, but. gathering enough amount of light. A cross-sectional view of a thin lens sliced by a plane containing the optical axis is illustrated in Figure 2-3.. Figure 2-3 - Light convergence in a thin lens camera model.. In addition, a thin lens model involves two concepts: the depth of field and the field of view. The depth of field is a range of distance along the optical axis on which objects are properly focused. Objects outside of this range will appear blurry in the image. The field of view is an angular measure of the portion of 3D space which is captured by a camera.. 2.1.1.3 Distortion Enhanced Models The final coordinates on the image plane of a 3D world point may be affected due to several types of imperfections in the design and assembly processes of the lens. In fact the magnitude of the geometric distortions depends on the quality of the used lens. Geometric distortions are related to the curvature of the lens, and cause a Evaluation of Disparity Maps.
(35) - 34 -. displacement of a given point, from its ideal location. Thus, a straight line in the 3D world is not projected onto a straight line in the image plane. The radial distortion is the most common distortion (Heikkilä, 2000; Zhang 2000). Radial distortions are symmetric about the optical axis. There are two types of radial distortions: barrel and pincushion. A barrel distortion is related to a negative radial displacement, causing that outer points be grouped together and a decreased scale. A pincushion distortion is related to a positive radial displacement. It causes outer points be spread and an increased scale. In this work distortion is not considered.. 2.1.1.4 Camera Parameters A reconstruction of the 3D structure of a scene requires a link between the coordinates of a point in 3D space, with the coordinates of their projection onto the image plane. A 3D point the coordinates coordinates. in space is, regarding to the world reference frame, located in . It is, with regard to the camera reference frame, located in. . The point. intersection of the line joining image point. is projected onto the image point. , which is the. and (the optical centre) , with (the image plane) . The. has coordinates. . In fact, the third component of an image point. is always equal to the focal length. Thus, as we saw in section 2.1.1.1, there is a mapping from Euclidean 3-space, to Euclidean 2-space, as follows: (2.4) It is often assumed that the camera reference frame can be located with respect to some other, known, reference frame (i.e. the world reference frame), and that the coordinates of image points in the camera reference can be obtained from pixel coordinates, which are available from the image. This is equivalent to assuming knowledge of some camera characteristics. These camera characteristics are known as the camera intrinsic and extrinsic parameters.. 2.1.1.5 Extrinsic Parameters The extrinsic parameters are a set of geometric parameters that uniquely identify the transformation between the unknown camera reference frame and a known world reference frame. Extrinsic parameters can be expressed in terms of a 3D rotation Evaluation of Disparity Maps.
(36) - 35 -. followed by a translation, as is illustrated in Figure 2-4. The rotation is based on a 3x3 orthogonal matrix , and the translation is based on a vector . Thus, a mapping between the world reference frame and the camera reference frame is defined as follows: .. The matrix. (2.5). can be parameterized by the Euler angles yaw, pitch and roll.. These angles, in conjunction with the tree components of the vector. , are the. components of the extrinsic parameters.. Figure 2-4 Relation between the camera and the world coordinate system.. 2.1.1.6 Intrinsic Parameters The intrinsic parameters are the factors that define the scanning and the sampling relation between the image coordinate system and pixel coordinate system. They characterise inherent optical, geometric and digital properties of a camera. Intrinsic parameters involve the perspective projection, the transformation between the camera frame coordinates and pixel coordinates, and the geometric distortion introduced by optics. The focal length is the only parameter related with the perspective projection. The pixel coordinate system ( image. Let (. ) is used in the digitised. be the coordinates of the principal point . Let. and. be the. horizontal and vertical scale factors, respectively, whose inverse characterise the size of pixel in word coordinate units. Then, neglecting any geometric distortions introduced by Evaluation of Disparity Maps.
(37) - 36 -. the optics, the transformation between camera frame coordinates and pixel coordinates are expressed by the coordinates in pixels of the image centre(. , or principal point,. and the effective size of the pixel in the vertical and horizontal directions,. ,. respectively, as follows: (2.6) (2.7) The relation between the image and the pixel coordinate system is illustrated in Figure 2-5. With regard to radial distortions, they are commonly ignored when high accuracy is not required, since they are usually very small.. Figure 2-5 Relation between the camera and the world coordinate system.. 2.1.2 Radiometric Models Radiometry is the part of image formation process concerned with the relation among the amount of light energy emitted from light sources, reflected from surfaces, and measured by sensors (Trucco & Verri, 1998). Light sources can be divided in two main categories: point sources (i.e. the sun lighting at infinity) and area sources (i.e. a fluorescent lamp in lab ceiling). The light hitting an object is scattered and reflected (Szeliski, 2010). Thus, two radiometric issues have to be considered during the image formation process: how much of the illuminating light is radiated (i.e. emitted or reflected). Evaluation of Disparity Maps.
(38) - 37 -. by objects surface (i.e. scene radiance), and, how much of the reflected light effectively reaches the image plane of a camera (i.e. image irradiance). With regard to scene radiance, a surface reflectance model specifies how a surface reflects light. The Lambertian surface reflectance model assumes that objects’ surface appears equally bright from all viewing directions. It applies, for instance, to nonspecular surfaces, as well as for several materials and finishes such as a matte paint, or a piece of paper, among others. Consequently, there are several circumstances on which surface reflectance do not follow the Lambertian model. With regard to image irradiance, it can be assumed, in general terms, as uniformly proportional to the scene radiance over the whole image plane.. 2.1.3 Digitising Models After the light is reflected by object surface, and passes through camera’s optics, it reaches the imaging sensor (Szeliski, 2010). This light energy (i.e. incoming photons) is then converted to electrons by the sensor. The two main kinds of sensors used in cameras are the Charged Coupled Device (CCD) and the Complementary Metal Oxide on Silicon (CMOS). Each one of these sensor perform their task using a variety of technologies, with advantages and drawbacks of their own. In addition, there are several factors affecting the image sensor performance such as such as: exposure time, sampling, fill factor, analog gain, ADC resolution, and digital post-processing, among others (Szeliski, 2010). . The exposure time is determined by the shutter speed. It controls the amount of light reaching the image sensor. An improper amount of light may turn into an over or an under exposed image.. . The sampling pitch is the distance among neighbouring sensor cells on the image chip. A sensor with a smaller sampling pitch provides a higher resolution, but, at the same time, a smaller pitch implies that each sensor has a smaller area making it less light sensitive and prone to noise.. . The fill factor is related to the active sensing area size. A higher fill factor is capable of capturing more light, but it also requires more electronics.. Evaluation of Disparity Maps.
(39) - 38 -. . A higher analog gain allows the camera to perform better under low light conditions.. . The Analog to Digital Conversion (ADC) is the last step occurring within an imaging sensor. It has two aspects of main interest, the resolution, and its noise level. The resolution is related to the quantity of bits involved, whilst the noise level is related to how many of these bits are useful in practice. Digital post-processing is related to a set of operations performed by a camera. after the conversion of irradiance values to digital bits, and previous to the compression and storing of pixel values. They may include luminance mapping. and colour. demosaicing, among others.. 2.2 Stereo Correspondence In a stereo camera system, a 3D scene – the input – is simultaneously captured from slightly different points of view, and a stereo image is produced as the output, according to the projective model of the system. Thus, the point. in 3D space may be. captured in both of the views generated by the stereo system. These two conjugated projections of the 3D point are corresponding points. A definition of stereo correspondence is provided as follows: Definition 2.2: Let. be a 3D space point in the world coordinates. Let. be a point on the left image plane, in normalised image coordinates. Let be a point on the right image plane, in normalised image coordinates. The points point. and. are corresponding points, if and only if they are projections of the. . An inverse problem arises when the goal is to recover the 3D structure of a. scene from a stereo image. A 3D information recovering process is possible if the information about the correspondences is known and some information about the stereo camera system is available. In this case the output of the system is given, and the original input can be estimated.. Evaluation of Disparity Maps.
(40) - 39 -. 2.2.1 Stereo Correspondence Problem The stereo vision process, defined as the recovery of the 3D structure of a scene from 2D images, is based on the information about corresponding points. However, in practice, the information about stereo corresponding points is unknown beforehand. Thus, the stereo correspondence problem is associated to a lack of knowledge about the existence and the location of the underlying correspondences that exist in a stereo image. There are two inherent problems to the stereo correspondence problem: occlusion and multiple matching. The occlusion problem arises when only a single projection of a 3D point is captured into the stereo image pair. In this case, the original depth of such point cannot be recovered from the stereo image. The multiple matching problem arises when the image content in the stereo pair does not uniquely identify which are the conjugated matching points. The multiple matching problem is associated to areas lacking of texture, as well as to the presence of repetitive patterns, among others. The stereo correspondence problem can defined as follows. Definition 2.3: Let . Let. be a stereo camera system. Let be the left image plane of. be the right image plane of . Let. Let. be the projection of. be a 3D space point in world coordinates.. onto , in normalised image coordinates of the. left camera reference frame. Let. be the projection of. onto. , in. normalised image coordinates. The stereo correspondence problem has the following characteristics: . It is not known beforehand if the point. . If the point. really exists.. does exist, the values of their image coordinates are unknown.. The stereo correspondence problem is an ill-posed problem due to the lack of information about depth and the instability of the solution of the system. As a consequence of instability, a small perturbation in the matching of conjugated points may produce a large error in the 3D information recovery process.. Evaluation of Disparity Maps.
(41) - 40 -. 2.2.2 Disparity Estimation The stereo correspondence problem can be addressed as a search problem guided by an optimisation strategy: for each point in the reference image, its matching point is searched in the target image, according to the scores computed by matching functions. Commonly, the left view is used as the reference image, and the right view is used as the target image. However these roles are interchangeable. The vector relating corresponding points is termed disparity. A disparity vector can be defined as follows. Definition 2.4: Let. be a point in the left image plane. normalised pixel coordinates. Let. , in. be a point in the right image plane. in normalised pixel coordinates. Let. and. disparity vector relating points. ,. and. be corresponding points. Let. ,. be the. .. Once a correspondence has been established, measuring its associated disparity is straight forward. Thus, errors in disparity assignments are due to inaccurate or wrong matches. In general terms, there are three types of errors during the search for matching points: mismatches, false negatives and false positives (Goulermas, 2000). A mismatch occurs when a point in the reference image is matched with the wrong point in the target image. A false negative occurs when a point which should be matched is left unmatched. A false positive occurs when a point which should be left unmatched is given a match. The magnitude of a disparity vector is inversely proportional to the depth. A larger value indicates a closer distance between a point and the camera system. In the context of stereo vision, the set of disparity vectors for a particular stereo image is termed as disparity map. It can be represented as an image, being the points of the reference image, the spatial domain.. 2.2.3 Stereo Constraints In a strict mathematical sense, an ill-posed problem cannot be solved. An approximation to the solution can be achieved based on a priori information and imposing constraints. The constraints that are commonly considered by different approaches to the stereo correspondence problem are presented below.. Evaluation of Disparity Maps.
Figure


+7


Documento similar
Ground- truth labelled fingerprint data is used to assess the performance of an example likelihood ratio method in terms of those performance
The position of the ostracod species within the morphospace allows the computation and comparison of the morphological disparity in different groups, as well as their
Then, four measures based on color and motion are selected and examined in detail with different segmentation algorithms and standard test sequences for video object
Table 10: Assessment of the likelihood of pest freedom following evaluation of proposed risk mitigation measures against selected relevant pests on Ficus carica bare rooted
Table 6: Assessment of the likelihood of pest freedom following evaluation of current risk mitigation measures against Thrips palmi on Momordica charantia fruits from
Table 6: Assessment of the likelihood of pest freedom following evaluation of current risk mitigation measures against Thrips palmi on Momordica charantia fruits from Mexico
• Inadvertently, virtual water will play a greater role in food trade – simply as a function of increasing water scarcity and the disparity of water availability between countries
Diffusion Maps is a recent manifold learning method for dimensionality reduction that assumes the original sample patterns being embedded in a low dimensional manifold whose metric
