A simulation analysis of policies for the northern Colombia beef cattle industry
433
0
0
Texto completo
(2) A SIMULATION ANALYSIS OF POLICIES FOR THE NORTHERN COLOMBIA BEEF CATTLE INDUSTRY By. Alvaro Posada. A DISSERTATION. Submitted to Michigan State University in partial fulfillment of the requirements for the degree of DOCTOR OF PHILOSOPHY Department of Agricultural Economics.
(3) ABSTRACT. A ~IMULATION ANALYSIS OF POLICIES FOR THE NORTHERN COLOMBIA BEEF CATTLE INDUSTRY By Alvaro Posada. The Atlantic Coast of northern Colombia (known as the Costa) supports between 40 and 50 percent of Colombia's cattle population and, with easy access to domestic and world markets, is the most important of Colombia's five beef-producing regions. Because cattle raising is the main economic activity in the Costa and is an extensive operation with low technical efficiency, the region has been a priority target for cattle development programs.. In the mid-1960s, wlth the financial. and technical assistance of several international agencies, the Colombian government started a cattle development program aimed at increasing beef production mainly on the Atlantic Coast.. In the early 1970s this program was reinforced with. a disease control program and then revlsed and lssued as a national cattle development plan.. The main lnstruments of. this plan are credlt, technical assistance, export subsidies and improved marketing and slaughtering facilities.. Its. long-term objectives are to increase the protein supply to the Colombian population and to generate foreign exchange earnings..
(4) Alvaro Posada The primary purpose of this study was to. d~velop. a. system simulation model to (1) analyze the effects of production incentives on the decision of farmers to adopt new production methods, and (2) estimate the effects of the expanded. regiona~. production on the income of farmers, government revenues, Colombian beef consumption and sustained level of exports. Four alternatives to traditional production were considered. Alternative 1 considered the improvement of native and artificial grasses; alternative 2 considered the improvement of artificial grasses and the substitution of artificial for native grasses; alternatives 3 and 4 addedtheproduction of forages and silage to the improvement of range lands in alternatives 1 and 2 respectively.. At the present stage of the study, however,. alternative 2 was the only one comprehensively tested and used as a base run for policy experimentation.. The cattle system. simulation model has five major components (including a cattle demography model) which (1) allocate land use according to the farmer's perceived profitabilities of cattle and crops subject to land and capital constraints; (2) calculate yield and output of cattle and crops and their respective producer and market prices;. (3) provide the instrumental linkages for. government revenue, export trade policies, and production campaign policies; and (4) generate the performance criteria necessary to evaluate the impacts of alternative programs on the cattle economy through time..
(5) Alvaro Posada The five major sets of assumptions investigated were (1) disease control in the traditional herd,. (2) alternative. cattle industry taxing policies, (3) alternative development credit policies, (4) alternative levels of government production campaign promotion, and (5) alternative cattle pricing and export policies.. The results of the cattle policy experiments. were discussed in terms of the projected time paths (froID 1966 to 1985) of five of the most important performance indices incorporated in the model:. (1) regional cattle population,. (2) Colombian beef consumption per capita, (3) regional farm income from cattle, (4) capitalized grazing land value per hectare, and (5) annual regional government revenue from cattle.. Experiments with disease control and export promo-. tion policies each used two indices instead of the aboye five:. regional cattle population and extraction ratio for. the disease control policies and domestic market price of finished males and export margin for the export policies. In general, the study demonstrated that (1) the projected out comes with the government disease control campaign were greater than under precampaign practices in the traditional herd; (2) the projected outcomes with government programs easing development loan terms were in all cases greater than the base run which assumed current credit policies; (3) the projected area in improved land and the modern cattle population with government policies benefiting both the traditional and modern operations were in all cases lower than under policies benefiting only the modern.
(6) Alvaro Posada operation; (4) the projected area in improved land with the increased land tax rate was greater than the base run which assumed current land tax rates; (S) the projected outcomes with the removal of special taxes on cattle were lower than the base run which assumed no removal of these taxes; (6) given the assumptions on farmers' decisions and accounting mechanisms in the model,. availabilit~. of credit for iand. improvement does not seem to be a seríous constraint to land modernization¡ and (7) the projected outcomes with a flexible exchange rate suggest that this is an effective incentive to export without involving large transfers from public revenues to exporters in the form of subsidies. The study indicated areas where more research and regional data are needed to improve the model's performance, and discussed possible extensions that could help analyze more fully alternative policy strategies for the Costa's overall development.. Finally, the study demonstrated that the system. simulation approach with a computerized model of the cattle economy which incorporated information from diverse sources and accounted explicitly for the dynamic interactions and feedbacks that might occur can be a very use fuI methodological tool for policy analysis..
(7) To. Maria Lucia and. Clara Lucia. ii.
(8) ACKNOWLEDGMENTS. 1 express my gratitude to Professor Glenn Johnson for his guidance throughout my entire graduate program and for his encouragement.. Special thanks are due to Dr. Michael. Abkin for his assistance and critical yet perceptive cornments since the early stages of this study. 1 also want to thank Drs. Thomas Manetsch, Marvin Hayenga and Leonard Kyle for their help as members of my thesis committee.. 1 am thankful to Chris Wolf for writing. the computer program; to Judy Pardee, Enid Maitland and Patti Stiffler for typing earlier drafts of the thesis; and to Addiann Hinds for her editorial assistance. 1 am indebted to the Rockefeller Foundation for financially supporting my studies at Michigan State University. The U. S. Agency for International Development (under Contract AID/csd-2975) was also very helpful providing financial aid for the final stages of my research. A special debt is due to my wife, Maria Lucia, for her love, patience and support during this period of mutual knowledge enrichment.. iii.
(9)
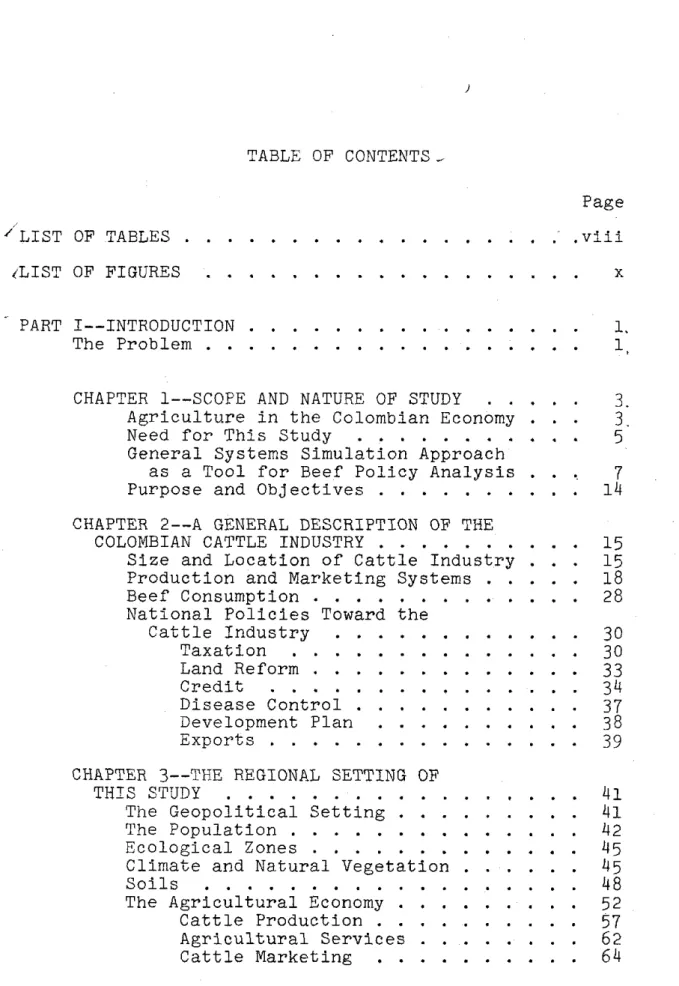
(10) ). TABLE OF CONTENTS._ Page /LIST OF TABLES .. .viii. ,LIST OF FIGURES. x. PART I--INTRODUCTION The Problem . .. l. 1. CHAPTER l--SCOPE AND NATURE OF STUDY Agriculture in the Colombian Economy Need for This Study . . . . . . . . General Systems Simulation Approach as a Tool for Beef Policy Analysis Purpose and Objectives . . . . CHAPTER 2--A GENERAL DESCRIPTION OF THE COLOMBIAN CATTLE INDUSTRY . . . . Size and Location of Cattle Industry Production and Marketing Systems Beef Consumption . . . . National Policies Toward the Cattle Industry Taxation Land Reform . Credit . . , Disease Control Development Plan Exports . . . CHAPTER 3--THE REGIONAL SETTING OF TRIS STUDY . . . . . . . . The Geopolitical Setting . The Population . . . . . . Ecological Zones . . . . . Climate and Natural Vegetation Soils . . . . . . . . . The Agricultural Economy . Cattle Production . . Agricultural Services Cattle Marketing. iv. 3.. 3. 5. 7. 14. 15 15 18 28 30 30 33. 34 37 38. 39 41 41 42. 45 45 48 52 57 62 64.
(11) Page CHAPTER 4--GENERAL SPECIFICATIONS AND PROCEDURE . . . . Area of Study . . . Farming Sectors Ranching Practices . , Modern Alternatives Static Restrictions Procedure . . . PART II--MODEL DESCRIPTION Introduction .., . .. . .. .. 67 67 67 70 72 73 74. .. ... ... 78. CHAPTER 5--LAND ALLOCATldN AND MODERNIZATION DECISIONS--CROPS!CATTLE (LAMDAC) .'. Land Uses ........... Availability of Ag~icultural Land Food Crops . . . . Cash Crops . . . . . . . . . Pasture and Cattle . • . . . Alternatives • . . . • . . . Cattle Modernization Decisions Profitabilities Promotion and Diffusion Transition Responses . . . • . Cattle Transfers . . . . • . .. 80 80 82 85 87 88 95 96 97 104 105 120. CHAPTER 6--AGRICULTURAL PRODUCTION-CROPS!CATTLE (AGPRAC) Crop Yields . . , Pasture Production Cattle Production Demography Milk and Animals Output Market Model . . . Disease Control . . . . Agricultural Accounting . .. 126 126 129 137 137 150 155 159 163. .. .. •. CHAPTER 7--PRICE GENERATION (PG) Export and Market Price of Cattle Producer Prices and Price Averages. 184 184 187. CHAPTER 8--POLICIES FOR THE CATTLE INDUSTRY Policies . . . . . . Production Campaigns. 192 193 193 195 196. Taxes. ..... .. ... ... .. •. Export Po1icies CHAPTER 9--ACCOUNTING AND PERFORMANCE CRITERIA (CRTACC) . . ..... v. . 197.
(12) Page Budget Accounting . . . , Development Credit Commercial Credit . Aggregated Income and Consumption Capital Formation and Export Incentives Performance Criteria . . . . . . . . . .. 197 200 201 204 208 215. PART III--VALIDATION AND TESTING . . . . . . . . . . 221 Introduction CHAPTER 10--DATA USAGE AND MODEL TUNING Model Data Requirements .. . . System Parameters . . . . . Technological Coefficients Initial Conditions Tuning . . . . . . . . . Consistency Checks General Validation . . .. 223 225 225 229 230 231 239 241. CHAPTER ll--RESULTS OF SENSITIVITY ANALYSIS Analysis of Results Methodology Summary . . . . . .. 246 247 247 258. PART IV--MODEL APPLICATION IN DECISION MAKING Introduction. . . . 261. CHAPTER 12--POLICY EXPERIMENTS ON THE NORTHERN COLOMBIA BEEF INDUSTRY POlicy Experimentation . . . . Run Definitions and Organization Policies Related to Disease Control . . . . . . . . . . . Policies Related to Cattle and Land Taxes . . . . . . . . Policies Relatea to Promotion and Development Credit Policies Related to Domestic Supply . . . . . . . . Policies Related to Crop Modernization . . . . .' Effects of Various Policy Combinations . . . Policies Related to Export Promotion Conc1usIons vi. 262 263 264 268 273 285 290 300 315 319. 334.
(13) Page CHAPTER 13--SUMMARY AND CONCLUSIONS . . . Introduction and Surnmary . . • . . . Salient Features of the Costa Model Policy Implications from Simulation Experiments on the Costa Cattle Economy . . . . . . . . . . . . Improvements and Extensions of the Model . . . . . . . Needed Improvements in the Model Extensions . . . . Concluding Remarks APPENDIX.:. 340 340 342 346 349 350 354 357. Computer Program. 359. ..... 402. BIBLIOGRAPHY. vii.
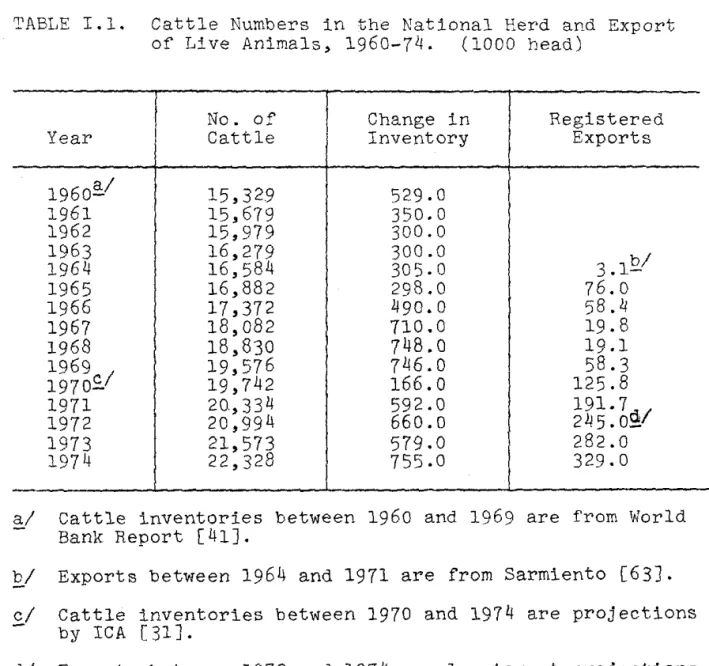
(14) LIST OF TABLES Table I.1.. I. 2. I. 3. I. 4. I. 5.. I.6.. Page Cattle Numbers in the National Herd and Export of Live Animals, 1960-74 ('000 head) . . . . . . . . . . .. 19. Costa-Land Classes and Recornmended Use by Departments ('000 has.) . . .. 53. Costa--Distribution of Farms According to Size, 1960. . . . . . . . . . .. 54. Catt1e Numbers in the Costa and NonCosta Herd, 1968 ('000 head) . . .. 58. Surplus and Deficit Relationships in Beef Production Among Regions, Colombia, 1969-1972. . . . . . . .. 60. Costa--Cattle Distribution According to Size of Ranch, 1960. . . . . . . .. 62. II.1.. Selected Coefficients and Initial Values in the Land Al1ocation and Modernization Decisions Component (LAMDAC) . . . . 123. II. 2.. Average Annual Yie1d and Initial Costs by Farming Sectors . . . . . .. 128. Maximum and Minimum Proportions of Cattle Sales . . . . . . . . . .. 154. II.3. II.4.. Perceived Changes in Cattle Output and Costs During the Planning Horizon... . 177. II.5.. Selected Coefficients and Initia1 Values in the Agricultural Production Component (AGPRAC) . . . . . . . . . 181. 11. G.. Land in Crops, Average Yields and Producer Prices in the Costa, 1960. JI. 7.. . lBB. SeJectcd Coefficients and Initial Values in the Price Generation Component (PG) . . . . . . . . . . . . . 191 viii.
(15) Table. Page. II. 8.. Selected Coefficients and Initial Valu€s in the Accounting and Performance Cri teria Component (CRTACC). . . . . . 219 Profitabi1ity Response Parameters for Traditiona1 and Modern Grazing (Dimensionless). . . . . .. 227. lII. 2.. Cattle Production Paramet.ers . .. 228. lII. 3.. Pasture and Crop Yie1ds (tons/ha-year). 232. lII. 4.. Mean Length of Cattle Production Stages (years) . . . . . . . .. 233. lII. 5.. Se1ected Initia1 Conditions (1960). 233. lII. 6.. Time Series Tracking .. . . .. 237. lII. 7 .. Results of Consistency Checks.. 240. lII. 8.. Selected Results of Alternatives to Traditional Cattle Production--198S.. 243. Results of Sensitivity Tests on Selected Parameters of the Costa Model. .. 250. Policy Simulation Runs. 265. lII.l.. lII. 9.. IV.l.. ix. ,..
(16) LIST OF FIGURES Figure. Page Colombia--the five beef cattle producing regions. . . . . . . . . . . . . . .. 17. 1. 2.. Ecological zones of Northern Colombia.. 46. 1.3.. Costa--general soil groups .. 49. 1.4.. Hypothetical cross-section of alluvial valleys in Northern Colombia . . . .. 50. Agricultural regions of Northern Colombia . . . . . . . . .. 68. A functional flow diagram of cattle production . " ..,. 71. Building blocks of the Costa beef modelo . . . . . . . .. 75. 1.1.. 1.5. 1.6. 1.7. 11.1.. The profitability response function.. 106. 11.2.. The land "dropout" function.. . .. 115. 11.3.. The reversion response function.. 116. 11.4.. Cattle production cohorts. . . .. 138. II.5.a.. Traditional birth rate versus total digestible nutrients ....... 142. II.5.b.. n.5.c.. n.5.d. II.5.e.. Modern birth rate versus total digestible nutrients. . . . 142. Traditional death rate of growing cohort versus total digestible nutrients. . . . . . . . . . . .. 143. Modern death rate of growing cohort versus total digestible nutrients.. 143. Traditional death rate of producing cohort versus total digestible nutrients. . . . . . . . . . . . . . . 144 x.
(17) Page. Figure II.5.f.. Modern death rate of producing cohort versus total digestible nutrients.. 144. 11.6.. The cattle sales function. . . . .. 153. 11. 7 .. The on-farm resource use response function . . . . . . . . . . .. 172. II.8.. Promotion and development credit pro file . . . . . . . . . . . . . . . . . 195. III.lo. III. 2.. Results of ncoarse" model tuning-cattle population in the Costa and Colombian beef supply time series against simulated series . . . . .. · 235. Results of "coarse" model tuning--market price of finished males and land in crops time series against simulated series .. .. ... .. . .. ... .. .. ... .. · 236. IV.l.. Cattle population in the Costa with and without a disease control program, 1965-1985. . . . . . . . . . . . . . . . 270. IV.2.. Extraction ratio from the Costa cattle herd wi th and wi thout a dis.ease control program, 1965-1985 . . . . . . . . . . . 271. IV.3.. Cattle population in the Costa under various taxing policies, 1965-1985. 280. Beef consumption per capita of the Colombian population under various taxing policies, 1965-1985 . . . .. . 281. Aggregated farm income from cattle production in the Costa under various taxing policies, 1965-1985 . . . ". . 282. IV.4.. IV.5.. IV.6.. Average per hectare capitalized value of grazing land in the Costa under various taxing pollcies, 1965-1985 . . . 283. IV. 7.. Annual government revenues from cattle production in the Costa under various taxing policies, 1965-1985 .. IV. 8.. . 284. Cattle population in the Costa under various promotion and credit policies, 1965-1985. . . . . ... · 291 xi.
(18) Figure. page. IV·9.. Beef eonsumption per eapita of the Colombian population under various promotion and eredit polieies, 1965-1985. . . . . . . . . . . . . . . 292. IV.IO.. Aggregated farm income from eattle produetion in the Costa under various promotion and credit polieies, 1965-1985 . . . . . . . . . . . . . ,. . 293. IV. 11.. Average per heetare eapitalized value of grazing land in the Costa under various promotion and eredit polieies, 1965-1985. . . . . . . . . . . . . . . 294. IV .12.. Annual government revenues from eattle production in the Costa under various promotion and eredit polieies, 1965-1985. . . . . . . . . .. . 295. IV.13.. Cattle population in the Costa and the rest of Colombia under various domestic supply polieies, 1965-1985 . . . . . 301. IV.14.. Beef eonsumption per eapita of the Colombian popu1ation under various domestie supply polieies, 1965-1985 . . . 302. IV.15.. Aggregated farm ineome from eatt1e produetion in the Costa under various domestie supp1y polieies, 1965-1985 . . . 303. IV .16.. Average per heetare eapitalized value of grazing land in the Costa under various domestie supply polieies, 1965-1985.. 304. IV.17.. Annual government revenues from cattle produetion in the Costa under various domestie supply polieies, 1965-1985 . . . 305. IV.18.. Cattle population in the Costa with and without a erop modernization program, 1965-1985. . . . . . . . . .. IV.19.. . 310. Beef eonsumption per capita of the Colombian population with and without a erop modernization program 19651985 . . . . . . . . . . . . . . . . . . 311. xii.
(19) page. Figure IV.20.. Aggregated farm income from cattle production in the Costa with and without a crop modernization program, 1965-1985. . . . . . . . . . . . . . . . 312. IV. 21.. Average per hectare capitalized value of grazing land in the Costa with and without a crop modernization program, 1965-1985. . . . . . . . . . . . . .. . 313. Annual government revenues from cattle production in the Costa with and without a crop modernization program, 1965-1985. . . . . . . . . . . . .. . 314. IV.22.. IV. 23.. Catt1e population in the Costa under various po1icy conditions, 19651985 . . . . . . . . . . . . . . . 320. IV. 24.. Beef consumption per capita of the Co1ombian population under various policy condi tions, 1965-1985 . . . . . 321. IV. 25.. Aggregated farm income from cattle production in the Costa under various po1icy conditions, 1965-1985 . . . .. . 322. IV. 26.. Average per hectare capitalized value of grazing 1and in the Costa under various policy conditions, 19651985 . . . . . . . . . . . . . . . . . . 323. IV. 27 .. Annual government revenues from cattle production in the Costa under various policy conditions, 1965-1985. . . . . . . . . . . • . .. . 324. IV. 28.. Dornestic market price of finished males under various policy alternatives, 1965-1985. . . . . . . . . . . . . . . . 330. IV.29.. Competitive position of Colombian cattle in export markets under various policy alternatives assuming high export target and moderate and low world beef prices, 1965-1985 . . . . . . . . . 331. xiii.
(20) PAR T. 1. INTRODUCTION The Problem Although planning for development has be en practiced in Colombia for over thirty years, it has played a small role in the preparation of economic policy, and the various plans have been conceived more as political than as economic documents.. ,/. Plans have been eritieized as being'essentially technoeratie exercises; the general publie has eontributed little to plan objeetives and serious intention to implement has been laeking.. As a consequenee, development plans have en-. joyed minimal general support and have had little or no effeet on ehanging the eountry's economic, social and politieal struetures [26J. The general systems simulation technique, with its special approach to analyzing the problems of development, could be helpful in solving the issues of feasibility, credibility, and general acceptance of the planning exercise. Yet its effectiveness as a tool for development will depend on the will of Colombian authorities to provide the necessary r1nancl~1. and lnatitutional support for fulflllment of the. plan'D goalR. 1.
(21) 2. In Part. r,. Chapter 1 discusscs the scopc and procc-. dure of tho ntudy and IH'!cfly out] iw,,; Lh,' "::.v:;j,¡'1I1;· ;'1'["''':1('11'' ufled.. Chapter 2 is a brief descriptive account of Golornbtan. beef production, distribution and consumption that will help clarify the problems of the cattle industry. /Chapter 3 describes the region studied and the characteristics of its agricultural production.. I. Chapter. 4. discusses the mOdeling. specifications and procedure. Part 11 details the Northern or Costa modelo. Chapters. 5 through 9 cover the land allocation and modernization decisions component, the agricultural production component, the price generation component, policy entry points and the criteria and general accounting component. Part 111 looks at testing and validation procedures and results.. Chapter 10 discusses data needs and the processes. of tuning the model to track time series of recorded behavior. The results and implications of sensitivity tests on model parameters are presented in Chapter 11. Part IV discusses policy applications of the model, conclusions and areas for further work.. Chapter 12 presents. the results and analyses of runs experimenting with various cattle development policy options.. Experiments include an. investigation of the sensitivity of policy results te changes in certain parameter values.. Finally, Chapter 13 presents. summary and conclusions, and outlines areas for further work in refining, improving and extending the modelo.
(22) CHAPTER 1 SCOPE AND NATURE OF STUDY Agriculture in the Colombian Economy Although agriculture is Colombia's main economic activity, its rate of growth during the last two decades has been lower than that of the gross domestic product (GDP). In 1969 it contributed 30 percent of GDP but its share in the national output has been declining as industrialization has proceeded.. Nevertheless, agriculture continues to be. the main source of employment with over half the Colombian people directly depending on it for their living. Within the agricultural sector, livestock production occupies about 87 percent of all agricultural land, accounting for about one-third of agricultural output, or approximately 10 percent of GDP.. Beef is the primary producto. But despite the agricultural industry's importance, the production of basic food crops has barely kept pace with a 3 percent population growth rateo. Cattle slaughter. per 1000 inhabitants has been declining since 1950. Colombia's economic growth has been responsive to changes in the performance of the export sector and this tlas been dominated by agricultural exports wbich accounted. I'nr' '7fl pel'cc!lt of' total f'oreie;n. 3. earnlng:t~. In 19'70.. WhUe.
(23) 4 cofree has remained the country's major export, its shRrp of the total value of exports has declined from 7? percent in 1960 to 61 percent in 1970.. As a proportion of all agri-. cultural exports it has declined from over 90 percent prior to 1965 to 75 percent in 1969 [41].. But Colombia's dependence. on agricultural exports which have unstable world markets. Ce.g., coffee, bananas, sugar and cottonl has undesirable disequilibrating effects· which jeopardize development efforts and create the necessity of finding new sources of foreign revenues.. The development of the beef industry, for which. the outlook in world markets is considered brilliant, will accomplish the aims of increasing the domestic supply of protein for an improved diet and of helping remove both the foreign exchange and instability constraints. Yet in order to fully exploit the natural comparative advantage Colombia has for cattle raising and make it a leading industry that is competitive in world markets, a great effort has to be made to overcome the traditionalism that has characterized the industry and to supply the necessary inputs for modernization. In recent years the Colombian government has revised its policies toward the cattle industry and reoriented them toward the attainment of increased beef production.. These. policies have been associated with credit and technical assistance, disease control, land ownership rights, taxation and export subsidies..
(24) 5. The Colombian government has given priority in the cattle development program to the Atlantic plain of Northern Colombia because of that region's favorable natural conditions, its accessibility to domestic and foreign markets, and the fact that it has the largest share of the country's cattle population.. This also supports the decision to focus the. present study in this geographical region. Need for This Study Since catt1e production is not merely an important economic activity but the only practical use for millions of hectares of agricultural land not suitable for crop production because of soil conditions, climate, floodings and/or distance from markets, its performance is and will be an important factor in the success of Colombia's efforts to foster sound economic growth in agriculture. Because of its size, probably future demands for its products and the need for improved operation, the Atlantic plain beef production system's performance has had and will have a significant impact on Colombia's agricultural economy. Several studies have been done on various aspects of the Colombian beef production and distribution systems. General descriptions of the industry and analyses of current and proposed policies have been done by Riley [61J, the Food and Agriculture Organization (FAO) [66J, -the Caja Agraria [6J, the World Bank [42J and the Instituto Colombiano Agropecuario [31J.. Production problems and projections have. been recently analyzed by Henning [29J, Von Oven [60J, and.
(25) [67J.. Atkinson. Bowser. [5J attempted to make production pro-. jections by regions and establish surplus snd deficit areas under two systems of management.. Daines. [68J is attempting. to incorporate the cattle subsector into a broader sector analysis of Colombian agriculture. More specialized studies on diseases and reproduction problema have been done by the Instituto Colombiano Agropecuario (ICA) and Gomez, respectively [31, 24J.. Slaughtering, market-. ing and opportunities for exporting have been studied by Anderson (2), Booz, Allen and Hamilton [4J, Secretaria de Agricultura de Antioquia. [64J, and Garcia Samper [23J.. Profitability studies have been done by the World Bank [42, 43J, Federacion Colombiana de Ganaderos (FEDEGAN) [20J, and Instituto Colombiano de la Reforma Agraria (INCORA) [34J.. More recently, the Centro Internacional de Agricultura. Tropical (CIAT) [9J made a survey of the cattle industry in Northern Colombia in an attempt to gather basic information and identify specific problems which are in need of further research. These have mostly been descriptive studies, and when projections are included they are trend-like, straightforward, algebraic estimates.. The credibility of these estimates has. always been questioned because of their reliance on timeseries data which deserve a low degree of confidence.. Yet. they have served the purpose of providing background information about the cattle industry and a basis, though weak, for planning its development.. But except for the Bowser, FEDEGAN,.
(26) 7 and the CIAT studies, no attempt has been made to place the cattle industry in a regional context and assess the effect through time of alternative strategies of development on the attainment of a multiplicity of objectives such as employment, farro income, government revenues, foreign exchange earnings, and others without neglecting the interactions with other subsectors of the agricultural economy. This dissertation is an attempt to integrate the available information into a computerized model that will provide the poliey maker with a more informed basis for planning development strategies for the Colombian beef produetion system on the basis of the learning experienee from the Northern region.. The basie parameters and struetural. relationships estimated in this study ean be utilized in the future for modeling the cattle industry in other Colombian regions, and/or for developing a broader regional model of Northern Colombia. This study has gained from experience with other simulators of cattle population and related activities developed for Nigeria, Korea, Northeast Brazil and Venezuela [53, 62, 51, 55J.. The cattle population simulator developed. by the World Bank [43J also has provided an invaluable experience. General Systems Simulation Approach as a Tool for Geef Po11cy Analys1s l'n. rl~c~nt. ypat'~~. t,}¡Pl'C. has. bl:~cn. an Incl'ea::;lng 1ntcr-ect. in the utilization of the systems approaeh for analyzing.
(27) 8 complex developmental problems.. Computeri ?ed techrdclu,'". llave hc'lped automate the haml ealculatlot1 pl','e,';'," m"l "'\,:lll<l the range of alternatives which can be examined.. Policy. makers and researchers ha ve been placing more confidence and credibility on the general system simulation technique as its methodology and approaehes for development have been better understood and developed [25, 46, 47J.. PUblie and. private decision makers have been presented with an approach that attempts to build a general model to trace the consequences through time of following alternative courses of action based on at least as wide a range of kinds and sources of data and information as deeision makers use without specializing in any one teehnique to the exclusion of tech/. niques frequently used by decision makers./ln addition, the approach carefully avoids premature applieation of maximization teehniques in situations where decision makers realize that the multiplicity of goods sought and bads avoided has not yet been redueed to a common denominator.. These eharac-. teristics make the generalized, systems-science simulation approach very similar, though more comprehensive and complex, to the descriptive and paper-and-pencil and desk-calculator projections which have maintained a high level of credibility among decision makers [47J. J Researchers have been provided with a technique for analyzing the problems of development without the methodological and theoretieal restrictions of more specialized techniques such as simultaneous equilibrium equations,.
(28) 9 linear programming (LP), benefit/cost ratio analyses, internal rate of return analyses, etc.!!. And as new con-. cepts and experiences regarding the formulation and implementation of systems approaches have evolved, many of the early objections of statisticians concerning the reliability of the estimates of parameters, criterion variables, and prescriptions by users of the systems analysis are being dissipated.. The analogy between the general systems analysis. simulation approach and the Bayesian approach to inference has been demonstrated by Ladipo [50J, and Johnson [47, 49J has analyzed repeatedly the possibility of empirically validating and verifying the normative concepts involved in simulation models. Econometric methods with probabilistically estimated parameters rely heavily on time-series and cross-sectional data not always available in developing countries.. These. techniques also tend to be specialized on linear equations and behavioral assumptions involving maximization in accordance with neoclassical theories of the firm and household; the economic forces that link the various components of an economy are assumed to be self-equilibrating as a consequence of the maximizing activities for entrepreneurs and consumers. However, the validity of these two assumptions has been challenged where the findings of these kinds of studies were to. !/For a more detailed discussion of various specialized techniques see Manetsch, et al., [53J. For particular applications to the Nigerian cocoa industry see ChODG ~~..
(29) 10 be used for policy analysis and prescriptions [53J.. These. and other methodological difficulties often result in less reliable parameter estimates than available from alternative kinds and sources of data and information with less sophisticated estimation and approximation techniques. Linear programming and benefit/cost ratios and internal rates of return are other specialized techniques which have gained considerable prominence in recent years. LP is always used in an optimizing mode in solving the problems of resource allocation and policy analysis.. The other. two techniques have been used more for project analysis than for analyzing alternative policies and programs.. Basically,. all these techniques suffer from a need for a common denominator among the goods being sought and the bads being avoided. Moreover, the approach is quite mechanistic and may not allow rigorous analysis or interaction between researchers and policy makers needed for a better understanding and improving of the system. A consideration of the distinctive attributes of the various approaches employed for studying development alternatives in a variety of less developed settings has led to the present proposal to use the system simulation approach as a tool for development planning and poliey analysis of the eattle industry in Northern Colombia. The general systems simulation approach, following the principles of the seientific method and problem-solving research, is viewed as an iterative problem-solving process.
(30) • 11. that includes problem formulation, mathematical mOdeling, refinement and testing of a computerized approximation of the mathematical mOdel, and creative design and execution of simulation experiments intended to provide answers to the questions being asked by the decision makers involved. l / The general system simulation approach has been specially applicable for solving many of the problems of economic development which do not meet the requirements for applying the simple maximizing computations of static production, consumption and welfare economics.. As decision. makers seek so many different goods and avoid so many different bads in developing the economy, it is very difficult for them or anyone to find a common denominator to be maximized or minimized.. Problems of ordering and imperfect. knowledge about future consequences of present actions complicate the circumstances in which decisions are made.. Yet. reaching prescriptive conclusions to solve development problems requires development of positive and normative knowledge. The methodology used in the general system simulation approach allows the system analyst to maintain a philosophic orientation sufficiently flexible to permit analysis of Questions involving both the normative and the nonnormative values always present when considering the goals of economic development.. l/For more detailed discussion of the philosophy and methodology of the general system simulation approach for problem-solvinr; research, see Manetsch et al., [531, Abkin rll, and Rm,smlller et al., [621..
(31) 12. There are four distinguishing features of the general system simulation approach particularly useful for the policy analysis of the Colombian beef economy.. First, it is a. generalized approach which makes use of a wide range of primary and secondary information from many sources including surveys, government records, experiments, business records, qualitative judgments and insights of subject matter experts, and descriptive work about the beef industry from various disciplines.. Also a wide variety of specialized. techniques are used from econometrics, linear programming, partial budget, project analysis, etc.. Since the research. and model-building process is iterative and flexible, new information can be incorporated easily as it becomes available, and the structure of the'model modified accordingly. Second, the system approach can incorporate many types of functional relationships into the model to closely reflect the current or potential real system.. These include. dynamic interactions, curvilinearities, discontinuities, time 1ags, probabilities and irreversibilities. Third, the approach does not have to assume Cbut does not prec1ude) any profit or uti1ity maximizing producers and consumers, or any self-equilibrating economic adjustments.. It does not necessarily involve a unique set of. optimizing solutions based upon a common objective or a predetermined singular goal, which does not exist in reality. In contrast, the approach is more guided by the problem under investigation..
(32) 13 Fourth, the system simulation approach provides an experimental setting for exploring the consequences of a wide range of alternative plans or managenent strategies. •. that ultimately will assist policy makers in determining the best course of action.. Decision makers may be shown the. consequences of aIternative courses of action in terms of what goods or bads will be received by or imposed upon groups of people, when, and in what quantities.. After such projec-. tions are available, interaction among investigators and policy makers will lead to a better understanding of the trade-offs among the numerous goods and bads involved in the solution of the problem.. DeveIoping, extending and. refining knowledge on the various goods and bads and learning about the trade-offs is a way of solving the problem of finding an interpersonally valid common denominator.. As. stated earlier, this problem has contested the usefulness of the approach used by sorne quantitative techniques of analysis in examining the problems of economic development. Further, in the iterative process, decision makers and investigators can work interactively to solve the remaining two major theoretical difficulties found in the analysis of deveIopment when using sorne other problem-solving techniques.. First, the sequence in which different action pro-. grams should be undertaken can be estabIished, thus resolving the problem of how programs and projects (actions) can be ranked.. Then, when consequences of alternative decision. rules can be projected and studied, it is possible to develop.
(33) a basis for choosing the best rule among the alternative courses of action being considered.. This solves the planners'. problem of choosing a decision-making rule, especially under conditions of imperfect knowledge and uncertainty. Purpose and Objectives The purpose of this thesis ls to develop a model to help evaluate policy decisions that might be made in expanding the production of beef in Northern Colombia through time.. More specifically, the objectives are: 1) To develop a credible simulator that could eventually be extended to other beef producing regions and be further integrated into a national modelo 2) To use the simulator a) to analyze the effect of new productlon methods on the output of cattle; b) to analyze the effect of production incentives on the decision of farmers to adopt the new methods; c) to estimate the effect of the expanded regional production on the income of farmers, government revenues, domestic beef consumption and sustained l~vel of exports. The procedures used in meeting these objectives will. be discussed in Chapter 4..
(34) CHAPTER 2 A GENERAL DESCRIPTION OF THE COLOMBIAN CATTLE INDUSTRY The characteristics of cattle raising in Colombia described in this chapter will help in understanding the multiple problems affecting the industry. Stock farming in Colombia is carried on in a variety of climates and ecological zones that give rise to a wide range of problems which limit beef yields and supply.. The. principal limiting factors are the heavy incidence of animal diseases, malnutrition, deficient marketing and slaughtering systems.. Besides the technical factors, government decisions. that affect the political, social, and economic environment also ha ve a major effect on the industry's behavior. Size and Location of Cattle Industry Of the 114 million hectares in Colombia, only about 40 million are suitable for erop and livestoek production; the remainder is under forest or is wasteland.. Cropland. occupies approximately 5 million heetares, which leaves 35 million hectares under livestock.. Even if crop acreage. increases at 7 percent per annum during this decade, whieh would be very rapid vrowth, there 8t11] would he 10 m1JJ1on 1lectnrc~1. i. ne;.. 'I'he. in ¡<li10 with no pY'artlcaJ aJternntlvp use bu\;. ¡~ra7,. na tion has the choice oí' produc ing ca tt le on this 1'3.
(35) are the only scaree lnputs used by the livestoek subsector; thus cattle produetion ls not currently a competitor with crops for scaree land. Although statistical data are not extremely reliable, Colombia supports about 20 million head of cattle, including sllghtly more than 17 million beef animals.. The rate of. increase in cattle numbers has been low, about 2 percent per annuro over the period 1950 to 1969. has been close to 3 percent [41J.. Sinee 1956, the rate Although Table r.l shows. that herd numbers increased at about 4 pereent per annum over the period 1965 to 1969, rCA [31J has projeeted an average rate of growth of 3 percent annually for the next five years. The majority of beef cattle are maintained in tropical zones which have been divided into five clearly differentiated produeing areas (Figure r.l).lI 1) The Atlantic Coast at an altitude of between O and 500 meters includes Cordoba, Bolivar, Atlantieo, Sucre, Cesar, Magdalena, Guajira, and Northern Antioqula. Average temperature exceeds 24°c and annual rainfallvaries between 250 mm and about 2000 mm. Cattle population ls approximately 7.6 million head and are a in pasture 9.7 million heetares.~ l:./Max F. Bowser, "Prerequisitos y Potencial para la Exportacion de Carne en Colombia en la Decada de 1970," Agricultura Tropical, XXV (Bogota, Nov., 1969), 679.. ~/Cattle population and area in pasture for regions 1, 2, and 3 are taken from Caja Agraria [6J; for region 4, from Bowser, lbld., 684; and for region 5 from rCA [3lJ..
(36) 17. oc ean. Venezuela. Brazil. !KEYI 1. ATLANTlC COAST. II CENTRAL & UPPER MAGDALENA III CAUCA VALLEY IV EASTERN PLAINS. V. SOUTHERN ~[l}UH~~. Peru VALLEY. REGION. 1.1.. Colomhia--tne five beef cattle producirlg regions..
(37) 18 2) The Central and Upper Magdalena Valley at an altitude of les s than 1000 meters includes Central and Southern Antioquia, Eastern Caldas, Tolima, Huila, the Santanderes, Central and Western Boyaca and Cundinamarca. Average temperature exeeeds 24°C and average rainfall varies between 2000 and 4000 mm. Cattle population i8 approximately 4.3 million head and area in pasture i8 5.6 million heetares.. 3) The Cauea Valley at an altitude of les8 than 1100 meters ineludes Valle, Cauea, and parts of Caldas, Risaralda and Quindio. Average temperature exeeeds 24°c and annual rainfall varies between 1000 and 2000 mm. Cattle population i8 approximately 1.25 million head and area in pasture is 1.2 million hectares. 4) The eastern plains at an altitude between 500 and 1000 meters inelude Meta, Eastern Cundinamarca, Eastern Boyaea (Casanare), Arauca, Viehada and Guainia. Average temperature exceeds 24°C and annual rainfall varies between 2000 and 4000 mm. Cattle population is approximately 1.5 million head and area in pasture is 16 million heetares.. 5) The South, at an altitude of less than 1000 meters ineludes South Eastern Nariño, Caqueta, Putumayo, Amazonas and Vaupes. Average temperature exceds 24°c and annual rainfall varies between 1000 mm and 4000 mnl. Cattle population is approximately .69 million head and are a in pasture is 3.5 million hectares. Production and Marketing Systems Cattle produetion in Colombia is an extensive operation depending almost exclusively upon pastures as a souree of feed inputs.. Limited amounts of feed eoncentrates are. being used in the more intensive dairy operations, and there are a few cases of eonfined feeding of steers. For the nation as a whole, the average carrying capaeity is about 0.57 head per heetare, but there are wide differences in eapacity among the various elasses of pastures.
(38) 19 TABLE 1.1.. Catt1e Numbers in the Nationa1 Herd and Export of Live Anima1s, 1960-74. (1000 head). Year. 1960~ 1961 1962 1963 1964 1965 1966 1967 1968 1969 19702.1 1971 1972 1973 1974. No. of Catt1e. Change in Inventory. 15,329 15,679 15,979 16,279 16,584 16,882 17,372 18,082 18,830 19,576 19,742 20,33 4 20,99 4 21,573 22,328. 529.0 350.0 300.0 300.0 305. O 298.0 li90.0 710.0. 748.0 746.0 166.0 592.0 660.0 579.0 755.0. Registered Exports. 3.1 21 76.0 58.4 19.8 19.1 58.3 125.8 191. 7 di 2l¡S.0_ 282.0 329. O. Cattle inventories between 1960 and 1969 are from World Bank Report [41J. ~/. Exports between 1964 and 1971 are from Sarmiento [63J.. Si Cattle inventories between 1970 and 1974 are projections by ICA [31J.. Exports between 1972 and 1974 are low target projections by Instituto de Comercio Exterior, INCOMEX [35J..
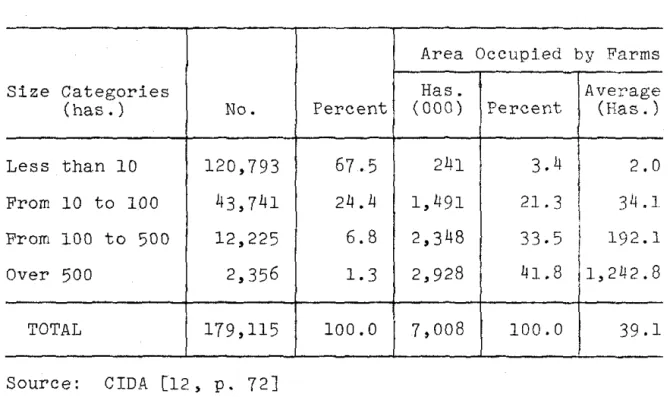
(39) 20. and regions.. The artificial pastures whicb nm],p up abouL. one-third to two-fifths of the total pasture area [61, 66J have the greatest carrying capacity: per hectare under good management.. about 2.0 to 2.5 head These pastures have a. carrying capacity 3.5 to 4.5 times greater than that of natural pastures. The highest stocking rates are in the Costa departments:. 1.35 to 1.45 head per hectare; sorne of the lowest. rates are in the Eastern Plains (Los Llanos) where a breeding cow and her calf are carried on up to 10 hectares.. In the. Magdalena and Cauca Valley regions the stocking rate varies from 0.74 head to 1.00 head per hectare. The national beef herd has been derived from "Criollo" breeds which sti11 account for approximately 20 percent of the total.. The remainder have been upgraded from "Criollo". by Cebu (most1y U. S. type Brahma) for up to three or four generations.. The hybrid vigor of the first eros ses and the. adaptability of the Cebu to tropical conditions contributed to the popularity of this breeding practice. The size of producing units varies widely although accurate statistics on herd size distribution do not existo Large units exist in the Atlantic Coast, Eastern Plains and South regions while in the mountain areas of Central Colombia there are many small units with les s than 10 head of cattle per farm.. Sixteen departments surveyed by the Departamento. Administrativo Nacional de Estadistica (DANE) [14J in 1960 had 98 percent of the cattle in herds of less than 200 head..
(40) I~. 21 As various measures of productivity show, the technical efficiency of the Colombian cattle industry i8 low.. The "extraction rate," which is the proportion of the. cattle inventory extracted for domestic slaughter and exportation, is approximately 13 percent annually.. This extrac-. tion rate compares with 40 percent in the United States, 29 percent in Australia and 24 percent in Argentina. The calving rate (number of calves born as a percent of females of breeding age) is undoubtedly very low.. The. estimates of the national average calving rate range from 50 to. 70 percent as compared to 80 to 90 percent in countries. with well-developed cattle industries. Death losses are relatively high, averaging at least. 8 percent ayear for all cattle.. Losses are greatest among. calves where mortality rates are often 20 to 30 percent or more during the first few months after the calves are born. The average growth rate is very low; slaughter age i8 about 4 years, although sorne of the better growers now market steers at 3 years of age.. This is still high compared. to the average marketing age of 1.5 to 3 years common for slaughter steers in the United States.. Steers from La Costa. are slaughtered at about 450 kg. live weight while Los Llanos steers average 390 kg. Yield per animal slaughtered, in relation to the live weight of the animal, is barely 50 percent, as compared with. 58 to 60 percent in countries where types specially bred for the production of beef are prevalent.. Beef yields per hectare.
(41) 22 and per animal are also low when compared with other countries. Von Oven [60J, reported live weight yields per hectare of 62 and 11 kilograms for the Costa and Eastern Plains, respectively, as compared with 90 kilograms for the Buenos Aires provine e in Argentina.. Live weight yields per animal unit were. 83, 40 and. 117 kilograms for the Costa, the Easter Plains and the Buenos Aires province, respectively. Mortality and performance at all stages of g!'owth are affeeted materially by inadequate health control measures. Major di seas es or parasites which cause mortality or losses through the falling-off in production among the animals affected are endemic foot-and-mouth (types A and O), rabies, anthrax, brucellosis, septaecemia, ticks and tick-born fevers, blaek leg, screw worms, and a great variety of internal parasites.. Although effeetive control measures that could. be applied in Colombia exist for most of these diseases, treatments are not a common practice. Since it first appeared in Colombia in 1950, foot-andmouth disease has caused significant losses that have been estimated by the Instituto Colombiano Agropeeaurio--ICA-at Ps. 332 million annually [31J.. These losses are produced. by death, reduced weight, retarded maturity, reduced milk production, and culled animal s because of severe health injuries.. Furthermore, foot-and-mouth disease constitutes. an obstacle to trade between affected and immune areas, and precludes livestock and meat exports to countries which are free from the disease or on the way to eradicating it..
(42) 23 Brucellosis, or infectious abortion, is next to footand-mouth, among infectious and/or contagious diseases, in causing the heaviest livestock losses.. Brucellosis affects. about one-fifth of the cow population (1,136,000 head), and about 2 percent of the stud bulls (9,600 head) [31J.. Losses. in 1967 were estimated at Ps. 177.5 million and consisted of sorne 136,000 miscarriages, permanent sterility in about 22,700 cows, impossibility of using 9,600 sick bulls, deaths of about 5,500 cows, and permanent loss of milk in the affected cows. Losses due to parasites are probably equal to or greater than estimated los ses due to disease.. In many. instances an animal may be sufficiently weakened by parasites to readily succumb to identifiable diseases.. The incidence. of internal parasitosis is enormous, especially among calves; los ses may run as high as 15 to 25 percent.. External para-. sitosis is a disease almost entirely confined to animals in the subtropical and tropical zones, where it affects 75 percent of the stock.. External parasites cause heavy los ses. by retarding growth, raising the mortality index and damaging the hides. Cattle production and yields are also limited by problems of nutrition.. Seasonal fodder shortages coupled. with deficiencies of mineral s and vitamins lead to the diminution of milk and beef yields, to retarded growth and to death in some cases.. Furthermore, the reproductive. functions are affected, sometimes so seriously that the.
(43) animals become infertile or fecundity is reduced; and this in turn greatly lowers the birth rateo. Gomez [24J reported. up to 20 percent of cows between 2 and over 10 years of age as having permanent infertility, with trophic problems (associated with nutrition) as responsible for 85 percent of the cases. In addition to seasonal shortages, forage production is aggravated by the underdiversification of pastures and the absence of satisfactory rotation practices.. Little. attention is devoted to the management and care of pastures and they often deteriorate greatly. Obsolete and even primitive practices which prevail in many stock farming activities are responsible for the majority of drawbacks and deficiencies found in cattle production.. Most stock farmers are slow to adopt new techniques,. and absenteeism on the part of landowners aggravates herd mismanagement and intensifies the managers' and herdsmens' tendencies to stick to traditional routine practices. But husbandry deficiencies are not the only examp1e of poor management.. Most ranchers do not keep accounting. and production records and have scanty, imperfect knowledge of supply and demand trends as well as of the market situation. Defective management and extensive methods offer few opportunities for employment and higher salaries. intensity in cattle production is. Labor. 3 man-days per head-year. or 1.71 man-days per hectare-year as compared with 50 to.
(44) 25 65 man-days per heetare-year for most annual erops and with 120 to 300 for most vegetable and fruit erops [69J. Daines [70J gives another measure of the low labor intensity and high investment requirements to generate new employment in livestoek.. In livestoek1/ labor is 1.0 to 4.3. pereent of total eosts as eompared with 20 to 68 pereent for rnost erops.. And it takes from 6,300 to 26,255 dollars of. investment to generate a new direet man-year of employment in livestoek as compared with 300 to 3,270 dollars for rnost erops. The failure of the supply of livestock commodities te react to the high demand elastieity by which they are eharaeterized is attributable not only to produetion difficulties but also to the problems ereated by eurrent marketing systems.. The deficieneies affeeting the rounding-up and. transport of livestoek, as well as slaughter and beef di stribution, are manifold. The marketing system is extremely fragmented; many small buyers and cornmission agents serve the ranchers, and there are many slaughterhouses, many agents placing meat in slaughterhouses, and many small stores selling meato. Most. animals are bought on the farm, and are usuaIly purehased with little eonsideration of weight or quality. shipped direetly to "ferias" througheut Colombia. and. oft~n. Cattle are. or stoekyards, whieh are located. Medellin 1s the most 1mportant market. sets the price standard for the country.. l/IncIudes wool, eggs, poultry, pork and beef..
(45) The high cost of transporting livestock has been and will continue to be one of the most serious marketing problems confronting the industry.. Serious losses of weight. occur during on-the-hoof movements.. Cattle trailed for long. days--from the Llanos for instance--lose up to 15 percent of their weight, in addition to which mortality must be taken into account.. Severe weight los ses are also registered in. animals taken by boat; in some cases the time. betwee~. the. departure from the farms, arrival at the port of loading and transport to the place of destination may be as long as 15 days or longer.. Although truck and rail transport cause. fewer losses, these means are deficient and costly and the animal s are badly mishandled in transito Methods of slaughtering and slaughterhouse services are extremely old-fashioned in most municipalities.. Condi-. tions are unhygienic, and as a general rule there are no veterinary services for proper inspection of the cattle on the hoof and the meato. One of the chief drawbacks i8 too. many small slaughterhouses where the volume of operations is not large enough to finance the equipment, construction and services which would be required for efficient organization. Only about 5 percent of the slaughterhouses are located in major cities and provide technical and hygienic services. Among other serious deficiencies in the slaughter of livestock and the handling of meat are the inefficient utilization of slaughter by-products and the lack of. '..
(46) 27 refrigeration facilities, even in torrid climates where meat spoils in a very few hours. Prices of cattle and beef have been rising with the general inflation that has prevailed in Colombia for several years.. Prices of cattle at the ranch, on a 1iveweight basis,. were approximately 5.17 pesos per kilogram in early 1970, equivalent to U. S. $0.28 per kilogram liveweight.. Deflated. consumer beef prices ha ve increased by 18 percent from 1964 through 1969, while prices at the ranch only increased by 13 percent [41J. In addition to the rising secular trend, beef prices show both seasonal and cyclical variations with cycles averaging about seven years in length.. Seasonal price fluctuations. are caused directly by the occurrence of dry seasons and the lack of irrigated pastures and forage storage. Until 1964 the officia1 exports of 1ivestock products were negligible, but have since shown substantial increases. In 1970, these exports reached over U. S. $21 million [63J. In 1974 livestock exports are expected to range between a low target of U. S. $51 and a high target of U. S. $107 million [35J. Exports of beef (frozen, refrigerated and chilled), viscera and processed meat have been increasing in importance. Estimated values for 1971 were U. S. $9.4 million for beef and U. S. $0.17 million for viscera and processed meat as compared with U. S. $2.4 million and U. S. $1.08 thousand in 1965, respectively..
(47) 28 Peru has been the mcst important market for live. Venezuela.. Illegal exports of live animals, predominantly. to Venezuela, have been estimated between 100,000 and 300,000 head annually.. Spain, Peru, the French Antilles and French. Guiana have been the most important markets for beef. Beef Consumption Registered or controlled slaughter in 1970 was 2.366 million head, but total slaughter was estimated at 2.603 milI ion head after increasing the former by 10 percent to account for unregistered or clandestine slaughter [63J.~/ Although the trend in cattle slaughter has been upward, there ha ve been significant variations [23, 61J. From 1954 to 1957 slaughter increased 27.5 percent and then turned downward during 1958 and 1959. increased again by 30 percent.. From 1960 te 1964 it. Frem 1965 to 1968 slaughter. decreased by 3.3 percent and then turned upward again during the next three years. Slaughter of male cattle f1uctuates les s than that of females and averages about 60 percent ef total slaughter. Female slaughter averages about 40 percent of total slaughter and has ranged from 34 percent in 1954 to 44 and 43 percent in 1951 and 1965 respectively [16, 61J.. Consequent1y, the. year-to-year variations in total catt1e slaughter ha ve been l/ThiS refers to domestic consumption. Official statistics usually include registered exports of beef and live cattle..
(48) 29 largely due to changing policies of farmers who withhold females for breeding purposes.. Apparently, accumulation. and liquidation phases in the cattle cycle are completed, on the average, every seven years. The trend in per capita consumption of carcas s beef has been slightly downward due to the more rapid rate of growth in the human population than in total beef production. Registered cattle slaughter decreased from 123 head per 1000 inhabitants in 1951 to 110 head in 1970.. Per capita con-. sumption decreased from 29.6 kg. in 1951 to 22.4 kg. in 1970,11 but when unregistered slaughter is considered, per capita consumption in 1970 increases to 24.6 kg.. Yet, unequal. distribution of income aggravates the nutritional problem, leaving peasants and low income urban groups with a consumption of 18.0 or les s kilograms [31J.. Undoubtedly beef con-. sumption by the mass of the population is below the recommended nutritional requirements set at 28.0 kg. [9J. Increases in domestic demand will depend on population growth, per capita income and income and price demand elasticities.. Assuming no price changes, domestic demand. is expected to grow at approximately 4.8 percent annually [31J.. This assumes an income elasticity of .6, and annual. rates of growth in popu1ation and real income per capita of 3.2 and 3.0 percent respective1y [31J.. ·!/l~~}t,lJn"lt(:-. bél~){'d nn an overalJ dr'e~~f)(~d caf'(~as~; :IVt'I':I¡';t'. nI' ;'i1(t kl",..
(49) 30 Ri1ey [61] and lCA [31] have projected domestic consumption in 1975 using different estimates for the average consumption per capita.. According to Ri1ey, if per capita. consumption remains at 23.75 kg. annua11y--the average for the 1958-60 period--domestic consumption in 1975 wou1d be 571 thousand tons or a 64 percent increase over the 1958-60 average of 347 thousand tons.. If per capita consumption. rises to 29.06 kg., domestic consumption wou1d doub1e the base period average.. The ICA estimate shows that if per. capita consumption is 25.9 kg. annua11y--the average for 1964--domestic consumption wou1d increase to 640 thousand tons by 1975 or about 85 percent over the base periodo The parameters determining the rate of growth in demand and the estimates of domestic consumption suggest the need for we11 coordinated government po1icies if the goa1s of improved nutrition, production incentives and increased foreign exchange are to be attained.. If beef supp1ies are. not increased substantia11y, the income of the lower income group is not raised, or beef substitutes are not avai1ab1e, 1arge numbers of the population wi11 continue to be undernourished. Nationa1 Po1icies Toward the Catt1e Industry Taxation.. Incentives for beef catt1e production in. Colombia are crucia11y affected by government po1icy.. Catt1e. raising is subject to the same income and comp1ementary taxes (net worth and excess profit) as any other economic.
(50) 31 activity.. But certain special provisions by which costs. and income are computed favor the cattle producing taxpayer. The essence of this tax pollcy relates to the cost basis on which profits are calculated.. For tax purposes.. the cost of livestock sold is the purchase price only if acquired during the tax year.. If cattle are sold in the. year following that of purchase. then the approxlmate market value at the end of the previous year is taken as the purchase price.. The difference between the purchase price and the. assessed end-of-the-year market value is treated as an increase in capital and is not subject to income tax. The tax policy ls also designed to encourage ranchers to engage in breeding actlvities or to hold females rather than males in inventory to build up the national cattle herd. A net worth tax exemptlon and two taxes support thls policy. The first is a slaughter and export tax whlch differentlates between the sexes:. 50 pesos per head for males and 100 pesos. per head for females.. The second is a selective inventory. tax equivalent to the value of 4 kg. 11veweight per head which applies only to males over one year of age. of this tax varies froID year to year.. The amount. In 1971 it was 18.40. pesos per head. A final element in government taxation of the livestock industry is a general inventory tax.. Any individual. or corporation whose investment in livestock exceeds Ps. 15.000 at the close of any year from 1959 through 1980 is subject to a levy of 1 percent on the net investment..
(51) 32 Taxpayers who elect to subscribe for shares of Banco Ganadero and the Fondos Ganaderos at par, in an amount equal to the total tax due, are exempt from cash payment of the tax. This is in fact the customary form of payment, and it provides an important part of the capital of these credit institutions. A property tax of 4.2 milIs on the assessed value of land is also levied on the cattle subseetor.. Additional. surtaxes of three and two milIs are levied on assessed properties in the areas eomprising the Corporaeion Autonoma Regional de Valle del Cauca (CVCl and the Corporaeion Regional de la Sabana (CAR),lI respeetively. In 1971 the Colombian Government proposed the use of presumptive techniques for a more effective income taxation of agriculture, and finally in 1972 passed a law for approval by Congress [56J.. Now, cadastral value of the land alone. serves to assess farm income. cadastral value is used:. Yet only a proportion of the. (1) 50 percent for permanent crops. and cattle raising, (2) 75 percent for temporary crops, and (3) 80 percent for annual crops.. The presumed income is 10. percent for all erops and cattle fattening, 4 percent for eattle breeding,~1 and is also subjeet to the normal progression of the ineome tax.. The reformed tax law also phases. lIThese are regional development corporations with headquarters in Cali and Bogota respeetively.. ~I Javier Ayala, "Nueva Propuesta Sobre Ley Agraria," El Tiempo, (Bogota) January 20, 1972, p. l..
(52) 33 out the special inventory tax on males and provides tax incentives on reinvestments in the farm.. Fifty percent of. farm income in excess of the presumed income is exempted from taxation if reinvested during the year fOllowing the fiscal year. Land Reform.. Large holdings and extensive methods. in cattle raising have made grazing lands an easy target for expropriation and land distribution schemes.. Under the. provisions of Law 135--the agrarian reform law--most pastoral estates are considered inadequately utilized and could be expropriated at the least favorable terms. With the increasing need for farm products, and considering that threats of expropriation have discouraged long-term investments and hampered agricultural development, the government in 1971 undertook a major revision of Law 135. The revised law,lI now pending approval by Congress, provides for more protection against expropriation of adequately utilized farms and for more favorable compensation terms if expropriation occurs. The designation of farms as adequately utilized has been tightened; it now includes, among other things, the attainment of minimum levels of productivity, and the improvement of the level of living of the workers employed by the landowner. Cash payments for adequately utilized farms have been increased to 40 percent of the land value if the value.
(53) is 500,000 pesos or less, with this proportion decreasinf gradually as the total land value increases.. The balance. will now be paid in five years with interest bearing and negotiable government notes. Credit.. Government direction of agricultural credit. is carried on through a complex of official rediscount facilities, reserve requirements and direct legislation. The Monetary Board, appointed in 1963, has legislative control of the banking system and is responsible for setting legal reserve requirements, interest rates and term of loans. Lending to the agricultural sector has been growing faster than in the economy as a whole.. But within the agri-. cultural sector, livestock increased slower than the growth in overall credit in the economy [41J.. The livestock. portfolio's share of the total has been relatively constant, reaching a low of 18.3 percent in 1966 from a peak of 21.7 percent in 1963.. Over the period 1958-1967 the livestock. portfolio averaged 19.5 percent of the total portfolio. Among legislative measures, Law 26 of 1959 has increased the supply of credit to agriculture and strengthened the activities of the Banco Ganadero and Fondos Ganaderos through allocation of the general inventory tax.. These. credit institutions which specialize in livestock development, must loan not less than 70 percent of their funds for breeding and growing.. The law also requires that commercial. banks loan not less than 15 percent of their deposits for agricultural purposes..
(54) 35 At present, the Caja Agraria and Banco Ganadero are the two most important sources of credit to livestock producers.. In addition, commercial banks are required by. law to lend 15 percent of their deposits to agriculture, including loans for livestock development.. In 1967, the. Caja Agraria held 47.9 percent of the livestock portfolio; the cornmercial banks 30.0 percent; Banco Ganadero 18.6 percent; and Banco Popular. 3.5 percent.. Institutional credit is available to cattle producers at varied interest rates and terms.. In general, interest. rates charged to small and medium producers range from 8 to 12 percent annually, which are below the current commercial rate of 14 percent.. Interest rates charged to large producers. are more in line with the commercial rateo Terms for repayment vary greatly according to the purpose of the loan.. For fattening activities terms do not. exceed one year, while for breeding and land improvements terms range from three to twelve years.. Grace periods from. one to four years have been introduced to accommodate better the repayment obligations to the slow return from investments characteristic of the cattle industry. Special funds from foreign and domestic sources are administered by the Caja Agraria and Banco Ganadero as part of the overall cattle development plan.. Small cattle pro-. ducers within the INCORA-supervised credit programs receive loans, mostly in kind, from the Caja Agraria and Banco Ganadero.. The Caja-INCORA scheme is financed by a loan from.
(55) AID to INCORA, and funds for the Banco INCORA's Fondo Rotatorio.. progra~. come from. The Caja also administers a loan. froID the World Bank for livestock development programs.. The. Banco Ganadero has been using funds from the Inter-American Development Bank (IDB), the Dutch Government and AID for the same purpose. Loans from these programs are being devoted mainly to beef production in the Atlantic Coast and the Eastern Plains.. Ranchers borrowing from these funds have to par-. ticipate with 20 percent of the estimated cost, receive technical assistance and invest up to 70 percent of the loan on farm improvements.. Interest rates are 14 percent annually,. the term of repayment is up to twelve years with a three- to four-year grace periodo Another form of credit quite common in Colombia, known as "cattle-in-partnership," is made available in the forro of cattle for which the rancher provides pasture and supervision.. Profits are shared when the cattle are soldo. The cattle are financed by the private sector and the Fondos Ganaderos (livestock funds), for which financing is provided by departmental and national governments and by the Banco Ganadero and Caja Agraria.. A usual profit sharing arrange-. ment is 60 percent rancher, 40 percent financiero. While. such an arrangement has the advantage of not impairing the rancher's borrowing capacity, it is probably equivalent to a loan with interest between 15 and 20 percent (depending on the profit shared)..
(56) 37 Despite the priority given by the government to agricultural credit and the increased channeling. of resources. to it, there is still an unsatisfied demand for long-term cred~t.. Rece~t. agricultural credit policies have been. oriented toward increasing the availability of funds and raising the interest rates to ensure a better utilization of scarce capital resources. Changes in agricultural credit policies have included: (1) Increased use of supervised credit. Credit is now considered an effective means of introducing technological change. (2) Increased terms and interest rate of loans under Law 26. Beginning in August 1969, the Monetary Board increased terms of repayment up to seven years with a grace period of two and one half to three years. Interest rates were changed from 8 and 9 percent annually to a variable rate that is 10 percent the first year and increases every year thereafter by one-half of 1 percent. (3) Increased and preferential rediscount quotas for loans made by Caja Agraria and Banco Ganadero. (4) Rreferential rediscount rates for Caja Agraria, Banco Ganadero and INCORA.. (5) Obligatory investment by commercial banks for 32 percent of its loan portfolio for developmento The latter includes Law 26 loans and other loans of the agricultural sector.. (6) Maintenance of subsidized interest rates for small producers. (7) New program for credit to land reform beneficiaries organized in cooperative or commercial operations. (8) New program for personal credit to small farmers based on expected returns on the investments. Dtscase Control. le). With an international cornmitrnent. ('()j]trol foot-and-mouth djsease (PMD) Colombia has entrusted. to JCA the attainment of this goal and the. erad~cation. of.
(57) bruccJlosif3.. 1'0 meet ih; l'oJllmitment, and wil1, ti\(' fil\t11iC'i:ll. technica1 assistance of the Pan-American Center Against Foot-and-Mouth Disease, ICA prepared a two-stage plan beginning in 1971. During the 1971-1975 stage the campaign will be concentrated in the Atlantic Coast region where 83 percent of the cattle popu1ation will be treated by the end of the periodo. In the same year the proportion of cattle treated. in the rest of the country wi1l be approximately 58 percent. In the next period--1976-80--control measures will be intensified in all producing zones and the proportion of cattle treated will be very close to 100 percent. While the control of FMD is restricted to priority areas, the control of brucellosis will be spread over the entire country.. The campaign aims at having 100 percent. of the female population free of brucellosis by 1974. Development Plan.. In 1972 the Ministry of Agriculture. prepared a comprehensive livestock development plan for Colombia. l. /. The objective was to establish livestock pro-. duction goals for the next decade and then to outline in detail the necessary plan of action to help achieve the desired goals. The most important policy instruments are:. (1) tax. incentives for breeding and farm improvements; (2) increased. Y"El Gobierno Modifica Su Politica Ganadera," El Espectador (Bogota), November 7, 1972, p. l..
(58) 39 availability of credit and easier credit terms;. (3) increased. association of credit with technical assistance and subsidized technical assistance for small producers; and (4) protection against land expropriation if certain levels of productivity and use of resources are attained. Exports.. General measures to promote exports are a. more flexible exchange rate policy and a 15 percent tax bonus (Certificado de Abono Tributario--C~~incentive for '~. all exports, except coffee, raw cattle hides, and petroleum. CATs may be traded at a discount or used after one year of issuance for tax payments.. More specifically, the govern-. ment has begun to promote beef exports through a semi-public lending institution, Corporacion Financiera Agropecuaria (COFIAGRO).. About 80 percent of COFIAGRO's portfolio is. in enterprises engaged in the export of beef, but it also lends to ranchers for fattening operations at one-year terms and at an effective interest rate of 16.28 percent. The government has recently taken two new measures intended to regulate the domestic and export markets.. Begin-. ning July 1972!/ beef has been banned two days a week from restaurants, hotel s and similar public outlets.. Peginning. January 1973?/ a quota system regulates exports to avoid. .!/ Jaime Sotomayor, "Veda de Carne Dos Dias a la Semana," El Espectador, (Pogota), June 30, 1972, p. l.. ?/ "El Gobierno Fij a Cupos de Exportac ion de Carne," El Tiempo (Bogota), December 11, 1972..
(59) 40 domestic shortages.. This measure requires the gradual. phasing out of export of live animal s and an increase in beef and processed meat exports. Domestic marketing of beef is also being improvcd; the Banco Ganadero in cooperation with USAID has placed special emphasis on financing the modernization of slaughtering facilities..
Figure


+7


Documento similar
If part of the information provided by migrants relates to finance (e.g., alternative sources of credit and foreign banks), financial constraints arising from systemic banking
Two types of scenarios are derived: the first scenario makes it possible to estimate the marginal contribu- tions to income per worker growth resulting from increases in the rate
We employed two distinct pipelines that allowed us to detect isoform switches after myocardial infarction, and to identify, thanks to the data available in ATtRACT,
points of convergence and divergence in the development policies adopted in recent years, after which we will examine the key factors for success in each
The Council for Transparency and Good Governance of Spain, with the State Agency for Evaluation of Public Policies and Quality of Services (AEVAL), has developed a
Themes: the categories mentioned and explained in the previous section: Alternative and Third Sector Media, Alternative Audiovisual Media, Local and Proximity Media, Social
Undergraduate students can transfer credit to Tecnológico de Monterrey for studies completed at a foreign educational institution with which a cooperation agreement has
Undergraduate students can transfer credit to Tecnológico de Monterrey for studies completed at a foreign educational institution with which a cooperation agreement has
