U S Colombia trade promotion agreement: potential economy wide and selected sectoral effects
258
0
0
Texto completo
(2) U.S. International Trade Commission COMMISSIONERS Daniel R. Pearson, Chairman Shara L. Aranoff, Vice Chairman Jennifer A. Hillman Stephen Koplan Deanna Tanner Okun Charlotte R. Lane. Robert A. Rogowsky Director of Operations Robert B. Koopman Director of Economics. Address all communications to Secretary to the Commission United States International Trade Commission Washington, DC 20436.
(3) U.S. International Trade Commission Washington, DC 20436 www.usitc.gov. U.S.-Colombia Trade Promotion Agreement: Potential Economy-wide and Selected Sectoral Effects Investigation No. TA-2104-023. Publication 3896. December 2006.
(4) Under the direction of Walker Pollard, Acting Chief Country and Regional Analysis Division Office of Economics This report was prepared principally by James Stamps, Project Leader, Office of Economics Michelle Vaca-Senecal, Deputy Project Leader, Office of Industries Office of Economics Nancy Bryan, Nannette Christ, Nicholas Grossman, Kyle Johnson, and Marinos Tsigas Office of Industries Jennifer Baumert, Laura Bloodgood, Joanna Bonarriva, Richard Brown, Gail Burns, William Chadwick, Eric Forden, Brad Gehrke, Erland Herfindahl, David Ingersoll, Cathy Jabara, Christopher Johnson, Joseph Kowalski, Kate Linton, Timothy McCarty, Deborah McNay, Doug Newman, Erick Oh, Laura Polly, John Reeder, Laura Rodriguez, Mark Simone, and Philip Stone Office of Tariff Affairs and Trade Agreements Jan Summers General Counsel Willliam Gearhart Primary Reviewers Mark Paulson and Walker Pollard Administrative Support Cecelia N. Allen and Monica Reed Office of Knowledge Resources Wendy Willis Office of Publishing.
(5) PREFACE The United States and Colombia concluded negotiations for a free trade agreement on February 27, 2006. On August 8, 2006, President Bush notified Congress of his intent to enter into the U.S.-Colombia Trade Promotion Agreement (TPA). In a letter dated August 25, 2006, the United States Trade Representative requested this investigation under section 2104(f) of the Trade Act of 2002 (Trade Act), which requires that the U.S. International Trade Commission (the Commission) submit a report to the President and the Congress not later than 90 calendar days after the President enters into a trade agreement. Section 2104(f)(2) of the Trade Act requires that the Commission prepare a report assessing the likely effects of the U.S.-Colombia TPA on the U.S. economy as a whole and on specific industry sectors, and section 2104(f)(3) requires that the Commission, in preparing its assessment, review available economic assessments regarding the agreement. A copy of the request letter for this investigation is in appendix A; the Commission’s notice of institution, published in the Federal Register of September 19, 2006, is in appendix B. The Commission held a public hearing for this investigation on October 5, 2006. A calendar of the hearing is included in appendix C of this report, and a summary of hearing testimony and written submissions is provided in chapter 7.. i.
(6)
(7) ABSTRACT This report assesses the likely effects of the U.S.-Colombia Trade Promotion Agreement (TPA) on the U.S. economy as a whole and on specific industry sectors, including the effects on U.S. gross domestic product (GDP), exports and imports, employment, and consumers. Colombian exporters generally face substantially lower tariffs in the U.S. market than do U.S. exporters in the Colombian market because most U.S. imports from Colombia enter free of duty either unconditionally or under other duty-free provisions. Because of this tariff asymmetry, the primary effects of the TPA will be improved U.S. access to the Colombian market and an increase in U.S. exports to Colombia. Nevertheless, the overall effect of the U.S.-Colombia TPA on the U.S. economy is likely to be small because of the small size of the Colombian market relative to total U.S. trade and production. The economy-wide model used by the Commission indicates that, after full implementation of the market access provisions (tariff and tariff-rate quota (TRQ) elimination) of the TPA, U.S. exports to Colombia may be higher by approximately $1.1 billion, U.S. imports from Colombia may be higher by $487 million, and U.S. GDP higher by about $2.5 billion, representing an increase of less than 0.05 percent of U.S. GDP. Only the U.S. sugar sector is estimated to experience a decline in output, revenue, or employment of more than 0.1 percent. The Commission’s findings are similar to those in other studies using similar quantitative techniques. The Commission analyzed the impact of both the immediate and the phased elimination of tariffs and TRQs of the TPA using a sector-specific analysis of selected U.S. product sectors. The sectors analyzed were meat (beef and pork); grain (wheat, rice, and corn); soybeans, soybean products, and animal feeds; chemical, rubber, and plastic products; machinery, electronics, and transportation equipment; textiles and apparel; sugar and sugar-containing products; and cut flowers. For most of these sectors, the TPA will provide small but positive benefits to U.S. exports. Finally, the TPA also may increase trade and investment through trade facilitation, such as the reduction of impediments in customs processing; improved regulatory environment, such as enhanced investor protections; and increased regulatory transparency. The effects of such measures on bilateral trade and investment flows may become more significant in the medium to long term.. iii.
(8)
(9) TABLE OF CONTENTS Page. Preface . . . . . . . . . . . . . . . . . . . . . . . . . . . . . . . . . . . . . . . . . . . . . . . . . . . . . . . . . . . . . . . .. i. Abstract . . . . . . . . . . . . . . . . . . . . . . . . . . . . . . . . . . . . . . . . . . . . . . . . . . . . . . . . . . . . . .. iii. Abbreviations and Acronyms. .................................. xiii. Executive Summary . . . . . . . . . . . . . . . . . . . . . . . . . . . . . . . . . . . . . . . . . . . . . .. xv. Chapter 1. Introduction . . . . . . . . . . . . . . . . . . . . . . . . . . . . . . . . . . . . . . . .. 1-1 1-1 1-2 1-3 1-3 1-7 1-8. Scope and approach of the report . . . . . . . . . . . . . . . . . . . . . . . . . . . . . . . . . . . . . . . . . . . . Overview of the U.S.-Colombia TPA . . . . . . . . . . . . . . . . . . . . . . . . . . . . . . . . . . . . . . . . . U.S.-Colombia trade overview . . . . . . . . . . . . . . . . . . . . . . . . . . . . . . . . . . . . . . . . . . . . . . U.S. exports . . . . . . . . . . . . . . . . . . . . . . . . . . . . . . . . . . . . . . . . . . . . . . . . . . . . . . . . . . U.S. imports . . . . . . . . . . . . . . . . . . . . . . . . . . . . . . . . . . . . . . . . . . . . . . . . . . . . . . . . . Trade balance . . . . . . . . . . . . . . . . . . . . . . . . . . . . . . . . . . . . . . . . . . . . . . . . . . . . . . . .. Chapter 2. Goods Market Access and Economy-Wide Analysis . . . . . . . . . . . . . . . . . . . . . . . . . . . . . . . . . . . . . . . . . . . . . . . . . . . . . . . . Summary of assessments . . . . . . . . . . . . . . . . . . . . . . . . . . . . . . . . . . . . . . . . . . . . . . . . . . . Goods market access . . . . . . . . . . . . . . . . . . . . . . . . . . . . . . . . . . . . . . . . . . . . . . . . . . . Economy-wide analysis . . . . . . . . . . . . . . . . . . . . . . . . . . . . . . . . . . . . . . . . . . . . . . . . Goods market access: TPA tariff commitments . . . . . . . . . . . . . . . . . . . . . . . . . . . . . . . . . Economy-wide simulation: Effects on U.S. imports, exports, employment, and welfare . . Analytical framework . . . . . . . . . . . . . . . . . . . . . . . . . . . . . . . . . . . . . . . . . . . . . . . . . . Simulation results . . . . . . . . . . . . . . . . . . . . . . . . . . . . . . . . . . . . . . . . . . . . . . . . . . . . . Estimated changes in trade flows . . . . . . . . . . . . . . . . . . . . . . . . . . . . . . . . . . . . . . U.S. gross output and employment effects . . . . . . . . . . . . . . . . . . . . . . . . . . . . . . .. Chapter 3. Sector-specific Assessments. ................... Summary of assessments . . . . . . . . . . . . . . . . . . . . . . . . . . . . . . . . . . . . . . . . . . . . . . . . . . . Meat (beef and pork) . . . . . . . . . . . . . . . . . . . . . . . . . . . . . . . . . . . . . . . . . . . . . . . . . . . . . . Assessment . . . . . . . . . . . . . . . . . . . . . . . . . . . . . . . . . . . . . . . . . . . . . . . . . . . . . . . . . . Impact on U.S. exports . . . . . . . . . . . . . . . . . . . . . . . . . . . . . . . . . . . . . . . . . . . . . . . . . Impact on U.S. imports . . . . . . . . . . . . . . . . . . . . . . . . . . . . . . . . . . . . . . . . . . . . . . . . . Views of interested parties . . . . . . . . . . . . . . . . . . . . . . . . . . . . . . . . . . . . . . . . . . . . . . Grain (wheat, rice, and corn) . . . . . . . . . . . . . . . . . . . . . . . . . . . . . . . . . . . . . . . . . . . . . . . . Assessment . . . . . . . . . . . . . . . . . . . . . . . . . . . . . . . . . . . . . . . . . . . . . . . . . . . . . . . . . . Impact on U.S. exports . . . . . . . . . . . . . . . . . . . . . . . . . . . . . . . . . . . . . . . . . . . . . . . . . Wheat . . . . . . . . . . . . . . . . . . . . . . . . . . . . . . . . . . . . . . . . . . . . . . . . . . . . . . . . . . . Rice . . . . . . . . . . . . . . . . . . . . . . . . . . . . . . . . . . . . . . . . . . . . . . . . . . . . . . . . . . . . . v. 2-1 2-1 2-1 2-2 2-3 2-3 2-5 2-7 2-9 2-13 3-1 3-1 3-3 3-3 3-3 3-6 3-7 3-8 3-8 3-8 3-10 3-11.
(10) CONTENTS–Continued Page. Chapter 3. Sector-specific Assessment—Continued Corn . . . . . . . . . . . . . . . . . . . . . . . . . . . . . . . . . . . . . . . . . . . . . . . . . . . . . . . . . . . . Views of interested parties . . . . . . . . . . . . . . . . . . . . . . . . . . . . . . . . . . . . . . . . . . . . . . Soybeans, soybean products, and animal feeds . . . . . . . . . . . . . . . . . . . . . . . . . . . . . . . . . . Assessment . . . . . . . . . . . . . . . . . . . . . . . . . . . . . . . . . . . . . . . . . . . . . . . . . . . . . . . . . . Impact on U.S. exports . . . . . . . . . . . . . . . . . . . . . . . . . . . . . . . . . . . . . . . . . . . . . . . . . Soybeans and soybean products . . . . . . . . . . . . . . . . . . . . . . . . . . . . . . . . . . . . . . . Animal feed preparations and pet foods . . . . . . . . . . . . . . . . . . . . . . . . . . . . . . . . . Views of interested parties . . . . . . . . . . . . . . . . . . . . . . . . . . . . . . . . . . . . . . . . . . . . . . Chemical, rubber, and plastic products . . . . . . . . . . . . . . . . . . . . . . . . . . . . . . . . . . . . . . . . Assessment . . . . . . . . . . . . . . . . . . . . . . . . . . . . . . . . . . . . . . . . . . . . . . . . . . . . . . . . . . Impact on U.S. exports . . . . . . . . . . . . . . . . . . . . . . . . . . . . . . . . . . . . . . . . . . . . . . . . . Views of interested parties . . . . . . . . . . . . . . . . . . . . . . . . . . . . . . . . . . . . . . . . . . . . . . Machinery, electronics, and transportation equipment . . . . . . . . . . . . . . . . . . . . . . . . . . . . Assessment . . . . . . . . . . . . . . . . . . . . . . . . . . . . . . . . . . . . . . . . . . . . . . . . . . . . . . . . . . Impact on U.S. exports . . . . . . . . . . . . . . . . . . . . . . . . . . . . . . . . . . . . . . . . . . . . . . . . . Motor vehicles and parts . . . . . . . . . . . . . . . . . . . . . . . . . . . . . . . . . . . . . . . . . . . . Machinery . . . . . . . . . . . . . . . . . . . . . . . . . . . . . . . . . . . . . . . . . . . . . . . . . . . . . . . . Electronics . . . . . . . . . . . . . . . . . . . . . . . . . . . . . . . . . . . . . . . . . . . . . . . . . . . . . . . Views of interested parties . . . . . . . . . . . . . . . . . . . . . . . . . . . . . . . . . . . . . . . . . . . . . . Textiles and apparel . . . . . . . . . . . . . . . . . . . . . . . . . . . . . . . . . . . . . . . . . . . . . . . . . . . . . . . Assessment . . . . . . . . . . . . . . . . . . . . . . . . . . . . . . . . . . . . . . . . . . . . . . . . . . . . . . . . . . Impact on U.S. exports . . . . . . . . . . . . . . . . . . . . . . . . . . . . . . . . . . . . . . . . . . . . . . . . . Impact on U.S. imports . . . . . . . . . . . . . . . . . . . . . . . . . . . . . . . . . . . . . . . . . . . . . . . . . Views of interested parties . . . . . . . . . . . . . . . . . . . . . . . . . . . . . . . . . . . . . . . . . . . . . . Sugar and sugar-containing products . . . . . . . . . . . . . . . . . . . . . . . . . . . . . . . . . . . . . . . . . Assessment . . . . . . . . . . . . . . . . . . . . . . . . . . . . . . . . . . . . . . . . . . . . . . . . . . . . . . . . . . Impact on U.S. exports . . . . . . . . . . . . . . . . . . . . . . . . . . . . . . . . . . . . . . . . . . . . . . . . . Impact on U.S. imports . . . . . . . . . . . . . . . . . . . . . . . . . . . . . . . . . . . . . . . . . . . . . . . . . Views of interested parties . . . . . . . . . . . . . . . . . . . . . . . . . . . . . . . . . . . . . . . . . . . . . . Cut flowers . . . . . . . . . . . . . . . . . . . . . . . . . . . . . . . . . . . . . . . . . . . . . . . . . . . . . . . . . . . . . Assessment . . . . . . . . . . . . . . . . . . . . . . . . . . . . . . . . . . . . . . . . . . . . . . . . . . . . . . . . . . Impact on U.S. imports . . . . . . . . . . . . . . . . . . . . . . . . . . . . . . . . . . . . . . . . . . . . . . . . . Views of interested parties . . . . . . . . . . . . . . . . . . . . . . . . . . . . . . . . . . . . . . . . . . . . . .. Chapter 4. Effects of Market Access Provisions for Services . . . . . . . . . . . . . . . . . . . . . . . . . . . . . . . . . . . . . . . . . . . . . . . . . . . . . . . . Summary of assessments . . . . . . . . . . . . . . . . . . . . . . . . . . . . . . . . . . . . . . . . . . . . . . . . . . . TPA Chapter 11—Cross-border trade in services . . . . . . . . . . . . . . . . . . . . . . . . . . . . . . . . Assessment . . . . . . . . . . . . . . . . . . . . . . . . . . . . . . . . . . . . . . . . . . . . . . . . . . . . . . . . . . Summary of provisions . . . . . . . . . . . . . . . . . . . . . . . . . . . . . . . . . . . . . . . . . . . . . . . . . Views of interested parties . . . . . . . . . . . . . . . . . . . . . . . . . . . . . . . . . . . . . . . . . . . . . . TPA Chapter 12—Financial services . . . . . . . . . . . . . . . . . . . . . . . . . . . . . . . . . . . . . . . . .. vi. 3-12 3-13 3-14 3-14 3-14 3-15 3-17 3-18 3-18 3-18 3-19 3-20 3-20 3-20 3-20 3-21 3-23 3-25 3-25 3-26 3-26 3-26 3-27 3-28 3-29 3-29 3-30 3-31 3-32 3-33 3-33 3-33 3-34. 4-1 4-1 4-2 4-2 4-2 4-5 4-6.
(11) CONTENTS–Continued Page. Chapter 4. Effects of Market Access Provisions for Services—Continued Assessment . . . . . . . . . . . . . . . . . . . . . . . . . . . . . . . . . . . . . . . . . . . . . . . . . . . . . . . . . . Financial services, except insurance . . . . . . . . . . . . . . . . . . . . . . . . . . . . . . . . . . . . Insurance . . . . . . . . . . . . . . . . . . . . . . . . . . . . . . . . . . . . . . . . . . . . . . . . . . . . . . . . Summary of provisions . . . . . . . . . . . . . . . . . . . . . . . . . . . . . . . . . . . . . . . . . . . . . . . . . Views of interested parties . . . . . . . . . . . . . . . . . . . . . . . . . . . . . . . . . . . . . . . . . . . . . . TPA Chapter 14—Telecommunications . . . . . . . . . . . . . . . . . . . . . . . . . . . . . . . . . . . . . . . Assessment . . . . . . . . . . . . . . . . . . . . . . . . . . . . . . . . . . . . . . . . . . . . . . . . . . . . . . . . . . Summary of provisions . . . . . . . . . . . . . . . . . . . . . . . . . . . . . . . . . . . . . . . . . . . . . . . . . Views of interested parties . . . . . . . . . . . . . . . . . . . . . . . . . . . . . . . . . . . . . . . . . . . . . .. Chapter 5. Effects of Trade Facilitation Provisions. 4-6 4-6 4-7 4-8 4-10 4-11 4-11 4-11 4-13. ... Summary of assessments . . . . . . . . . . . . . . . . . . . . . . . . . . . . . . . . . . . . . . . . . . . . . . . . . . . TPA Chapter 5—Customs administration and trade facilitation . . . . . . . . . . . . . . . . . . . . . Assessment . . . . . . . . . . . . . . . . . . . . . . . . . . . . . . . . . . . . . . . . . . . . . . . . . . . . . . . . . . Summary of provisions . . . . . . . . . . . . . . . . . . . . . . . . . . . . . . . . . . . . . . . . . . . . . . . . . Views of interested parties . . . . . . . . . . . . . . . . . . . . . . . . . . . . . . . . . . . . . . . . . . . . . . TPA Chapter 6—Sanitary and phytosanitary measures . . . . . . . . . . . . . . . . . . . . . . . . . . . Assessment . . . . . . . . . . . . . . . . . . . . . . . . . . . . . . . . . . . . . . . . . . . . . . . . . . . . . . . . . . Summary of provisions . . . . . . . . . . . . . . . . . . . . . . . . . . . . . . . . . . . . . . . . . . . . . . . . . Views of interested parties . . . . . . . . . . . . . . . . . . . . . . . . . . . . . . . . . . . . . . . . . . . . . . TPA Chapter 7—Technical barriers to trade . . . . . . . . . . . . . . . . . . . . . . . . . . . . . . . . . . . . Assessment . . . . . . . . . . . . . . . . . . . . . . . . . . . . . . . . . . . . . . . . . . . . . . . . . . . . . . . . . . Summary of provisions . . . . . . . . . . . . . . . . . . . . . . . . . . . . . . . . . . . . . . . . . . . . . . . . . Views of interested parties . . . . . . . . . . . . . . . . . . . . . . . . . . . . . . . . . . . . . . . . . . . . . . TPA Chapter 15—Electronic commerce . . . . . . . . . . . . . . . . . . . . . . . . . . . . . . . . . . . . . . . Assessment . . . . . . . . . . . . . . . . . . . . . . . . . . . . . . . . . . . . . . . . . . . . . . . . . . . . . . . . . . Summary of provisions . . . . . . . . . . . . . . . . . . . . . . . . . . . . . . . . . . . . . . . . . . . . . . . . . Views of interested parties . . . . . . . . . . . . . . . . . . . . . . . . . . . . . . . . . . . . . . . . . . . . . .. 5-1 5-1 5-2 5-2 5-3 5-4 5-5 5-5 5-5 5-6 5-7 5-7 5-7 5-8 5-9 5-9 5-9 5-10. Chapter 6. Effects of Regulatory Provisions . . . . . . . . . . . . .. 6-1 6-1 6-1 6-1 6-2 6-2 6-2 6-2 6-3 6-5 6-6 6-6. Summary of assessments . . . . . . . . . . . . . . . . . . . . . . . . . . . . . . . . . . . . . . . . . . . . . . . . . . . TPA Chapter 8—Trade remedies . . . . . . . . . . . . . . . . . . . . . . . . . . . . . . . . . . . . . . . . . . . . Assessment . . . . . . . . . . . . . . . . . . . . . . . . . . . . . . . . . . . . . . . . . . . . . . . . . . . . . . . . . . Summary of provisions . . . . . . . . . . . . . . . . . . . . . . . . . . . . . . . . . . . . . . . . . . . . . . . . . Views of interested parties . . . . . . . . . . . . . . . . . . . . . . . . . . . . . . . . . . . . . . . . . . . . . . TPA Chapter 9—Government procurement . . . . . . . . . . . . . . . . . . . . . . . . . . . . . . . . . . . . Assessment . . . . . . . . . . . . . . . . . . . . . . . . . . . . . . . . . . . . . . . . . . . . . . . . . . . . . . . . . . Summary of provisions . . . . . . . . . . . . . . . . . . . . . . . . . . . . . . . . . . . . . . . . . . . . . . . . . Views of interested parties . . . . . . . . . . . . . . . . . . . . . . . . . . . . . . . . . . . . . . . . . . . . . . TPA Chapter 10—Investment . . . . . . . . . . . . . . . . . . . . . . . . . . . . . . . . . . . . . . . . . . . . . . . Assessment . . . . . . . . . . . . . . . . . . . . . . . . . . . . . . . . . . . . . . . . . . . . . . . . . . . . . . . . . . vii.
(12) CONTENTS–Continued Page. Chapter 6. Effects of Regulatory Provisions—Continued Summary of provisions . . . . . . . . . . . . . . . . . . . . . . . . . . . . . . . . . . . . . . . . . . . . . . . . . Nonconforming measures related to investment . . . . . . . . . . . . . . . . . . . . . . . . . . Views of interested parties . . . . . . . . . . . . . . . . . . . . . . . . . . . . . . . . . . . . . . . . . . . . . . TPA Chapter 13—Competition policy . . . . . . . . . . . . . . . . . . . . . . . . . . . . . . . . . . . . . . . . Assessment . . . . . . . . . . . . . . . . . . . . . . . . . . . . . . . . . . . . . . . . . . . . . . . . . . . . . . . . . . Summary of provisions . . . . . . . . . . . . . . . . . . . . . . . . . . . . . . . . . . . . . . . . . . . . . . . . . Views of interested parties . . . . . . . . . . . . . . . . . . . . . . . . . . . . . . . . . . . . . . . . . . . . . . TPA Chapter 16—Intellectual property rights . . . . . . . . . . . . . . . . . . . . . . . . . . . . . . . . . . Assessment . . . . . . . . . . . . . . . . . . . . . . . . . . . . . . . . . . . . . . . . . . . . . . . . . . . . . . . . . . Summary of provisions . . . . . . . . . . . . . . . . . . . . . . . . . . . . . . . . . . . . . . . . . . . . . . . . . Trademarks, geographical indications, and domain names . . . . . . . . . . . . . . . . . . Copyrights and related rights and protection of certain satellite signals . . . . . . . . Patents . . . . . . . . . . . . . . . . . . . . . . . . . . . . . . . . . . . . . . . . . . . . . . . . . . . . . . . . . . Measures related to certain regulated products . . . . . . . . . . . . . . . . . . . . . . . . . . . Enforcement . . . . . . . . . . . . . . . . . . . . . . . . . . . . . . . . . . . . . . . . . . . . . . . . . . . . . . Promotion of innovation and technological development . . . . . . . . . . . . . . . . . . . Understandings on public health and on biodiversity and traditional knowledge . Views of interested parties . . . . . . . . . . . . . . . . . . . . . . . . . . . . . . . . . . . . . . . . . . . . . . TPA Chapter 17—Labor . . . . . . . . . . . . . . . . . . . . . . . . . . . . . . . . . . . . . . . . . . . . . . . . . . . Assessment . . . . . . . . . . . . . . . . . . . . . . . . . . . . . . . . . . . . . . . . . . . . . . . . . . . . . . . . . . Summary of provisions . . . . . . . . . . . . . . . . . . . . . . . . . . . . . . . . . . . . . . . . . . . . . . . . . Views of interested parties . . . . . . . . . . . . . . . . . . . . . . . . . . . . . . . . . . . . . . . . . . . . . . TPA Chapter 18—Environment . . . . . . . . . . . . . . . . . . . . . . . . . . . . . . . . . . . . . . . . . . . . . Assessment . . . . . . . . . . . . . . . . . . . . . . . . . . . . . . . . . . . . . . . . . . . . . . . . . . . . . . . . . . Summary of provisions . . . . . . . . . . . . . . . . . . . . . . . . . . . . . . . . . . . . . . . . . . . . . . . . . Views of interested parties . . . . . . . . . . . . . . . . . . . . . . . . . . . . . . . . . . . . . . . . . . . . . . TPA Chapter 19—Transparency . . . . . . . . . . . . . . . . . . . . . . . . . . . . . . . . . . . . . . . . . . . . . Assessment . . . . . . . . . . . . . . . . . . . . . . . . . . . . . . . . . . . . . . . . . . . . . . . . . . . . . . . . . . Summary of provisions . . . . . . . . . . . . . . . . . . . . . . . . . . . . . . . . . . . . . . . . . . . . . . . . . Views of interested parties . . . . . . . . . . . . . . . . . . . . . . . . . . . . . . . . . . . . . . . . . . . . . . TPA Chapter 21—Dispute settlement . . . . . . . . . . . . . . . . . . . . . . . . . . . . . . . . . . . . . . . . . Assessment . . . . . . . . . . . . . . . . . . . . . . . . . . . . . . . . . . . . . . . . . . . . . . . . . . . . . . . . . . Summary of provisions . . . . . . . . . . . . . . . . . . . . . . . . . . . . . . . . . . . . . . . . . . . . . . . . . Views of interested parties . . . . . . . . . . . . . . . . . . . . . . . . . . . . . . . . . . . . . . . . . . . . . .. Chapter 7. Literature Review and Summary of Views of Interested Parties . . . . . . . . . . . . . . . . . . . . . . . . . . . . . . Literature review . . . . . . . . . . . . . . . . . . . . . . . . . . . . . . . . . . . . . . . . . . . . . . . . . . . . . . . . . Summary of views of interested parties . . . . . . . . . . . . . . . . . . . . . . . . . . . . . . . . . . . . . . . . Government of Colombia . . . . . . . . . . . . . . . . . . . . . . . . . . . . . . . . . . . . . . . . . . . . . . . Government of the United States Virgin Islands . . . . . . . . . . . . . . . . . . . . . . . . . . . . . American Apparel & Footwear Association . . . . . . . . . . . . . . . . . . . . . . . . . . . . . . . . .. viii. 6-8 6-9 6-10 6-12 6-12 6-13 6-13 6-14 6-14 6-14 6-16 6-16 6-17 6-17 6-18 6-18 6-18 6-19 6-20 6-20 6-22 6-23 6-24 6-24 6-24 6-25 6-25 6-25 6-26 6-26 6-27 6-27 6-27 6-28. 7-1 7-1 7-4 7-4 7-5 7-5.
(13) CONTENTS–Continued Page. Chapter 7. Literature Review and Summary of Views of Interested Parties—Continued American Dehydrated Onion and Garlic Association . . . . . . . . . . . . . . . . . . . . . . . . . . American Farm Bureau Federation . . . . . . . . . . . . . . . . . . . . . . . . . . . . . . . . . . . . . . . . American Soybean Association . . . . . . . . . . . . . . . . . . . . . . . . . . . . . . . . . . . . . . . . . . American Sugar Alliance . . . . . . . . . . . . . . . . . . . . . . . . . . . . . . . . . . . . . . . . . . . . . . . ANDI . . . . . . . . . . . . . . . . . . . . . . . . . . . . . . . . . . . . . . . . . . . . . . . . . . . . . . . . . . . . . . . Association of Colombian Flower Exporters . . . . . . . . . . . . . . . . . . . . . . . . . . . . . . . . Association of Floral Importers of Florida . . . . . . . . . . . . . . . . . . . . . . . . . . . . . . . . . . California Cut Flower Commission . . . . . . . . . . . . . . . . . . . . . . . . . . . . . . . . . . . . . . . Caterpillar, U.S. Chamber of Commerce, Association of American Chambers of Commerce in Latin America, and the U.S.-Colombia Trade Coalition . . . . . . . . . Council of the Americas . . . . . . . . . . . . . . . . . . . . . . . . . . . . . . . . . . . . . . . . . . . . . . . . Emergency Committee for American Trade . . . . . . . . . . . . . . . . . . . . . . . . . . . . . . . . . International Intellectual Property Alliance . . . . . . . . . . . . . . . . . . . . . . . . . . . . . . . . . National Cattlemen’s Beef Association . . . . . . . . . . . . . . . . . . . . . . . . . . . . . . . . . . . . National Pork Producers Council . . . . . . . . . . . . . . . . . . . . . . . . . . . . . . . . . . . . . . . . . Ranchers-Cattlemen Action Legal Fund, United Stockgrowers of America . . . . . . . . Sweetener Users Association . . . . . . . . . . . . . . . . . . . . . . . . . . . . . . . . . . . . . . . . . . . . Travel Goods Association . . . . . . . . . . . . . . . . . . . . . . . . . . . . . . . . . . . . . . . . . . . . . . . United States Association of Importers of Textiles and Apparel . . . . . . . . . . . . . . . . . U.S. Grains Council, National Corn Growers Association, National Barley Growers Association, and the National Sorghum Producers . . . . . . . . . . . . . . . . . . . . . . . .. Bibliography . . . . . . . . . . . . . . . . . . . . . . . . . . . . . . . . . . . . . . . . . . . . . . . . . . . . . . . .. 7-6 7-6 7-7 7-7 7-7 7-8 7-8 7-9 7-9 7-10 7-11 7-11 7-12 7-12 7-13 7-13 7-13 7-14 7-15 Bibl-1. Appendixes A. B. C. D. E. F. G. H. I. J. K.. Request letter from USTR . . . . . . . . . . . . . . . . . . . . . . . . . . . . . . . . . . . . . . . . . . . . . . . . Federal Register notice . . . . . . . . . . . . . . . . . . . . . . . . . . . . . . . . . . . . . . . . . . . . . . . . . . Hearing participants . . . . . . . . . . . . . . . . . . . . . . . . . . . . . . . . . . . . . . . . . . . . . . . . . . . . . U.S.-Colombia TPA: Chapter-by-chapter summary . . . . . . . . . . . . . . . . . . . . . . . . . . . . Colombia: Economic profile and tables . . . . . . . . . . . . . . . . . . . . . . . . . . . . . . . . . . . . . . Andean Trade Preference Act . . . . . . . . . . . . . . . . . . . . . . . . . . . . . . . . . . . . . . . . . . . . . GTAP model and tables . . . . . . . . . . . . . . . . . . . . . . . . . . . . . . . . . . . . . . . . . . . . . . . . . . General effects of trade agreements . . . . . . . . . . . . . . . . . . . . . . . . . . . . . . . . . . . . . . . . . U.S. sugar policy . . . . . . . . . . . . . . . . . . . . . . . . . . . . . . . . . . . . . . . . . . . . . . . . . . . . . . . Tariff rate equivalents in Colombian banking services . . . . . . . . . . . . . . . . . . . . . . . . . . Comparison of Colombia’s sectoral GATS commitments with Colombian nonconforming measures . . . . . . . . . . . . . . . . . . . . . . . . . . . . . . . . . . . . . . . . . . . . . .. ix. A-1 B-1 C-1 D-1 E-1 F-1 G-1 H-1 I-1 J-1 K-1.
(14) CONTENTS–Continued Page. Boxes 2-1. 3-1. 3-2. 3-3. 4-1. 4-2. 4-3. 5-1. 6-1. 6-2. 6-3. 6-4.. Interpreting the model results . . . . . . . . . . . . . . . . . . . . . . . . . . . . . . . . . . . . . . . . . . . . . . Colombia’s price band system . . . . . . . . . . . . . . . . . . . . . . . . . . . . . . . . . . . . . . . . . . . . . Colombia’s domestic purchase requirement . . . . . . . . . . . . . . . . . . . . . . . . . . . . . . . . . . Market access in Colombia for U.S. remanufactured goods . . . . . . . . . . . . . . . . . . . . . . Profile of service industries in Colombia and the United States . . . . . . . . . . . . . . . . . . . The estimation of tariff rate equivalents . . . . . . . . . . . . . . . . . . . . . . . . . . . . . . . . . . . . . . Competitive conditions in Colombia’s telecommunications market . . . . . . . . . . . . . . . . WTO Information Technology Agreement . . . . . . . . . . . . . . . . . . . . . . . . . . . . . . . . . . . Current government procurement in Colombia . . . . . . . . . . . . . . . . . . . . . . . . . . . . . . . . Foreign direct investment (FDI) in the United States and Colombia . . . . . . . . . . . . . . . . Recent conditions of IPR protection in Colombia . . . . . . . . . . . . . . . . . . . . . . . . . . . . . . Labor market conditions in Colombia . . . . . . . . . . . . . . . . . . . . . . . . . . . . . . . . . . . . . . .. 2-7 3-4 3-14 3-22 4-3 4-8 4-12 5-11 6-3 6-7 6-15 6-21. Tables 1-1. U.S.-Colombia TPA: Location of analysis of TPA chapters in the Commission’s report . . . . . . . . . . . . . . . . . . . . . . . . . . . . . . . . . . . . . . . . . . . . . . . . . . . . . . . . . . . . . 1-2. Applied Colombian tariff rates on U.S. exports . . . . . . . . . . . . . . . . . . . . . . . . . . . . . . . . 1-3. Colombia: Selected nontariff impediments . . . . . . . . . . . . . . . . . . . . . . . . . . . . . . . . . . . 1-4. Applied U.S. tariff rates on imports from Colombia . . . . . . . . . . . . . . . . . . . . . . . . . . . . 2-1. U.S.-Colombia TPA: Summary of industrial and textile tariff commitments . . . . . . . . . 2-2. U.S.-Colombia TPA: Summary of agricultural tariff commitments . . . . . . . . . . . . . . . . 2-3. U.S.-Colombia TPA: Simulated effects of trade liberalization on U.S. welfare and GDP (relative to projected 2007 baseline) . . . . . . . . . . . . . . . . . . . . . . . . . . . . . . . . . 2-4. U.S.-Colombia TPA: Simulated effects on U.S.-Colombia bilateral trade for selected sectors, from a projected 2007 baseline . . . . . . . . . . . . . . . . . . . . . . . . . . . . . . . . . . . 2-5. U.S.-Colombia TPA: Simulated effects on U.S. output and employment for selected sectors, from a projected 2007 baseline . . . . . . . . . . . . . . . . . . . . . . . . . . . . . . . . . . . 3-1. U.S. grain exports to and market access in Colombia . . . . . . . . . . . . . . . . . . . . . . . . . . . 3-2. Soybeans, soybean products, and animal feed exports to Colombia: U.S. average exports during 2001–05, exports in 2005, first year TRQ, over-quota tariff, and base rate in 2006 for Colombia . . . . . . . . . . . . . . . . . . . . . . . . . . . . . . . . . . . . . . . . . 3-3. Soybeans, soybean products, and animal feed: U.S. exports to Colombia, 2000-2005 . . 4-1. Cross-border trade in services with all trading partners by the United States and Colombia, 2004 . . . . . . . . . . . . . . . . . . . . . . . . . . . . . . . . . . . . . . . . . . . . . . . . . . 4-2. U.S.-Colombia TPA: Services sectors subject to nonconforming measures related to cross-border trade . . . . . . . . . . . . . . . . . . . . . . . . . . . . . . . . . . . . . . . . . . . . . . . . . . . 5-1. Selected GATT articles and U.S.-Colombia TPA commitments related to customs administration . . . . . . . . . . . . . . . . . . . . . . . . . . . . . . . . . . . . . . . . . . . . . . . . . . . . . . 6-1. U.S.-Colombia TPA: Industry sectors subject to nonconforming measures related to investment . . . . . . . . . . . . . . . . . . . . . . . . . . . . . . . . . . . . . . . . . . . . . . . . . . . . . . . D-1. Selected GATT articles and U.S.-Colombia TPA commitments related to customs administration . . . . . . . . . . . . . . . . . . . . . . . . . . . . . . . . . . . . . . . . . . . . . . . . . . . . . . D-2. U.S.-Colombia TPA: Industry sectors subject to nonconforming measures related to investment . . . . . . . . . . . . . . . . . . . . . . . . . . . . . . . . . . . . . . . . . . . . . . . . . . . . . . . . . x. 1-4 1-6 1-6 1-8 2-4 2-5 2-8 2-11 2-14 3-9 3-16 3-16 4-3 4-4 5-4 6-11 D-8 D-15.
(15) CONTENTS–Continued Page. Tables—Continued E-1. Leading U.S. exports to Colombia, total U.S. exports to the world, and Colombian share of total, 2005 . . . . . . . . . . . . . . . . . . . . . . . . . . . . . . . . . . . . . . . . . . . . . . . . . . E-2. Colombia: selected nontariff impediments . . . . . . . . . . . . . . . . . . . . . . . . . . . . . . . . . . . . E-3. Leading U.S. imports from Colombia, total U.S. imports from the world, and Colombian share of total, 2005 . . . . . . . . . . . . . . . . . . . . . . . . . . . . . . . . . . . . . . . . . E-4. U.S. imports for consumption from Colombia, by duty treatment, 2003-05 . . . . . . . . . . G-1. GTAP commodity and regional aggregation . . . . . . . . . . . . . . . . . . . . . . . . . . . . . . . . . . G-2. U.S.-Colombia TPA benchmark tariffs, estimates for 2007 . . . . . . . . . . . . . . . . . . . . . . . G-3. U.S.-Colombia TPA: Simulated effect on U.S.-Colombia bilateral trade, from a projected 2007 baseline . . . . . . . . . . . . . . . . . . . . . . . . . . . . . . . . . . . . . . . . . . . . . . . G-4. U.S.-Colombia TPA: Simulated effects on U.S. global trade from a projected 2007 baseline . . . . . . . . . . . . . . . . . . . . . . . . . . . . . . . . . . . . . . . . . . . . . . . . . . . . . . . . . . . G-5. U.S.-Colombia TPA: Simulated effects on U.S. output and employment, from a projected 2007 baseline . . . . . . . . . . . . . . . . . . . . . . . . . . . . . . . . . . . . . . . . . . . . . . . J-1. Tariff-rate equivalents in Colombian banking services: Stage 1 results . . . . . . . . . . . . . J-2. Tariff-rate equivalents in Colombian banking services: Stage 2 results . . . . . . . . . . . . . K-1. U.S.-Colombia TPA: Comparison of Colombia’s sectoral GATS commitments with Colombian nonconforming measures (NCMs) . . . . . . . . . . . . . . . . . . . . . . . . . . . . .. E-6 E-7 E-8 E-9 G-5 G-6 G-10 G-12 G-14 J-7 J-7 K-3. Figures 1-1. U.S. merchandise trade with Colombia, 1989–2005 . . . . . . . . . . . . . . . . . . . . . . . . . . . . 2-1. U.S.-Colombia TPA: Simulated effects on U.S. exports to Colombia in selected sectors (landed, duty paid) from a projected 2007 baseline . . . . . . . . . . . . . . . . . . . . 3-1. Leading U.S. machinery and equipment exports to Colombia, 2005 . . . . . . . . . . . . . . . .. xi. 1-5 2-10 3-21.
(16)
(17) ABBREVIATIONS AND ACRONYMS ATC ATPA ATPDEA AVE BEA BSE CAFTA-DR CET CGE ERS FDI FMD FTA GATS GATT GDP GSP GTAP HS HTS IPR ITA kg MFN mt NAFTA n.e.c. NTR OIE SCP SPS TBT TPA TPL Trade Act TRE TRIPS TRQ UN USCS USDA USITC USTR WCT WIPO WTO. Agreement on Textiles and Clothing Andean Trade Preference Act Andean Trade Promotion and Drug Eradication Act ad valorem equivalent Bureau of Economic Analysis (U.S. Department of Commerce) bovine spongiform encephalopathy U.S. Free Trade Agreement with Central America and the Dominican Republic common external tariff computable general equilibrium Economic Research Service (USDA) foreign direct investment foot and mouth disease free trade agreement General Agreement on Trade in Services General Agreement on Tariffs and Trade gross domestic product Generalized System of Preferences Global Trade Analysis Project Harmonized System Harmonized Tariff Schedule of the United States intellectual property rights Information Technology Agreement kilogram most-favored-nation metric tons North American Free Trade Agreement not elsewhere classified normal trade relations (same as MFN) World Organization of Animal Health sugar-containing products sanitary and phytosanitary technical barriers to trade trade promotion agreement tariff preference level Trade Act of 2002 tariff rate equivalent Trade-Related Aspects of Intellectual Property Rights tariff-rate quota United Nations U.S. Commercial Service U.S. Department of Agriculture United States International Trade Commission United States Trade Representative WIPO Copyright Treaty World Intellectual Property Organization World Trade Organization. xiii.
(18) ABBREVIATIONS AND ACRONYMS– Continued U.S. Trade Advisory Groups ACTPN APAC ATAC IGPAC ITAC 2 ITAC 3 ITAC 4 ITAC 6 ITAC 8 ITAC 10 ITAC 12 ITAC 13 ITAC 14 ITAC 15 ITAC 16 LAC TEPAC. Advisory Committee for Trade Policy and Negotiations Agricultural Policy Advisory Committee for Trade Agricultural Technical Advisory Committee Intergovernmental Policy Advisory Committee Industry Trade Advisory Committee on Automotive Equipment and Capital Goods Industry Trade Advisory Committee for Chemicals, Pharmaceuticals, Health/Science Products and Services Industry Trade Advisory Committee on Consumer Goods Industry Trade Advisory Committee on Energy and Energy Services Industry Trade Advisory Committee for Information and Communications Technologies, Services and Electronic Commerce Industry Trade Advisory Committee on Services and Finance Industries Industry Trade Advisory Committee on Steel Industry Trade Advisory Committee on Textiles and Clothing Industry Trade Advisory Committee on Customs and Trade Facilitation Industry Trade Advisory Committee on Intellectual Property Industry Trade Advisory Committee on Standards and Technical Trade Barriers Labor Advisory Committee for Trade Negotiations and Trade Policy Trade and Environment Policy Advisory Committee. xiv.
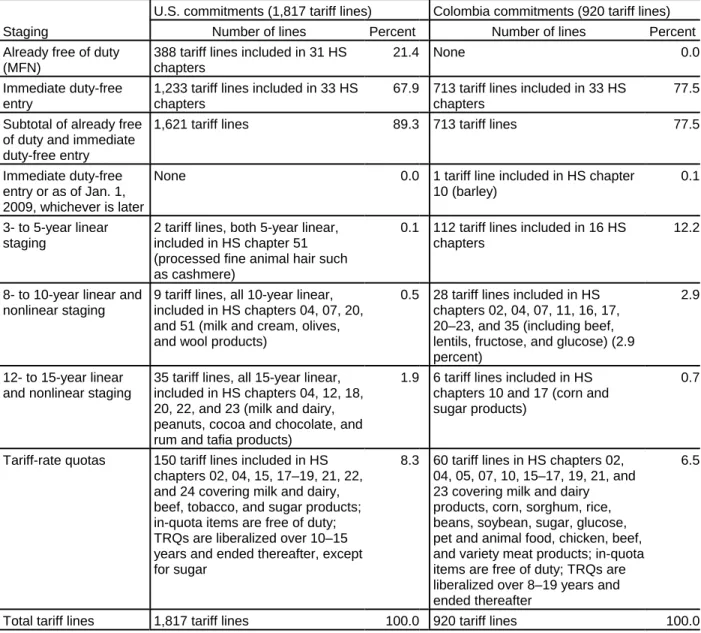
(19) EXECUTIVE SUMMARY This report assesses the likely effects of the U.S.-Colombia Trade Promotion Agreement (TPA) on the U.S. economy as a whole and on specific industry sectors, including the effects on U.S. gross domestic product (GDP); exports and imports; employment; specific industry sectors; and U.S. consumers.. About the Agreement The text of the U.S.-Colombia TPA is modeled on other recent U.S. free trade agreements, particularly the U.S.-Peru TPA. The market access provisions of the TPA provide for the eventual elimination of duties on bilateral trade in all eligible goods with the exception of sugar. •. U.S. exports to Colombia: For U.S. products entering Colombia, almost 76 percent of industrial goods and textile tariff lines and 77 percent of agricultural tariff lines will be duty free upon implementation of the TPA. Duties on many other tariff lines will be phased out over a 5- or 10-year period, with some agricultural tariff rate quotas (TRQs) being phased out over a period of up to 19 years.. •. U.S. imports from Colombia: For Colombian products entering the United States, 99 percent of qualifying industrial goods and textile tariff lines and 89 percent of agricultural tariff lines will become duty free upon implementation of the TPA. Duties on other tariff lines will be phased out over a period of up to 15 years, with some agricultural TRQs (except for sugar) being phased out over a period of up to 15 years. Although Colombia is expected to fill its new sugar TRQ, the TPA is likely to have a minor effect on U.S. imports and production of sugar and sugarcontaining products.. The TPA also has provisions with respect to trade in services, trade facilitation (including customs administration, technical barriers to trade, and electronic commerce), and the regulatory environment (including government procurement, investment, competition policy, intellectual property rights, labor, the environment, and dispute settlement).. Summary of Findings on Market Access The primary impact of the U.S.-Colombia TPA will be increased U.S. exports to Colombia as a result of enhanced U.S. access to the Colombian market. U.S. imports from Colombia are not expected to grow significantly as a result of trade liberalization under the TPA because most Colombian products already enter the U.S. market free of duty. In 2005, approximately 90 percent of the value of U.S. imports from Colombia entered free of duty either unconditionally or under the Andean Trade Preference Act (ATPA) or other U.S. provisions. Nevertheless, by making ATPA duty-free treatment permanent, the TPA could create additional incentives for investment in export-oriented industries in Colombia.. xv.
(20) Economy-wide Estimates The U.S.-Colombia TPA may have a small, positive effect on the U.S. economy. The benefits will likely be moderated by the small size of Colombia’s economy relative to that of the United States, Colombia’s small share of U.S. trade (about 0.5 percent of total U.S. goods trade in 2005), and the duty-free access most Colombian products already receive. Key findings from the Commission’s analysis are: •. U.S. exports to Colombia are estimated to be $1.1 billion higher with the fully implemented TPA, an increase of 13.7 percent.. •. U.S. imports from Colombia are estimated to be $487 million higher with the fully implemented TPA, an increase of 5.5 percent.. •. U.S. GDP will increase by about $2.5 billion (by less than 0.05 percent).. •. There is likely to be minimal to no effect on output or employment for most sectors in the U.S. economy. The U.S. processed rice, cereal grains (e.g., corn), and wheat sectors are estimated to experience the largest increases in output and employment as a result of the TPA. Only the U.S. sugar sector is estimated to decline by more than 0.1 percent in output or employment.. The Commission’s findings from its quantitative assessment of the effect of tariff elimination on trade in goods are similar to those from other studies using similar quantitative techniques.. Sectoral Estimates The Commission conducted sector-specific analysis of the impact of the TPA for the following sectors: meat (beef and pork); grain (wheat, rice, and corn); soybeans, soybean products, and animal feeds; chemical, rubber, and plastic products; machinery, electronics, and transportation equipment; textiles and apparel; sugar and sugar-containing products; cut flowers; and services. Key findings from the Commission’s analysis are: •. The removal of tariff and nontariff barriers under the TPA is likely to result in a higher level of U.S. exports of meat (beef and pork) to Colombia. Imports of meat from Colombia could eventually increase, but are currently restricted by Colombia’s lack of certification to export fresh, chilled, or frozen beef or pork to the United States.. •. Colombia’s elimination of its tariff and nontariff barriers and certain government support measures under the TPA will likely result in increased U.S. grain exports. Rice accounts for most of the increase, with yellow corn and wheat accounting for the remaining balance.. •. U.S. exports to Colombia of soybeans, soybean products, and animal feeds are likely to increase under the TPA as a result of Colombia’s removal of its tariff and nontariff barriers and government support measures.. xvi.
(21) •. U.S. exports of chemical, rubber, and plastic products are likely to increase as a result of tariff elimination under the TPA.. •. U.S. exports to Colombia of machinery, electronics, and transportation equipment are likely to increase as a result of the TPA. Colombia’s elimination of tariff and nontariff barriers will create new market access opportunities for U.S. exports of motor vehicle parts, oil and gas equipment, construction and mining equipment, pollution control equipment, power generation equipment, radiology equipment, food and beverage processing equipment, information technology equipment, and remanufactured goods.. •. A small increase is likely for both U.S. exports to Colombia and U.S. imports from Colombia of textiles and apparel as a result of tariff elimination under the TPA. In addition, by making ATPA benefits permanent, and thereby generating market certainty, the TPA could result in greater investment in the Colombian textile and apparel sector that could lead to increased Colombian exports of textiles and apparel.. •. Tariff elimination and quota expansion under the TPA will likely have only a minor effect on U.S. imports and production of sugar and sugar-containing products. Although Colombia is expected to fill its new sugar TRQ, TPA provisions will limit Colombian sugar exports to the U.S. market.. •. U.S. imports of cut flowers from Colombia could eventually increase if the TPA encourages increased investment in Colombia’s flower sector and diverts trade away from other South American flower-exporting countries.. •. U.S. exports of services (including financial services and telecommunications services) to Colombia are likely to increase slightly as a result of improved levels of market access, national treatment, and regulatory transparency that will enhance Colombia’s commitments under the WTO General Agreement on Trade in Services. The Commission’s estimate of the tariff rate equivalent of Colombia’s commitments under the TPA in the banking sector indicates that U.S.-based financial institutions are likely to benefit from lower barriers to entry and reduced costs of investing in Colombia as a result of the TPA. As the U.S. services market is already generally open to foreign firms and as the Colombian industries are small, the TPA is not likely to have a measurable effect on U.S. imports of services from Colombia.. Summary of Findings on Trade Facilitation and the Regulatory Environment The overall effects on the U.S. economy and U.S. industries of the trade facilitation and the regulatory environment provisions of the U.S.-Colombia TPA are likely to be small, primarily reflecting the relatively small size of Colombia’s economy and market compared to that of the United States, and the generally open U.S. market. U.S.-based firms are likely to benefit from the application of the TPA trade facilitation provisions by Colombia, which are intended to establish a secure, predictable legal framework and a more stable and reliable trading environment for U.S. firms operating in xvii.
(22) Colombia. The provisions on trade facilitation are likely to expand export opportunities for U.S. firms, particularly for goods subject to technical and regulatory standards and requirements. The trade facilitation provisions of the TPA, designed to expedite the movement of goods and the provision of services between the United States and Colombia, include those related to technical barriers to trade, customs administration, and sanitary and phytosanitary measures, as well as facilitation of electronic commerce. The regulatory-related provisions of the TPA are likely to enhance the environment for bilateral trade and investment, particularly over the medium and long term. U.S.-based firms are likely to benefit from Colombia’s commitments with respect to transparency, trade remedies, government procurement, investment, the protection of intellectual property rights, and dispute settlement.. xviii.
(23) CHAPTER 1 Introduction Scope and Approach of the Report This report assesses the likely effects of the U.S.-Colombia Trade Promotion Agreement (TPA) on the U.S. economy as a whole and on specific industry sectors, including the effects of the TPA on U.S. gross domestic product (GDP); exports and imports; aggregate employment and employment opportunities; and the production, employment, and competitive position of industries likely to be significantly affected by the TPA. The report also assesses the likely effect of the TPA on U.S. consumers. The assessment is based on a review of all 23 chapters of the final text of the U.S.-Colombia TPA, including its annexes and associated side letters. A chapter-by-chapter summary of the TPA provisions is presented in appendix D of this report. To assess the economy-wide effects of the market access provisions of the TPA, the U.S. International Trade Commission (Commission) employed a global computable general equilibrium (CGE) model.1 The use of a model permits the Commission to estimate the possible incremental effects of the negotiated liberalization of tariffs and tariff-rate quotas (TRQs) in the TPA. The static nature of the model assumes that the TPA is fully implemented on January 1, 2007, and not phased in over time;2 therefore, the estimated effects reflect long-term adjustments to a fully implemented TPA. Other policy assumptions about the model are discussed in chapter 2 and in appendix G of this report. The Commission supplemented the economy-wide analysis with sector-specific analysis of the economic effects of specific market access provisions, including the impact of the staged reductions of certain tariffs and TRQs. The U.S. product sectors analyzed were meat (beef and pork); grain (wheat, rice, and corn); soybeans, soybean products, and animal feeds; chemical, rubber, and plastic products; machinery, electronics, and transportation equipment; textiles and apparel; sugar and sugar-containing products; and cut flowers. These sectors were selected for analysis according to a number of criteria, including the importance of the sector or key sector components in terms of bilateral trade, the extent of trade liberalization under the TPA, the potential for increased bilateral trade as a result of the TPA, and industry and Commission views regarding the TPA commitments or the U.S.-Colombia trade relationship in that sector. The Commission also assessed the effects of the TPA’s provisions with respect to trade in services, trade facilitation (e.g., customs administration, technical barriers to trade, and electronic commerce), and the regulatory environment (e.g., government procurement, investment, competition policy, intellectual property rights, labor, the environment, and dispute settlement). With the exception of financial services, the effects of these provisions 1 The Global Trade Analysis Project (GTAP) model and database were used in this investigation. GTAP is a multicountry CGE model with economy-wide coverage of merchandise and service sectors. The GTAP model framework is described in app. G of this report. 2 Under this TPA, duty elimination on some tariff lines is to be phased in over a period of up to 15 years, with some agricultural TRQs (except for sugar) phased out over a period of up to 19 years for U.S. exports, and 15 years for U.S. imports. Information on the tariff commitments of the United States and Colombia is provided in chap. 2 of this report.. 1-1.
(24) were not quantified because of limited data availability;3 however, these provisions can have effects on U.S. GDP, exports and imports, employment, production, and U.S. consumers. Data and other information for the study were obtained from industry reports, interviews with government and industry contacts, official reports of the trade advisory committees, written submissions received in response to the Commission’s Federal Register notice of institution for this investigation,4 and testimony at the public hearing held by the Commission in connection with this investigation.5 Other sources include the U.S. Department of Agriculture, the U.S. Department of Commerce, the U.S. Department of State, the Office of the United States Trade Representative, the World Bank, the World Trade Organization (WTO), the GTAP database, and the Global Trade Atlas database. This report is organized as follows: the remainder of chapter 1 provides overviews of the TPA and U.S.-Colombia bilateral trade; chapter 2 provides a summary of the TPA market access provisions for goods and presents the Commission’s economy-wide analysis of the effects of the TPA; chapter 3 presents analyses for selected sectors; chapter 4 covers the effect of market access for services provisions; chapter 5 covers the effect of trade facilitation provisions; chapter 6 covers the effects of regulatory-related provisions, including investment; and chapter 7 presents a literature review and summarizes the views of interested parties. Additional information is provided in appendices to the report.. Overview of the U.S.-Colombia TPA Like other free trade agreements (FTAs) to which the United States is a party,6 the U.S.Colombia TPA will create a preferential trade regime within a negotiated range of goods and services, with commitments covering other trade-related matters such as trade in services, trade facilitation (including customs administration, technical barriers to trade, and electronic commerce), and the regulatory environment (including government procurement, investment, competition policy, intellectual property rights, labor, the environment, and dispute settlement). Under this TPA, duties on categories of originating goods are to be eliminated immediately or phased out over periods of up to 19 years.7 The TPA contains commitments on matters that were not previously included within the WTO regime or other agreements to which the United States and Colombia are both parties. The TPA does not cover every aspect of bilateral trade or give preferences for all goods under any tariff category, but accords benefits to originating goods. The TPA’s rules of origin grant special tariff treatment to qualified goods upon importer claim, and certain sensitive agricultural products are subject to TRQs for a specific time period. Among the TPA’s objectives, the preamble states that the pact is meant to encourage broad-based economic development to 3 The Commission estimated the tariff rate equivalent of Colombia’s banking sector commitments under the TPA. This analysis is described in chap. 4 and in app. J of this report. 4 A copy of the Federal Register notice is in app. B of this report. 5 The Commission held a public hearing for this investigation on October 5, 2006. A calendar of the hearing is included in app. C of this report, and a summary of hearing testimony and written submissions is provided in chap. 7 of this report. 6 To date, the United States has implemented FTAs with Israel, Canada, Mexico, Jordan, Singapore, Chile, Australia, Morocco, Central America and the Dominican Republic (as of the date of this report, El Salvador, Guatemala, Honduras, and Nicaragua have implemented CAFTA-DR), Bahrain, and Oman. Although signed on April 12, 2006, Congress has not approved implementing legislation for the U.S.-Peru TPA. In addition, the United States is negotiating FTAs with Korea, Malaysia, Panama, Thailand, and the United Arab Emirates. 7 Information on the tariff commitments of the United States and Colombia is available in chap. 2 of this report.. 1-2.
(25) replace drug crop production, strengthen cooperation, help expand trade within a structure of rules, and simplify regional trade. The text of the TPA8 is modeled on other recent U.S. FTAs, particularly the U.S.-Peru TPA and, to a lesser extent, the U.S. FTA with Central America and the Dominican Republic (CAFTA-DR). The TPA contains the particular commitments of each party set forth in schedules and annexes on market access, rules of origin, services, and procurement, as well as general disciplines that apply to both parties. Some provisions also draw upon multilateral instruments of the WTO or other treaties, or state that the same obligations apply under this TPA. These obligations will exist separately, even if the corresponding WTO agreement provision were eliminated. Some TPA commitments deal with specific aspects of trade relations between the parties, and side letters provide for ongoing cooperation or cover other specific matters. Appendix D provides a chapter-by-chapter summary of the text of the U.S.Colombia TPA. Table 1-1 identifies the chapters of the TPA and where they are analyzed in this report.9. U.S.-Colombia Trade Overview In 2005, most U.S. imports from Colombia (approximately 90 percent, by value) entered the United States free of duty. Consequently, it is expected that the main impact of the U.S.Colombia TPA will be to increase U.S. exports as a result of enhanced access to a more open market in Colombia. This section presents an overview of U.S.-Colombian bilateral merchandise trade in 2005.. U.S. Exports U.S. merchandise exports to Colombia were valued at $5.0 billion in 2005, ranking Colombia as the 28th largest market for U.S. exports.10 Colombia accounted for less than 1 percent of total U.S. exports of $804.0 billion in 2005. U.S. exports to Colombia have increased at a compound annual growth rate of approximately 7 percent since 1991, and at a compound annual growth rate of 10 percent since 2002 (figure 1-1). Appendix table E-1 shows the leading U.S. exports to Colombia in 2005. Corn ranked as the single largest U.S. export to Colombia in 2005, with exports valued at $228 million. Other leading U.S. exports to Colombia were chemicals (including vinyl chloride, petroleum oils, propene, styrene, and fertilizers), parts for drilling/earthmoving machines, and machinery-related equipment (including computers and computer parts and communications equipment). Wheat ranked as the 4th leading U.S. export to Colombia, valued at $127 million; the United States supplied 58 percent of Colombia’s wheat purchases by value in 2005.11. The text of the U.S.-Colombia TPA is available at http://www.ustr.gov. Summaries are not intended to interpret the text or to identify the negotiators’ intent. Chapters of the TPA that address primarily administrative and legal matters (TPA chaps. 1, 20, 22, and 23) are not further analyzed in this report. Other chapters of the TPA are summarized and analyzed in chaps. 2–6 of this report. 10 The term “exports” refers to domestic merchandise exports. 11 The impact of the TPA on U.S. wheat exports to Colombia is discussed in more detail in chap. 3 of this report. 8 9. 1-3.
(26) Table 1-1 U.S.-Colombia TPA: Location of analysis of TPA chapters in the Commission’s reporta Chapter of Commission’s report where TPA chapter analyzed 1. Initial Provisions and General Definitions Appendix D 2. National Treatment and Market Access for Goods Chapter 2 3. Textiles and Apparel Chapter 2 4. Rules of Origin Procedures Chapter 2 5. Customs Administration and Trade Facilitation Chapter 5 6. Sanitary and Phytosanitary Measures Chapter 5 7. Technical Barriers to Trade Chapter 5 8. Trade Remedies Chapter 6 9. Government Procurement Chapter 6 10. Investment Chapter 6 11. Cross-Border Trade in Services Chapter 4 12. Financial Services Chapter 4 13. Competition Policy Chapter 6 14. Telecommunications Chapter 4 15. Electronic Commerce Chapter 5 16. Intellectual Property Rights Chapter 6 17. Labor Chapter 6 18. Environment Chapter 6 19. Transparency Chapter 6 20. Administration of the Agreement and Trade Capacity Building Appendix D 21. Dispute Settlement Chapter 6 22. Exceptions Appendix D 23. Final Provisions Appendix D Annex I Non-Conforming Measures for Services and Investment Chapters 4 and 6 Annex II Non-Conforming Measures for Services and Investment Chapters 4 and 6 Annex III Non-Conforming Measures for Financial Services Chapters 4 and 6 Understanding Regarding Biodiversity and Traditional Knowledge Chapter 6 (included with IPR) a Chaps. 1, 20, 22, and 23 of the U.S.-Colombia TPA address primarily administrative and legal matters with respect to the agreement and, hence, are summarized in app. D but not analyzed in this report.. 1-4.
(27) Figure 1-1 U.S. m erchandise trade with Colom bia, 1989-2005. Source: U.S. Departm ent of Com m erce.. Colombia is a member of the Andean Community and applies the Andean common external tariff (CET) to U.S. and other non-Andean goods.12 In addition to the Andean Community, Colombia has preferential trade agreements with a number of other Latin American countries. 13 As a result, most U.S. goods face higher tariffs upon entry into Colombia than do goods of some of Colombia’s leading trade partners. Table 1-2 summarizes Colombian tariff rates applied to U.S. exports. This table shows that more than 97 percent of Colombian tariff rate lines on imports from the United States currently have base tariff rates exceeding 0 percent, and that approximately one-half of Colombian tariff rate lines on imports from the United States currently have base rates exceeding 10 percent. Table 1-3 presents a list of selected nontariff impediments to trade that Colombia will eliminate under the TPA.. 12 The Andean Community is a free trade area among its members and a customs union that applies a common external tariff (CET) on goods from nonmembers. Other Andean Community members are Bolivia, Ecuador, Peru, and Venezuela. The basic CET tariff rates are 5, 10, 15, and 20 percent. 13 Colombia’s preferential trade agreements are summarized in the economic profile in app. E. of this report.. 1-5.
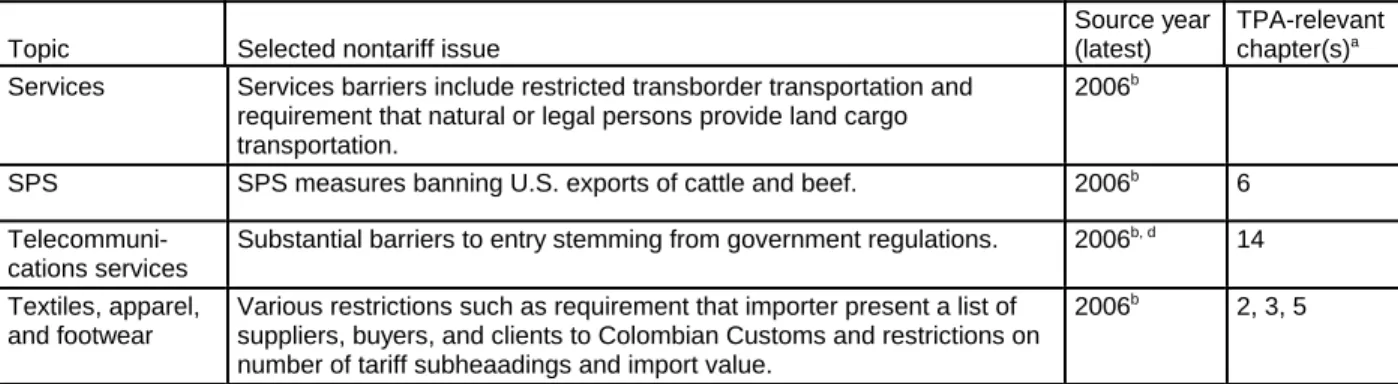
(28) Table 1-2 Applied Colombian tariff rates on U.S. exports Tariff base rate (percent). Number of tariff lines. Percent of total tariff lines. 173. 2.5. >0 to 5. 2,083. 30.2. >5 to 10. 1,225. 17.7. >10 to 20. 3,282. 47.5. 0. >20 to 35. 97. 1.4. >35. 46. 0.7. 6,906. 100.0. Totala Source: U.S.-Colombia TPA, Colombia Tariff Schedule.. Note: Does not include tariff lines with base rate values of blanks. a. Total of 6,906 tariff lines includes 5,986 industrial and textile tariff lines and 920 agricultural tariff lines, as described in more detail in chap. 2 of this report. See tables 2-1 and 2-2 for summaries of Colombian tariff commitments under the TPA.. Table 1-3 Colombia: Selected nontariff impediments Topic Agriculture Agriculture Automotive products Discriminatory taxes. Government procurement Government procurement IPR. Professional services Regulatory. Remanufactured goods Remanufactured goods. Selected nontariff issue Discretionary import licensing used to ban imports of milk powder and poultry parts. Implementation of price-band scheme on various agricultural commodities and substitutes. Colombia, via the Andean Community’s common automotive policy, favors local investment through minimum local content requirements for reduced import duties. Colombia assesses a value-added tax of 35 percent on whiskey aged for less than 12 years, which is more characteristic of U.S. whiskey, compared to a rate of 20 percent for whiskey aged for 12 or more years, most of which comes from Europe. The consumption tax regime discriminates against imported distilled spirits by applying arbitrary breakpoints. A number of provisions favor domestic suppliers in government procurement. Lack of transparency in exemption regimes Infringement of IPR remains a serious problem in Colombia, especially in the area of trafficking and producing counterfeit goods. Issues concern lack of uniformity and consistency in IPR registration and oversight procedures, lax customs enforcement, and the inability to conclude legal cases. Economic needs tests and labor composition requirements hamper provision of professional services. Labeling requirement for textile products. Sanitary registration required for imports of processed foods, pharmaceuticals, cosmetics, and household insecticides. Colombia treats remanufactured goods as used goods, thereby limiting the market access for major U.S. makers of high-quality remanufactured goods. Colombia maintains prohibition on various remanufactured items, including agricultural equipment, aircraft and related goods, automotive/transportation and related parts, construction equipment, environmental goods, infrastructure and machinery goods, and medical and scientific equipment.. 1-6. Source year (latest) 2006b. TPA-relevant chapter(s)a 2. 2006f, g. 2. 2006c, f, g. 2, 4. 2006b. 2. 2006b. 9. 2006b, d. 9. 2006b. 16, 19. 2006b, d. 11. 2006b 2006f. 2, 3. 2006b, e. 2, 4. 2006e, g. 2, 4.
(29) Table 1-3 Colombia: Selected nontariff impediments–Continued Topic Services. SPS Telecommunications services Textiles, apparel, and footwear. Selected nontariff issue Services barriers include restricted transborder transportation and requirement that natural or legal persons provide land cargo transportation. SPS measures banning U.S. exports of cattle and beef.. Source year (latest) 2006b. TPA-relevant chapter(s)a. 2006b. 6. b, d. Substantial barriers to entry stemming from government regulations.. 2006. 14. Various restrictions such as requirement that importer present a list of suppliers, buyers, and clients to Colombian Customs and restrictions on number of tariff subheaadings and import value.. 2006b. 2, 3, 5. Sources: As cited. Note: Examples selected based on survey of standard sources regarding nontariff trade impediments. Citations represent the Colombian environment in the year of publication; no assumptions are made as to whether these represent the current environment. a. Including annexes and side letters. U.S.-Colombia TPA, available at http://www.ustr.gov. USTR, “Colombia,” 2006 National Trade Estimate Report on Foreign Trade Barriers. c European Commission, EU Market Access Sectoral and Trade Barriers Database. d U.S. Commercial Service and U.S. Department of State, Doing Business in Colombia. e U.S. Department of Commerce, ITA, Industry Trade Policy reports. f EIU, Colombia: Country Commerce. g WTO, Trade Policy Review: Colombia. b. U.S. Imports U.S. merchandise imports from Colombia were valued at approximately $8.8 billion in 2005, ranking Colombia as the 31st largest U.S. import supplier.14 Colombia accounted for less than 1 percent of the $1.6 trillion in total U.S. imports in 2005. Imports were fairly concentrated in a few product categories, primarily petroleum oils and related products, coal, coffee, gold, men’s and boys’ trousers and shorts, fresh cut flowers, and bananas (appendix table E-3). Fossil fuels accounted for more than one-half of U.S. imports from Colombia in 2005. Coffee was the only nonmineral to account for more than 5 percent of total U.S. imports from Colombia. In 2005, Colombia supplied more than one-half of total U.S. imports of coal, chrysanthemums, roses, and plantains. Colombia is a designated beneficiary of the Andean Trade Preference Act (ATPA) and of the U.S. Generalized System of Preferences (GSP) program.15 In 2005, approximately 90 percent of U.S. imports from Colombia, valued at $7.7 billion, entered the United States free of duty either unconditionally under normal trade relations (NTR)16 or under ATPA, GSP, or other duty-free provisions. Approximately 60 percent of all U.S. duty-free imports from Colombia in 2005 were entered under ATPA (appendix table E-4).. The term “imports” refers to merchandise imports for consumption. ATPA was enacted in 1991 and was amended in 2002 by the Andean Trade Promotion and Drug Eradication Act (ATPDEA). ATPDEA renewed and enhanced ATPA benefits. Use of the acronym “ATPA” in this report refers to ATPA as amended by ATPDEA. ATPA and GSP are discussed in more detail in app. F of this report. 16 This is nondiscriminatory tariff treatment, which is commonly and historically called “most-favored nation” (MFN) status in international trade circles and is called “normal trade relations” (NTR) status in the United States. The two terms are used interchangeably in this report. 14 15. 1-7.
(30) Between 1991 (when ATPA was signed into law) and 2005, U.S. imports from Colombia increased at a compound annual growth rate of almost 9 percent (figure 1-1). Imports—especially of apparel articles—from Colombia have increased even more rapidly since ATPA was renewed and expanded in 2002. Since the expansion of these trade preferences, U.S. imports from Colombia increased at a compound annual growth rate of approximately 13 percent between 2002 and 2005. Based on the current U.S. tariff schedule summarized in table 1-4, 62 percent of U.S. tariff rate lines on imports from Colombia have a base rate of other than free (not including any tariff lines now eligible for ATPA or GSP duty-free entry), and 11 percent of U.S. tariff rate lines on imports from Colombia have base rates exceeding 10 percent.. Table 1-4 Applied U.S. tariff rates on imports from Colombia Tariff base rate (percent). Number of tariff lines. Percent of total tariff lines. 0. 4,038. 38.0. >0 to 5. 3,166. 30.0. >5 to 10. 2,267. 21.3. >10 to 20. 848. 8.0. >20 to 35. 208. 2.0. >35. 107. 1.0. 10,634. 100.0. Totala Source: U.S.-Colombia TPA, U.S. Tariff Schedule.. Note: Table does not reflect duty-free status available for tariff lines on imports from Colombia under ATPA or GSP. a Total of 10,634 tariff lines includes 8,817 industrial and textile tariff lines and 1,817 agricultural tariff lines, as described in more detail in chap. 2 of this report. See tables 2-1 and 2-2 for summaries of U.S. tariff commitments under the TPA.. Trade Balance The U.S. balance of trade with Colombia has moved from a surplus of $216 million in 1998 (the most recent year in which a surplus occurred) to a record high deficit of $3.8 billion in 2005 (figure 1-1). The U.S. trade deficit with Colombia has averaged more than $2.8 billion annually since 1999, reflecting in part the significant share of total U.S. imports from Colombia accounted for by fuel-related products.. 1-8.
(31) CHAPTER 2 Goods Market Access and Economy-Wide Analysis The main impact of the market access provisions of the U.S.-Colombia TPA will occur through increased U.S. exports as a result of enhanced access to a more open market in Colombia. U.S. imports are not expected to grow significantly because most Colombian products already enter the U.S. market free of duty. This chapter presents an economy-wide analysis of the potential effects of the U.S.Colombia TPA with respect to market access for goods.1 It begins with a summary and assessment of the tariff commitments made by the United States and Colombia in the TPA. That assessment is followed by an economy-wide analysis of the TPA. Using a general equilibrium model, the Commission estimates the potential effects of the elimination of tariffs and quotas under the agreement on the U.S. economy as a whole, including the effects on GDP, exports and imports, production, employment, the competitive position of industries, and consumers.. Summary of Assessments Goods Market Access The U.S.-Colombia TPA provides for the elimination of tariffs on bilateral trade in all eligible goods. As discussed in chapter 1 of this report, most U.S. exports to Colombia are subject to tariffs, while most U.S. imports from Colombia enter free of duty either unconditionally under MFN, or under ATPA, GSP, or other duty-free provisions.2 Consequently, the main effect of the TPA will be associated with Colombia’s tariff reductions on U.S. exports. The staging of tariff elimination varies from immediate for the majority of tariff lines to a 5- to 10-year period for most remaining tariff lines, with some agricultural TRQs phased out over periods of up to 19 years. Key goods market access provisions of the agreement are: •. Industrial and textile tariffs: Upon implementation of the TPA, more than 99 percent of U.S. and almost 76 percent of Colombian industrial and textile tariff lines will be free of duty. Virtually all industrial and textile tariff lines for both parties will be duty free by year 10 of the agreement.. •. Textiles and apparel provisions: The TPA will immediately eliminate all tariffs on bilateral trade in textiles and apparel that meet the TPA rules of origin, thereby making permanent the duty-free benefits currently available under ATPA for almost all U.S. imports of Colombian apparel. The TPA will result in duty-free treatment. 1 Although most chapters of the U.S.-Colombia TPA deal with improving market access by addressing trade facilitation, investment, and regulatory environment aspects, market access provisions described in this chapter specifically refer to chaps. 2, 3, and 4 of the TPA (and related annexes and side letters). 2 ATPA and GSP are described in more detail in app. F of this report.. 2-1.
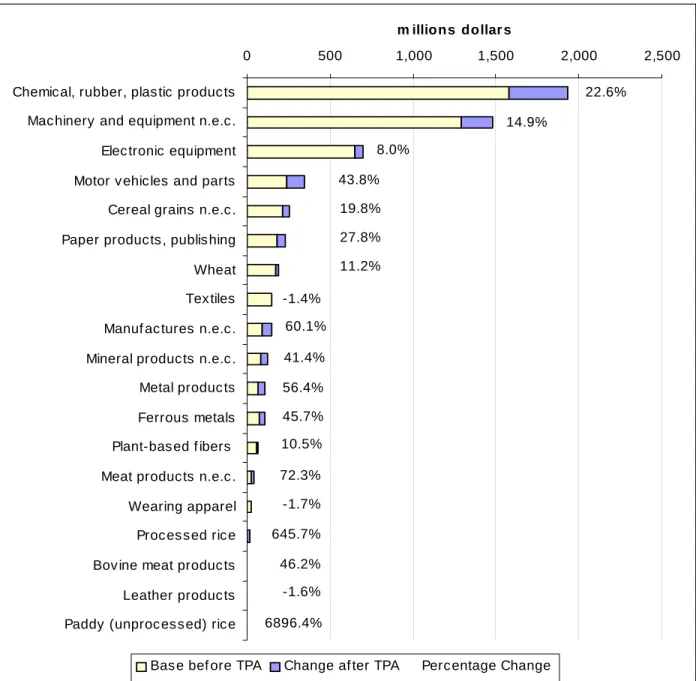
(32) for the first time for U.S. imports of originating textiles from Colombia and for U.S. exports of textiles and apparel to Colombia. •. Agricultural tariffs: More than 89 percent of U.S. and 77 percent of Colombian agricultural tariff lines are already duty free or will become duty free immediately upon TPA implementation. Virtually all in-quota agricultural tariff lines for both parties will be duty free by year 15 of the agreement.. •. National treatment and rules of origin: The commitments on national treatment and market access are similar in form to the corresponding provisions of the multilateral trade provisions administered by the WTO. The parties agree to eliminate their customs duties on “originating goods,” unless otherwise provided, and to refrain from increasing any duty rate, imposing a new rate, or imposing or expanding performance requirements to obtain a TPA benefit.. Economy-wide Analysis The Commission’s simulation of the economy-wide effect of tariff and quota elimination under the TPA estimates that U.S. GDP will increase by about $2.5 billion, an increase of less than 0.05 percent. These effects are driven mainly by the removal of Colombian tariffs and the subsequent improvement in the U.S. terms of trade. •. Tariff asymmetry: As a result of Colombia’s status as an ATPA beneficiary, Colombian exporters generally face substantially lower tariffs in the U.S. market than do U.S. exporters in the Colombian market. With few exceptions, Colombia’s average ad valorem tariff equivalent rates in the economy-wide model range from 10 to 20 percent, whereas almost all U.S. sector average tariff rates in the model are zero or near zero, with only one exceeding 3 percent (sugar). Given this tariff asymmetry, the TPA is likely to result in a much larger increase in U.S. exports to Colombia than in U.S. imports from Colombia.. •. U.S. exports to Colombia: Based on the results of the economy-wide model simulation, U.S. exports to Colombia are estimated to be $1.1 billion higher with the fully implemented TPA. The largest estimated increases in U.S. exports, by value, are in chemical, rubber, and plastic products; machinery and equipment; and motor vehicles and parts. The largest estimated increases in U.S. exports, by percent, are in rice (processed and unprocessed) and dairy products.. •. U.S. imports from Colombia: Based on the results of the economy-wide model simulation, U.S. imports from Colombia are estimated to be $487 million higher with the fully implemented TPA. The largest estimated increases in imports, by value, are in sugar and crops not elsewhere classified (n.e.c.); the largest estimated increases in U.S. imports, by percent, are in dairy products and sugar.. •. U.S. industries: The TPA is likely to result in minimal to no effect on output or employment for most sectors of the U.S. economy. The processed rice, cereal grains, and wheat sectors are estimated to experience the largest increases in output and employment. Only the U.S. sugar sector is estimated to register a decline of more than 0.1 percent in output or employment.. 2-2.
Figure


+7


Documento similar
49. The RCGP recommends that there is increased investment in research and development and funds to support primary care mental health services to increase education and training
Firstly, it is important to note that Gili Trawangan offers a wide range of services to its customers, with the added value that good quality services are offered, both by
Combined with traditional types of geospatial web services (e.g., Web Map Services, Web Feature Services), Sensor Web Enablement and Web Processing Service specifications are
the other hand, the role of inward investment promotion is to improve the image of the country as an R&D location and to provide targeted services to both potential and existing
These includes measures of health care (hospital beds per person, measles immunization rates for children), measures of access to public services (availability of sanitation
Therefore, it is observed that color flyers, printed both sides, were much more usual in the group of Company and Asian (100%), that in the group of Independent or Group,
While, in Barcelona (Spain), the assessment of regulating and cultural services supplied by the Collserola peri-urban Natural Park, demonstrates how a compact city
D ISTIL is accompanied with a set of code generators able to synthesize the repository structure and persitence services, to generate support for basic (REST) services for the
