TítuloEffects of static magnetic fields on the visual cortex: reversible visual deficits and reduction of neuronal activity
15
0
0
Texto completo
(2) conditioned taste aversion was induced by exposure to a 9.4-T magnetic field for 30 min that lasted up to 8 days (Nolte et al. 1998). Very recently, it was shown that the application of a moderate [45 Mega Gauss Oersteds (MGOe) nominal strength 628 N ≈ 0.5 T] SMF on the primary motor cortex of healthy volunteers using a Neodymium magnet for 10 min was able to reduce cortical excitability by 25% as determined by transcranial magnetic stimulation-induced motor-evoked potentials (Oliviero et al. 2011). This effect lasted for 6 min, and no side effects were reported. These results have been replicated by other groups (Silbert et al. 2013), suggesting that clinical use in the future might be possible because transcranial static magnetic stimulation (SMS) of the motor cortex decreases cortical excitability, which may be of interest in several pathological conditions such as, for instance, epilepsy; this possibility is further supported by data obtained in animal models (McLean et al. 2003, 2008) and opens the door for the inclusion of small magnets in the pool of tools available to modulate neuronal excitability in a noninvasive way. Here, we investigated the behavioral and neurophysiological effects produced by SMS by means of a neodymium 0.5-T magnet applied to the primary visual cortex (V1) of behaving monkeys during a psychophysical task and on the V1 of anesthetized cats. We found that detection of visual stimuli is strongly disrupted in behaving animals, and neuronal responses were reduced in the anesthetized animals, suggesting an effect compatible with a decrease of excitation. These results indicate that SMFs might have enormous potential as modulators of neuronal activity for different purposes. Materials and Methods Experiments were carried out in 2 awake, behaving primates (Macaca mulatta) and 2 anesthetized and paralyzed adult cats. Experiments followed the rules of the Spanish Society of Physiology, International Council for Laboratory Animal Science, and the European Union (Bylaw No. 86/809) and were approved by the ethics committee of the University of Coruña. Primate Experiments Monkeys were trained to fixate for 500 ms (fixation window 2°) on a small dot (0.1°) presented at the center of a monitor screen placed at a distance of 57 cm from the animal. A bright spot (2°) of various contrasts (1.5–100%) was randomly presented on a gray background (17.9 cd/m2) at 8 possible positions around the center dot, marked from A to H in Figure 1A (distance from the center 7°). The animal had to resolve a simple contrast-detection task (see below) indicating the position of the bright spot with a saccadic movement. Correct performance was rewarded with a drop of water. Monkeys had their head fixed during the task, and eye position was continuously monitored using an eye-tracking system (EyeLink II; SR Research). Reaction time was defined as the time from stimulus onset to the saccade. Animal worked up to 4 h per day, 5 days a week, from Monday to Friday..
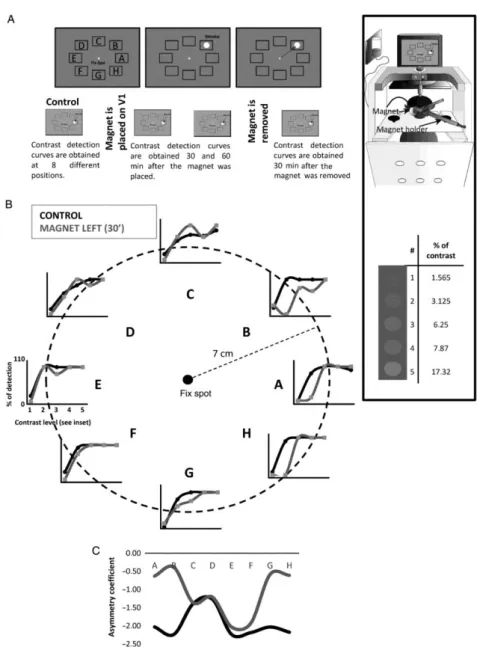
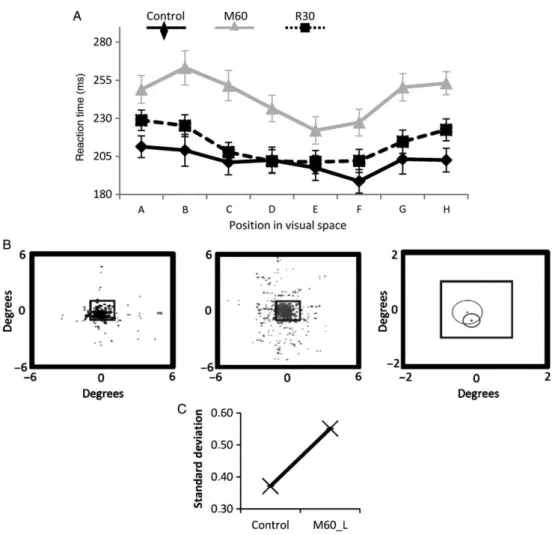
(3) Figure 1. (A) The visual task (top panel) consisted of maintaining the view of a fixed spot until a bright spot appeared on the screen. At that moment, the animal must make a saccade to the position of the new spot. The stimulus appeared randomly at 1 of 8 positions marked from A to H in the figure (not visible for the animal). The timeline of the session is shown in the bottom panel. After control-detection curves were obtained, the magnet was placed on V1, and the visual task repeated at 30 and 60 min. The magnet was then removed and recovery test performed after 30 min. The inset on the right shows the position of the monkey during the experiments and the approximate position of the magnet on the occipital cortex (top) as well as the values and appearance of the different contrasts (bottom). (B) Effect of a static magnetic field on visual detection in a single session. In this session, the magnet was placed on the left visual cortex of the primate for 30 min. Each graph represents the percent detection of the visual stimulus at each position of the visual space (A–H) with different contrasts (1–5) in the control (black) and under the influence of the magnet (gray). (C) Asymmetry coefficient for both conditions. Higher values of the gray line compared with the black one indicate that the magnet caused displacement of the detection curve to the right (i.e., lower detection). Positions (B, A, H and G) (on the right side of the visual space) were the most affected by the magnet when placed on the left side of the brain (statistically significant). Recovery curves are not shown for simplicity.. We calculated the percent of stimulus detection for each contrast at each position and compared it with the corresponding value after SMS, which allowed us to build contrast-detection curves for each position of the visual space in different experimental conditions. We also calculated the asymmetry coefficient, which measures the degree of symmetry of a distribution of points with respect to their arithmetic mean. A positive value of this index means that the distribution is skewed to the left, and a negative value indicates that the distribution is skewed to the right. If the distribution is perfectly symmetrical, the asymmetry coefficient is zero. In our analysis, the asymmetry coefficient becoming less negative implies that the effect of the magnet is greater in that position..
(4) Mathematically,. where µ is the arithmetic mean, and σ is the standard deviation. Experimental Session The aim of these experiments was to test whether and how the application of a SMF interfered with visual perception. Control contrast-detection curves with 5 contrasts, 8 different positions, 10 trials at each contrast/spatial position (400 trials total) were obtained at the beginning of each session (see Fig. 1). A neodymium magnet (see below) was placed on the scalp, on V1 area, next to the midline and centered on one hemisphere, and the visual detection task was repeated every 30 and 60 min with the magnet still in place. The hemisphere (left or right) was randomly chosen at the beginning of the session. Recovery data were obtained 30 min after removing the magnet using the same contrast-detection task described above. A total of 16 sessions (16 days) (8 for monkey A and 8 for monkey B) were carried out with this protocol. The animals performed up to 2500 trials per session. To study different experimental conditions, such as swapping the magnet from one hemisphere to another or testing the effect at 20, 40, and 60 min, we used the same task described above but with only one contrast (6.25%), so the number of trials necessary for one protocol was reduced from 400 to 80 (8 positions × 10 trials each). This simpler protocol was used in 24 additional sessions, 13 for monkey A, and 11 for monkey B. Data were analyzed with a three-way analysis of variance for repeated measures (ANOVA-RM), performing the Greenhouse–Greiser correction for nonsphericity when necessary. Three within-subjects factors were set, the factor CONDITION with 2 levels (Control and Magnet), the factor POSITION with 8 levels (A-H) and the factor CONTRAST with 5 levels (1–5). In the case of significant differences, post hoc analysis was performed using the Tukey honestly significantly different (HSD) test. All results were considered significant at P < 0.05. We measured the influence of the magnet on other parameters such as the reaction time (time from stimulus onset to the start of the saccade). These measurements were made only using one contrast (6.25%). The reaction time at 6.25% contrast was assessed with a two-way ANOVA-RM, performing the Greenhouse–Greiser correction for nonsphericity when necessary. Two within-subject factors were set, the factor CONDITION with 3 levels (Control, Magnet, and Recovery) and the factor POSITION with 8 levels (A–H). In the case of significant differences, post hoc analysis was performed using the Tukey HSD test. All results were considered significant at P < 0.05. Sham Experiments In 2 sessions intended to discard any possible artifact due to repetition of the task, the positioning of the magnet or any other unknown circumstance, we performed control contrast-detection curves using the same protocol as in the Magnet condition (i.e., similar number of trials, position, and contrast levels) and then placed a nonmagnetic replica of the magnet made in stainless steel on the same positions where the magnet was placed using the same homemade mechanical device used for the magnet. The replica was maintained in that position for up to 60 min following the protocol used in the Magnet condition. Recovery occurred at 30 min, as explained above. We compared the data in the Control condition versus the Sham and Recovery conditions using the same statistical tools used for the magnet experiments. The Magnet We used a cylindrical nickel-plated (Ni–Cu–Ni) NdFeB magnet with a 45 mm diameter and 30 mm thickness weighting 360 g (NEUREK S.L., Toledo Spain). The maximum amount of magnetic energy stored in this magnet was 45 MGOe, with a nominal strength of 765 N (78 kg). Our own measurements (Rivadulla et al. 2013) showed a magnetic field of 0.5 T next to the magnet and ∼0.3 T at 1 cm. A nonmagnetic replica of identical appearance and weight (i.e., indistinguishable from the magnet) was used for the sham SMS (NEUREK S.L., Toledo Spain)..
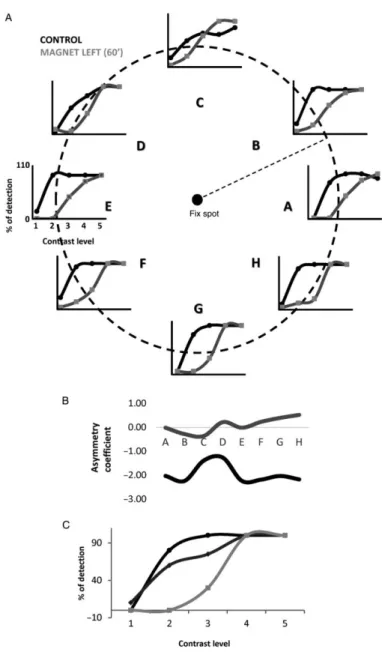
(5) Cat Experiments Two adult female cats, 2.5–3 kg, were anesthetized with isofluorane (1–5% for induction, 0.1–1.5% for maintenance) in nitrous oxide (70%) and oxygen (30%). Animals were held in a stereotaxic frame, and neuromuscular blockade was established with gallamine triethiodide (40 mg initial dose, then 10 mg kg−1 h−1). EEG, ECG, expired CO2, and temperature were monitored and maintained continuously to ensure that anesthetic levels were altered as appropriate to maintain an adequate state of anesthesia. Changes in parameters that indicated a decrease in anesthetic levels (e.g., changes in intersystolic interval, decreasing spindle frequency, increase in end-tidal CO2) were immediately counteracted by increasing the isofluorane levels accordingly. Lidocaine (lignocaine) gel was applied to the ear bars of the stereotaxic frame, and all wound margins were treated with subcutaneous injections of lidocaine. The eyes were treated with atropine methonitrate and phenylephrine hydrochloride, protected with zero-power contact lenses, and brought to focus on a semiopaque tangent screen 57 cm distant using appropriate trial-case lenses. Visual stimuli were viewed monocularly through 2-mm artificial pupils. At the end of the experiments, all of the animals were killed by anesthetic overdose. Cells were extracellularly recorded in V1 (Horsley-Clarke coordinates: anteroposterior, −2 to −8 mm relative to interauricular line; mediolateral, +0–6 to +1–5 mm relative to midline) using tungsten microelectrodes (FHC, USA) introduced through a small craniotomy. Our basic protocol was to establish control responses to sinusoidal drifting gratings of optimal spatial and temporal frequency or to a drifting bar stimulus, moving backward and forward through the receptive field at various orientations. Responses were averaged over 20 trials and were assessed from the accumulated count in the binned peristimulus time histograms, using separate epochs for the baseline and visual responses. The magnet was placed on the scalp, on the V1 area, and the visual protocol was repeated at different time intervals. The magnet was manually placed as near to the electrode as possible and held in place by an articulated mechanical support. To facilitate this approach and allow a partial overlap, the electrode was introduced from behind at an angle of ∼45°. With this spatial arrangement, most likely recorded cells were in superficial layers. SMS lasted for a maximum of 75 min, and recoveries lasted up to 90 min after the magnet was removed. Waveforms and time stamps were stored (Plexon, Inc., USA), and offline spike sorting was used to assess adequate isolation of spikes. Visual stimuli were presented monocularly on a computer monitor (mean luminance of 14 cd m−1, refresh rate 128 Hz). For each cell, the number of spikes per trial during the 20 trials was compared between the control and magnet conditions using a paired sample t-test. Results The experiments reported here were performed on 2 behaving monkeys (Macaca mulatta) and 2 anesthetized and paralyzed adult cats. SMS Impairs Visual Detection After control contrast-detection curves were obtained for each spatial location (marked from A to H in Fig. 1A), a neodymium magnet was placed on V1 (left or right hemispheres) and the visual task was repeated at different intervals (see Materials and Methods). Figure 1B shows, for a single session, the percentage of detection at each position of the visual space for stimuli of 5 different contrasts in the control (black lines) and 30 min after the magnet was placed on the left side of the occipital cortex (gray lines). In the control situation, the percent of stimulus detection was close to 100% for contrasts of 3.15% and above. However, after 30 min of magnet exposition, the percentage of detection dropped for the contrast of 3.15 at several positions on the right side of the visual space, indicating a suppression of the perceived stimulus at those locations (B, A, and H). Figure 1C shows the asymmetry coefficient for each position in both conditions (control and after magnet). In those locations where the gray line is above the black line (A, B, G, H), a displacement of the detection curve to the right is identified. This finding indicates poorer stimulus detection than in the control. The Effect of SMS Develops with Time The strength and extension of the effect of the magnetic field upon animal performance is time dependent. Figure 2 shows the effect of maintaining the magnet for 60 min, continuing the same session depicted in Figure 1. Figure 2A compares control responses (the same as in Fig. 1) versus magnet at each position for the different contrasts, and Figure 2B shows the asymmetry coefficient. After 60 min, the effect appears at.
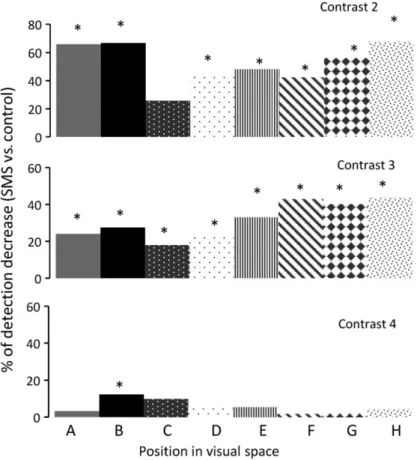
(6) higher contrasts (it is clear also for 6.25 in this condition) and extends to all the 8 positions tested (the whole visual field). The gray line in Figure 2B is always above the black line, and values are higher when compared with those observed after only 30 min (see Fig. 1C), showing an increase in both the extension and intensity of the effect. This is further illustrated in Figure 2C. Here, we selected a single position in visual space (G, center-bottom) to compare control responses with those obtained at 30 and 60 min under SMS. In summary, we observed that the effects on stimulus detection were stronger in both intensity and spatial extension when the exposure time to the magnetic field was increased.. Figure 2. The effect of SMS increases with time. (A) Effect of a static magnetic field on the left visual cortex of the primate for 60 min on visual detection. Legends as in Figure 1B. Data correspond to the same session shown in Figure 1B to show the evolution of the effect. (B) Asymmetry coefficient for both conditions. After 60 min, the effect was more intense, and it extended to the whole visual space. (C) Comparison of the effect at 30 (dark gray) and 60 (light gray) min of SMS at position G.. It is difficult to obtain a global picture of the effect, because it differs for each position of the visual space and depends on the exact position of the neodymium magnet. Still, in an attempt to show the robustness and consistency of our observations, we averaged the results obtained for the second monkey in 8 sessions at different days using exactly the same parameters of SMS, 60 min over the left hemisphere and 30 min of recovery. The results are represented in Figure 3. Each bar histogram shows the percentage of decrease for contrasts 2, 3, and 4 at each position of the visual space (A to H). The actual values.
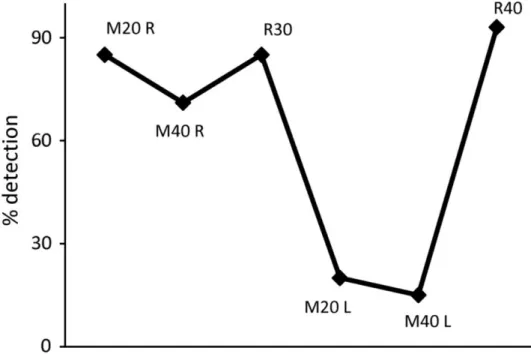
(7) (±SEM) are shown in Supplementary Table 1, including those for recovery that were not depicted in the figure for the sake of clarity. It is clear from the figure that SMS for 60 min produced a consistent and reliable effect on the visual detection for contrasts 2 and 3, with significant reductions at almost all positions of the visual space (P < 0.05 repeated-measures ANOVA, bold values in Supplementary Table 1).. Figure 3. Averaged data (8 sessions in monkey B) of the decrease in the percentage detection for 3 different contrasts after 60 min of SMS. Each bar represents a position in visual space. *P < 0.05 (ANOVA).. The data shown so far seem to point to a stronger effect over the cortical area immediately below the magnet. Figure 4A shows the percentage of stimulus detection at 2 different positions of the visual space (C and G) for a single session for the second monkey under the following different experimental conditions: control, 20, 40, and 60 min after the magnet was positioned on the right side of the occipital lobe and recovery after 45 min. While in C the effect reached the maximum just 20 min after the magnet was placed, and the detection level fell below 10%, in G there was a progressive decay of detection, and the maximum drop was up to 63% of initial response. Figure 4B shows a polar plot representing the difference in detection between control conditions and after 60 min of SMS for contrast 3. The values on the graph indicate the averaged effect for positions CDE versus GHA (P < 0.05 paired sample t-test). As expected from the spatial representation of visual space in V1, moving the magnet from one hemisphere to another should switch the affected regions of the visual space. An example is shown in Figure 5. For position H in the visual space after 20 min of SMS over the right hemisphere (M20 R), the percent of stimulus detection was 85% (vs. 95% in control) and 71% after 40 min (M40 R). After a recovery period of 30 min (R30), the magnet was positioned on the other hemisphere (left) and after only 20 min of SMS, the stimulus detection measured at position H dropped to 20% (M20 L). Recovery was complete after 40 min (R40)..
(8) Figure 4. (A) Effects of SMS (20, 40, 60 min) on the right V1, single session, observed at 2 positions in the visual space. Although in position C the effect is maximized at 20 min, at G the effect continues to grow throughout the whole period, and the percentage of detection is still 63%. Contrast 3. (B) Polar plot representing the difference between the control and 60 min of SMS for the different visual positions for contrast 3. Values show the averaged intensity of the effect for positions CDE versus GHA.. Figure 5. Effect of changing the magnet from the right hemisphere to the left for position H. Contrast 3..
(9) SMS Increases Reaction Time SMS also affected other parameters of the task. Figure 6A shows the analysis of reaction time over 7 sessions. Reaction time increased (22% at M30 and 27 at M60, P < 0.05 ANOVA, see Supplementary Table 2), and fixation precision during the same sessions was also altered given that the standard deviation of ocular movements during fixation increased by 48.5%, from 0.3714 ± 0.032 to 0.5515 ± 0.1 (P < 0.01, paired sample t-test) (Fig. 6B,C).. Figure 6. (A) Reaction times in the control situation after 60 min of SMS and after 30 min of recovery. Averaged values from 7 sessions. (B) Example of ocular movement dispersion in the control (left) and after 60 min of SMS (center). The right panel shows the bidimensional standard deviation as a circle centered at the mean value for the points. (C) The average standard deviation for 7 sessions shows a significant increase (P < 0.01 t-test) after SMS.. In 2 sessions, the longest protocol (60 min) was repeated, changing the magnet to a nonmagnetized metal cylinder but otherwise identical in size, appearance, and weight to test whether the observed changes in visual detection were due to some (improbable) placebo effect. No changes were observed under the sham condition (see Supplementary Table 3). SMS Reduces Neuronal Activity in Anesthetized Animals The above results suggest a decrease in the cortical excitability of V1 neurons produced by SMS, but other explanations could be possible, such as an increase in the activity of inhibitory interneurons. To shed some light on the putative mechanisms behind the effect, we performed experiments in 2 anesthetized cats to directly study the effect of SMS on neuronal responses. We recorded extracellularly from 15 V1 cells in control conditions and under the influence of a magnet similar to the one used on the primates (see Materials and Methods). In all cases, the cell firing decreased after a variable time after.
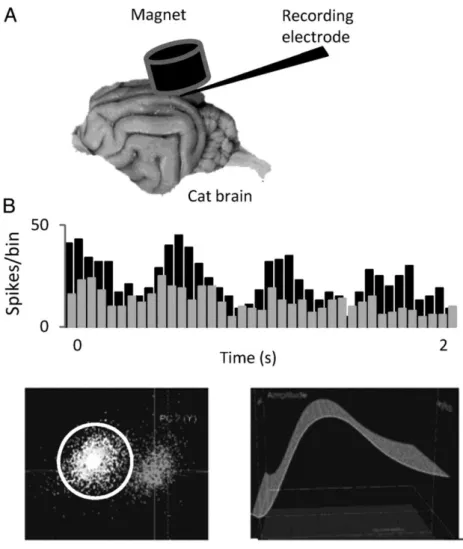
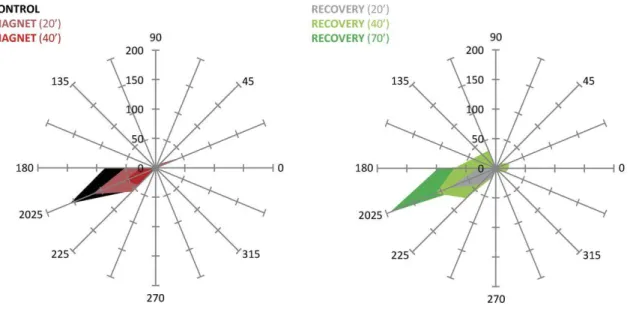
(10) exposition to the magnet (from 20 to 60 min). Figure 7 shows the schematic disposition of the elements of the experiment (A) and the response of a V1 cell to a drifting grating of optimal characteristics in the control and after 25 min under the influence of the magnetic field (B). There is a clear decrease in response of ∼30% in this particular cell under these circumstances. Despite the drop of responsiveness, the cell response continued to be modulated by the stimulus, responding to the different cycles of the grating but with less intensity. The quality and stability of the recording is shown in the 2 insets; to the left, the cell cluster separated from the noise is shown and to the right the waveform all over the duration of the protocol is displayed. Clearly, neither the amplitude nor shape was affected by the presence of the magnetic field.. Figure 7. (A) Scheme representing the arrangement of the different elements during the experiment. (B) PSTHs showing the response of a V1 cell to a drifting grating of optimal orientation, temporal, and spatial frequency in the control (black) and after 25 min of SMS (gray). Bin size 50 ms. Insets below the PSTHs show the isolation of the spike (circle) in a cluster far from the noise (left) and the stability of the recording signal.. Once it was determined that neuronal firing was affected by SMS in a way compatible with a decrease in excitability, we reasoned that it was important to study the effect of SMS on the specific visual characteristics of V1 cells, such as the orientation preference, which has been related, at least in part, to GABAergic neuron activity. Figure 8 shows the response of a different cortical cell to a moving bar of different orientations, in 22.5° steps, in the control (left polar, black) and at several time intervals after the magnet was placed. It is also clear in this case that the effect is progressive. The visual response decreased ∼27% after 20 min (pink) and dropped by 70% after 40 min (red). Similarly, the recovery was also gradual, as illustrated in the right polar plot for the same cell. After 20 min of SMS (gray), the effect reaches the maximum, an 83% of decrease versus the control response. After this period, the cell started a recovery that was completed ∼70 min after the magnet was removed from the cortex (dark green)..
(11) Interestingly, at this time point, cell firing was even higher than during control condition. This sort of “rebound” activity was observed in 2 cells. On the other hand, this is a particularly interesting example because the cell presented a strong direction and orientation selectivity in the control condition, and both properties remained stable during the whole process. In fact, the specificity of the response remained unaltered in the vast majority of the cells (12/15). Three cells showed more complex behaviors. One became more broadly oriented, and 2 increased the response to the nonoptimal direction. Spontaneous activity was also reduced during SMS, as is shown in Figure 9.. Figure 8. Polar plots representing the response of a V1 cell to a moving bar of different orientations in different experimental conditions. The plot on the left shows the control response (black) and the response obtained 20 (pink) and 40 (red) min after the magnet was placed on V1. The plot on the right shows the progression of the recovery at 20 (gray), 40 (light green), and 70 (dark green) min after the magnet was retired.. Figure 9. Spontaneous (dashed line) and visually evoked (continuous line) activity in different experimental conditions for one cortical cell. Both visual and spontaneous activities were modulated by the magnet in a similar way..
(12) The time to maximal effect was variable, with some cells peaking at 20 min while others required a minimum of 30 to show some alteration. On average, visual responses to optimal stimuli were reduced by 63% ± 21 (P < 0.01 paired sample t-test) after 40 min and spontaneous activity by 48 ± 26% (P < 0.01 paired sample t-test). There were no significant differences between the spontaneous and visual responses (P = 0.19 t-test). Discussion In this study, we report complementary data obtained from 2 different sources, behaving monkeys and anesthetized cats, which demonstrate that prolonged exposure to moderate-intensity SMFs have a large impact on neuronal activity and is able to create a reversible cortical scotoma due to the reduction of cellular responses. This was a long-lasting effect which, in some cases, had a recovery period longer than 1 h. To our knowledge, this work is the first to study the effect of local SMF on sensory perception. In addition to the physiological utility that the terrestrial geomagnetic field (30–70 µT) represents for some animals in terms of spatial orientation and navigation, the effect of much stronger magnetic fields on animal physiology has been an area of interest since the 19th century, starting with the pioneer experiments conducted by d'Arsonval (1896), who described the effect of introducing the head in a timevarying magnetic field. Furthermore, interest has grown since magnetic resonance imaging has become a normal procedure in clinical practice. The 2 main fields under study have been the nervous and cardiovascular systems and, in both cases, the results regarding direct effects of magnetic fields on human physiology are somewhat confusing (for a review, see Saunders 2005). In the nervous system, several studies (Gaffey and Tenforde 1983; Hong et al. 1986; Hong 1987) have failed to show any effect of fields as high as 1.5 T on action potential conduction velocity. In fact, the necessary intensity for varying the conduction velocity was estimated to be 24 T (Wikswo and Barach 1980). However, other groups have found that magnetic fields of only 0.12 T can produce a decrease in the evoked potential recorded from V1 following thalamic electrical stimulation (Rosen and Lubowsky 1987, 1990) or can reduce the release of Ach in the neuromuscular junction (Rosen 1992). Interestingly, these studies have used a nonfocal magnetic field similar to the one used in MRI equipment. The main effect that we report in our study after SMS (decrease of cortical excitability in the visual cortex) has also been detected in other brain areas. Recently (Oliviero et al. 2011; Silbert et al. 2013), it has been demonstrated that SMS over the motor cortex (using a magnet with the same characteristics as ours) reduced the evoked motor potential by 25% and lasted up to 6 min but did not have a behavioral effect. In our experiments, the results seem to be stronger, affecting the psychophysical performance of the animal, most likely because we used longer exposition times (10 min in previous work and up to 1 h in our case). An important reason for performing the study in nonhuman primates was to detect possible side effects due to longer exposure times in one session but also after several days of magnetic stimulation, as previously demonstrated in rodents (Amara, Douki et al. 2009; Amara, Garrel et al. 2009). No evidence of side effects was detected, although it is important to note the long time necessary for full recovery. We deliberately used the same size magnet in the 2 types of experiments in an effort to achieve maximum impact. However, we were aware of the relative difference in the size of the primary visual cortex and the distance between the magnet and nerve tissue, which is clearly different in both situations. These differences could have made the effect observed in the cat stronger than that in the monkey, but we also have to bear in mind that the position of the magnet in cat was not perfectly centered above the electrode nor was it completely tangential to the skull because of the presence of the electrode. Hence, we feel confident that the intensity of the magnetic field on cerebral cortex was comparable in both experiments. In a related issue, we recently measured (Rivadulla et al. 2013) the decay in the intensity of the magnetic field with the distance from the source. At the surface of the magnet, the value of the magnetic field is 0.5 T, but it decays quickly. At a distance similar to that from the magnet to the cortex, what we call the working distance and calculate to be ∼1.5 cm, the intensity is 0.2 T. Obviously, the working distance will increase in human studies due to the different thickness of the bone, skin, and so forth. Based on the distance from the magnet core, the observed results can be considered from a dual perspective. First, it seems that in close proximity to the magnet, the cells dramatically reduce their firing, and, as a result, an artificial scotoma is generated. This could be due to a decrease in excitation or to an increase in inhibition. Although our experimental approach does not allow us to determine which possibility is occurring, the cat data suggest a nonspecific withdrawal of excitation that results in a drop in gain, leaving the specific properties of neurons (e.g., orientation selectivity) largely unchanged; however, the precise mechanisms remain to be elucidated. Second, this scotoma must have consequences in the organization of cortical circuitry, affecting the RF of neurons surrounding it (Gilbert and Wiesel 1992; Pettet and Gilbert 1992). Furthermore, the effect of the magnet decreases with distance, so there is a.
(13) “shadowed” area where the influence is not as high as in the center, and other factors, such as the sensitivity of the cells to the magnetic field (Nitsche et al. 2005: Di Lazzaro et al. 2012; Di Lazzaro and Ziemann 2013), could change visual properties in ways much more complex than simply inducing an increase or decrease in the response. These complex interactions inside the circuitry could be behind the “rebound effect” observed in some cells (see Fig. 8 for instance), where the removal of magnet leads to a supraoptimal response post recovery perhaps unmasking an excitatory drive and/or the engagement of disinhibitory processes. The precise mechanisms implicated are beyond the scope of this manuscript and will be the objective of future experiments. Several mechanisms have been proposed to explain the long-lasting SMF effects described in living cells, but none of them is totally convincing. It has been suggested that SMF could change ionic distribution across the membranes, which would affect the membrane potential and hence the threshold for firing, a mechanism that does not seems to be compatible with the long period necessary to observe the effect. Alternatively, SMF could modify axonal conduction velocity, even when, theoretically, the SMF intensity necessary to alter axonal conduction would be 24 T (Wikswo and Barach 1980). Perhaps the most plausible explanation is the one that invokes changes in calcium permeability (Rosen and Lubowsky 1990; Gangitano et al. 2002; Rosen 2003; Tenuzzo et al. 2006; Rosen and Chastney 2009; Wang et al. 2010). The hypothesis is that SMF would cause reorientation of membrane phospholipids, which would cause a deformation of ion channels embedded in the membrane and therefore altering the ionic flux. In this scenario, calcium channels would be responsible for the main part of the effect. Other possible influences of long-term exposure to SMF have been postulated, including effects on cellular growth and size alterations of the cell cytoskeleton (Rosen and Chastney 2009). In our hands, recovery was obtained up to 90 min after the SMS. These long periods would be compatible with a calcium-related mechanism, because calcium is a very important intracellular mediator that regulates a plethora of physiological mechanisms such as neurotransmitter release, ion channel permeability and enzyme activity, modulating long-term synaptic processes such as long-term potentiation or long-term depression. In contrast, spine growth (Kapitein et al. 2011) would induce more long-term (or even permanent) effects that cannot be detected in this study but would be worth investigating in the future. In summary, we report that SMFs can induce strong and reversible suppressive effects on neuronal activity at localized areas of the cerebral cortex, with the intensity of the effect related to the length of exposure. SMS could be a valuable tool in research studies of cortical function, and its clinical use in the future may also be possible because SMS decreases cortical excitability, which is of interest in several pathological conditions such as epilepsy; this possibility is further supported by data obtained in animal models (McLean et al. 2003, 2008). It may also be useful to consider our findings when developing the safety protocols for high-intensity field fMRI. Moreover, the fMRI magnetic field has to be considered to be a possible source of influence in the recorded signal. Supplementary Material Supplementary material can be found at http://www.cercor.oxfordjournals.org/ online. Funding This work was supported by the Ministerio de Ciencia e Innovación (Spain), BFU2013-45343-P. Notes We thank NEUREK SL for donating the magnet and sham magnet necessary for the experiments. Conflict of Interest: None declared.. References Amara S, Douki T, Gare C, Favier A, Sakly M, Rhouma KB, Abdelmelek H. Effects of static magnetic field exposure on antioxidative enzymes activity and DNA in rat brain. Gen Physiol Biophys 2009;28:260-265. Amara S, Garrel C, Favier A, Rhouma KB, Sakly M, Abdelmelek H. Effect of static magnetic field and/or cadmium in the antioxidant enzymes activity in rat heart and skeletal muscle. Gen Physiol Biophys 2009;28:414-419. Arrubla J, Neuner I, Hahn D, Boers F, Shah NJ. Recording visual evoked potentials and auditory evoked P300 at 9.4T static magnetic field. PLoS One 2013;8:e62915..
(14) Beischer DE, Knepton JC. Pensacola (FL): Naval Aerospace Medical Institute; 1966. The electroencephalogram of the squirrel monkey (Saimiri sciureus) in a very high magnetic field. NAMI Rep. 972. Chakeres DW, de Vocht F. Static magnetic field effects on human subjects related to magnetic resonance imaging systems. Prog Biophys Mol Biol 2005;87:255-265. Chakeres DW, Kangarlu A, Boudoulas H, Young DC. Effect of static magnetic field exposure of up to 8 Tesla on sequential human vital sign measurements. J Magn Reson Imaging 2003;18:346-352. Coots A, Shi RY, Rosen AD. Effect of a 0.5-T static magnetic field on conduction in guinea pig spinal cord. J Neurol Sci 2004;222:55-57. d'Arsonval JA. Dispositifs pour la mésure des courants alternatifs de toutes fréquences. C R Soc Biol (Paris) 1896;2:450-451. de Vocht F, van Drooge H, Engels H, Kromhout H. Exposure, health complaints and cognitive performance among employees of an MRI scanners manufacturing department. J Magn Reson Imaging 2006;23:197-204. Di Lazzaro V, Manganelli F, Dileone M, Notturno F, Esposito M, Capasso M, Dubbioso R, Pace M, Ranieri F, Minicuci G, et al. The effects of prolonged cathodal direct current stimulation on the excitatory and inhibitory circuits of the ipsilateral and contralateral motor cortex. J Neural Transm 2012;119:1499-1506. Di Lazzaro V, Ziemann U. The contribution of transcranial magnetic stimulation in the functional evaluation of microcircuits in human motor cortex. Front Neural Circuits 2013. doi:10.3389/fncir.2013.00018. Gaffey CT, Tenforde TS. Bioelectric properties of frog sciatic-nerves during exposure to stationary magnetic-fields. Radiat Environ Biophys 1983;22:61-73. Gangitano M, Valero-Cabre A, Tormos JM, Mottaghy FM, Romero JR, Pascual-Leone A. Modulation of input-output curves by low and high frequency repetitive transcranial magnetic stimulation of the motor cortex. Clin Neurophysiol 2002;113:1249-1257. Gilbert CD, Wiesel TN. Receptive-field dynamics in adult primary visual-cortex. Nature 1992;356:150152. Hong CZ. Static magnetic-field influence on human nerve function. Arch Phys Med Rehabil 1987;68:162-164. Hong CZ, Harmon D, Yu J. Static magnetic-field influence on rat tail nerve function. Arch Phys Med Rehabil 1986;67:746-749. Kangarlu A, Robitaille PML. Biological effects and health implications in magnetic resonance imaging. Concepts Magn Reson 2000;12:321-359. Kapitein LC, Yau KW, Gouveia SM, van der Zwan WA, Wulf PS, Keijzer N, Demmers J, Jaworski J, Akhmanova A, Hoogenraad CC. NMDA receptor activation suppresses microtubule growth and spine entry. J Neurosci 2011;31:8194-8209. Martin H, Lindauer M. Effect of earth's magnetic-field on gravity orientation in honey bee (Apis mellifica). J Comp Physiol 1977;122:145-187. McLean MJ, Engström S, Holcomb RR, Sanchez D. A static magnetic field modulates severity of audiogenic seizures and anticonvulsant effects of phenytoin in DBA/2 mice. Epilepsy Res 2003;55:105-116. McLean MJ, Engström S, Qinkun Z, Spankovich C, Polley DB. Effects of a static magnetic field on audiogenic seizures in black Swiss mice. Epilepsy Res 2008;80:119-131. Nitsche MA, Seeber A, Frommann K, Klein CC, Rochford C, Nitsche MS, Liebetanz D, Lang N, Antal A, Paulus W, et al. Modulating parameters of excitability during and after transcranial direct current stimulation of the human motor cortex. J Physiol 2005;568:291-303. Nolte CM, Pittman DW, Kalevitch B, Henderson R, Smith JC. Magnetic field conditioned taste aversion in rats. Physiol Behav 1998;63:683-688. Oliviero A, Mordillo-Mateos L, Arias P, Panyavin I, Foffani G, Aguilar J. Transcranial static magnetic field stimulation of the human motor cortex. J Physiol 2011;589:4949-4958. Pettet MW, Gilbert CD. Dynamic changes in receptive-field size in cat primary visual-cortex. Proc Natl Acad Sci USA 1992;89:8366-8370. Rivadulla C, Foffani G, Oliviero A. Magnetic field strength and reproducibility of neodymium magnets useful for transcranial static magnetic field stimulation of the human cortex. Neuromodulation 2013. doi:10.1111/ner.12125. Rosen AD. Magnetic-field influence on acetylcholine-release at the neuromuscular-junction. Am J Physiol 1992;262:C1418-C1422. Rosen AD. Mechanism of action of moderate-intensity static magnetic fields on biological systems. Cell Biochem Biophys 2003;29:163-73..
(15) Rosen AD, Chastney EE. Effect of long term exposure to 05T static magnetic fields on growth and size of GH3 cells. Bioelectromagnetics 2009;30:114-119. Rosen AD, Lubowsky J. Magnetic-field influence on central-nervous-system function. Exp Neurol 1987;95:679-687. Rosen AD, Lubowsky J. Modification of spontaneous unit discharge in the lateral geniculate-body by a magnetic-field. Exp Neurol 1990;108:261-265. Saunders R. Static magnetic fields: animal studies. Prog Biophys Mol Biol 2005;87:225-239. Schenck JF. Safety of strong, static magnetic fields. J Magn Reson Imaging 2000;12:2-19. Schlamann M, Yoon MS, Maderwald S, Pietrzyk T, Bitz AK, Gerwig M, Forsting M, Ladd SC, Ladd ME, Kastrup O. Short term effects of magnetic resonance imaging on excitability of the motor cortex at 15 T and 7 T. Acad Radiol 2010;17:277-281. Semm P, Schneider T, Vollrath L. Effects of an earth-strength magnetic-field on electrical-activity of pineal cells. Nature 1980;288:607-608. Silbert BI, Pevcic DD, Patterson HI, Windnagel KA, Thickbroom GW. Inverse correlation between resting motor threshold and corticomotor excitability after static magnetic stimulation of human motor cortex. Brain Stimul 2013;6:817-820. Snyder DJ, Jahng JW, Smith JC, Houpt TA. c-Fos induction in visceral and vestibular nuclei of the rat brain stem by a 94 T magnetic field. Neuroreport 2000;11:2681-2685. Tenuzzo B, Chionna A, Panzarini E, Lanubile R, Tarantino P, Di Jeso B, Dwikat M, Dini L. Biological effects of 6 mT static magnetic fields: a comparative study in different cell types. Bioelectromagnetics 2006;27:560-577. Wang ZY, Che PL, Du JA, Ha B, Yarema KJ. Static magnetic field exposure reproduces cellular effects of the Parkinson's disease drug candidate ZM241385. PLoS One 2010;5:e13883. doi:10.1371/journal.pone.0013883. Weiss J, Herrick RC, Taber KH, Contant C, Plishker GA. Bioeffects of high magnetic-fields—a study using a simple animal-model. Magn Reson Imaging 1992;10:689-694. Wikswo JP, Barach JP. An estimate of the steady magnetic-field strength required to influence nerveconduction. IEEE Trans Biomed Eng 1980;27:722-723..
(16)
Figure
+4
Documento similar
In the preparation of this report, the Venice Commission has relied on the comments of its rapporteurs; its recently adopted Report on Respect for Democracy, Human Rights and the Rule
The draft amendments do not operate any more a distinction between different states of emergency; they repeal articles 120, 121and 122 and make it possible for the President to
The main goal of this thesis is to contribute to the knowledge in planetary science through the study of the upper atmosphere of giant planets undergoing hydrody- namic escape. We
Man would not act according to certain values because they are good, but because of other reasons (because they please him, make him happy, etc.). Technically, these moral
In the processing of subtitled content, the visual system has to decode two different sets of information, on the scene (understood as what happens in the visual narrative of the
In the previous sections we have shown how astronomical alignments and solar hierophanies – with a common interest in the solstices − were substantiated in the
Díaz Soto has raised the point about banning religious garb in the ―public space.‖ He states, ―for example, in most Spanish public Universities, there is a Catholic chapel
In addition to simulation, Petri nets can be analyzed [Mur89], for example regarding reachability (whether the net can reach a certain marking), boundedness (whether the number
