Unveiling the architecture of the Fornax galaxy cluster with its different stellar systems
171
0
0
Texto completo
(2)
(3) Dissertation in Astronomy submitted to the Combined Faculties of the Natural Sciences and Mathematics of the Ruperto-Carola-University of Heidelberg, Germany and Faculty of Physics of the Pontifical Catholic University of Chile for the degree of Doctor of Natural Science. Put forward by Yasna Ordenes Briceño born in Coquimbo, Chile. Oral examination: 25 October 2018. iii.
(4)
(5) UNVEILING THE ARCHITECTURE OF THE FORNAX GALAXY CLUSTER WITH ITS DIFFERENT STELLAR SYSTEMS Yasna Ordenes Briceño. Referees: Prof. Dr. Thomas Puzia Prof. Dr. Eva Grebel.
(6)
(7) A mi pareja, amigo, partner de la vida, Ariel Tirado. A mi familia Ordenes-Briceño, Hugo, Jacqueline, Ochin y Yordan. A mis abuelos, Rosa y Juan. A los que ya partieron, Periquito y Julita..
(8)
(9) ABSTRACT. A crucial question in astronomy is how galaxies assemble their mass over cosmic time. In this thesis, we focus on the Fornax Galaxy Cluster as a laboratory to study galaxy evolution processes, as it is the second closest galaxy cluster which allows a detailed view of its cluster members. It hosts a variety of stellar systems from giant galaxies to dwarf galaxies and more compact and dense ones such as globular clusters and ultra-compact dwarf galaxies which we call compact stellar systems (CSSs). We use data from the Next Generation Fornax Survey (NGFS) with optical imaging obtained with the Dark Energy Camera (DECam) mounted at Blanco/CTIO and near-infrared data obtained with VIRCam at VISTA/ESO. This data provides deep and homogeneous photometry in u 0 g 0 i 0 JKs spatially covering the Fornax cluster out to half its virial radius. We investigate the properties of nucleated dwarf galaxies and compact stellar systems in the Fornax core region (r < 0.25rvir ). Furthermore, we study the dwarf galaxy population with MB > −16 in the outer region of Fornax at radii of 0.25 < r/rvir < 0.5. The main results of this thesis are as follows: (1) We have discovered 271 previously undetected dwarf galaxies in the outer Fornax cluster region, increasing the total Fornax dwarf galaxy population from NGFS and other catalogs to a total number of 643 dwarfs with 181 being nucleated. (2) The study of 61 nuclear star clusters in dwarf galaxies showed that the nuclei have a bimodal mass distribution and that the scaling relation between nucleus mass and host galaxy mass holds for dwarf galaxies but at a less steep slope compared to brighter galaxies. The mass ratio Mnuc /Mgal shows a clear anticorrelation with Mgal for the lowest masses, reaching up to 10%. (3) A total of 1666 CSS candidates have been studied in the core region of Fornax, being the most clean photometrically selected sample using support vector machine techniques. Age, metallicity and mass were estimated for each CSS. A division of the properties in subgroups showed that the metal poor and old CSSs are sparsely distributed, intermediate metallicity and young CSSs are preferentially located along the East-West direction of Fornax centered in NGC 1399 and the most metal rich CSSs are concentrated in the vicinity of NGC 1399 and around the brightest galaxies. These different distributions for the metallicity and age subgroups allow us to constrain the mass assembly history of the Fornax Cluster. (4) Besides the Fornax cluster, we also discover five very diverse dwarf galaxies in another region of the sky, i.e. Hickson Compact Group 90 (HCG 90). Two of these dwarfs are a dwarf galaxy pair and one is a nucleated dwarf galaxy. According to their luminosity and structural parameters, they are similar to the dwarf galaxies we found in Fornax.. ix.
(10) Z U S A M M E N FA S S U N G. Eine entscheidende Frage in der Astronomie ist wie Galaxien ihre Masse im Laufe der Entwicklung des Universums zusammenzustellen. In dieser Arbeit konzentrieren wir uns auf den Fornax-Galaxienhaufen, ein ideales Labor um Galaxienentwicklungsprozesse zu untersuchen. Da Fornax der am zweitnächsten gelegene Galaxienhaufen ist, ist eine detaillierte Untersuchung seiner Galaxienpopulation möglich. Er beherbergt eine Vielzahl von Sternsystemen, von massereichen Galaxien bis zu Zwerggalaxien und kompakteren und dichteren Sternsystemen wie Kugelsternhaufenhaufen und ultrakompakten Zwerggalaxien. Wir benutzen Daten vom Next Generation Fornax Survey (NGFS), bestehend aus Aufnahmen mit der Dark Energy Camera (DECam) des 4-Meter Cerro Tololo Blanco Teleskops im Optischen und Daten des ESO/VISTA Teleskops mit VIRCAM im Nahen Infrarot. Diese Daten liefern homogene und tiefe Photometrie im gesamten Survey und decken einen großen Wellenlängenbereich ab (u 0 g 0 i 0 JKs ). Wir untersuchen die Eigenschaften von Zwerggalaxien mit Nukleus und kompakte Sternsysteme im Zentralbereich des Fornax-Haufens (r < 0.25rvir ). Außerdem untersuchen wir die Zwerggalaxienpopulation (MB > −16) in den äußeren Bereichen 0.25 < r/rvir < 0.5 des Fornax-Haufens. Die wichtigste Ergebnisse dieser Arbeit sind wie folgt: (1) Wir haben 271 zuvor nichtdetektierte Zwerggalaxien in den äußeren Bereichen des Fornax-Haufens katalogisiert, resultierend in insgesamt 643 Zwerggalaxien, wobei 181 davon einen Nukleus aufweisen. (2) Die Untersuchung von 61 nuclear star clusters in Zwerggalaxien zeigen eine bimodale Massenverteilung. Wir finden dass die Skalenrelationen zwischen Nukleus Masse und der entsprechenden Host-Galaxie für Zerggalaxien gelten, jedoch mit geringerer Steigung und dass das Massenverhältnis Mnuc /Mgal eine klare Anti-Korrelation mit Mgal für die niedrigsten Massen bis 10% aufweist. (3) 1666 Kandidaten für kompakte Sternsysteme wurden im Zentralbereich des Fornax-Haufens untersucht. Dies stellt das beste photometrisch selektierte Sample mit Hilfe von vector machine techniques dar. Alter, Metallizität und Masse wurden für jedes kompakte Sternsystem bestimmt. Eine Unterteilung der Eigenschaften in Untergruppen zeigte dass die metallarmen und alten kompakten Sternsysteme diffus verteilt sind, Objekte mit mittlerer Metallizität und jungem Alter jedoch vorzugsweise entlang der Ost-WestRichtung von Fornax zentriert um NGC 1399 anzutreffen sind und das die metallreichsten kompakten Sternsysteme in der Nähe von NGC 1399 und den hellsten Galaxien konzentriert sind. Diese unterschiedlichen Verteilungen für die Alters- und Metallizitätsunterteilungen geben einen Hinweis über die Entwicklungsgeschichte des Fornax-Haufens. (4) Neben dem Fornax Galaxienhaufen präsentieren wir fünf sehr unterschiedliche Zwerggalaxien in einem anderen Bereich des Himmels, in der Hickson Compact-Group 90 (HCG 90). Zwei der Zwerge sind ein Zwerggalaxienpaar und eine ist eine Zwerggalaxie mit Nukleus. Entsprechend ihrer Leuchtkraft und strukturellen Parametern sind diese mit den Zwerggalaxien in Fornax vergleichbar.. x.
(11) P U B L I C AT I O N S. Part of the work shown in my thesis have appeared previously in the following publications: The Next Generation Fornax Survey (NGFS): IV. Mass and Age Bimodality of Nuclear Clusters in the Fornax Core Region. Authors: Yasna OrdenesBriceño, Thomas Puzia, Paul Eigenthaler et al. 2018, ApJ, 860, 4. The Next Generation Fornax Survey (NGFS): III. Revealing the Spatial Substructure of the Dwarf Galaxy Population inside half of Fornax’s Virial Radius. Authors: Yasna Ordenes-Briceño, Paul Eigenthaler, Matthew Taylor, Thomas Puzia et al. 2018, ApJ, 859, 52. The Next Generation Fornax Survey (NGFS): II. The Central Dwarf Galaxy Population. Authors: Paul Eigenthaler, Matthew Taylor, Thomas Puzia, Yasna Ordenes-Briceño et al. 2018, ApJ, 855,142. Faint Dwarf Galaxies in Hickson Compact Group 90. Authors: Yasna OrdenesBriceño, Matthew Taylor, Thomas Puzia et al. 2016, MNRAS, 463, 1284.. xi.
(12)
(13) The passioned, enthusiastic, curious and self motivated people, science and the world need more of us. A lxs apasionadxs, entusiastxs, curiosxs y auto motivadxs, la ciencia y el mundo necesitan más como nosotrxs. — Yasna Ordenes-Briceño. ACKNOWLEDGMENTS. This is the end of a stage, of a lot of growth both as a person and intellectually. The hours of study and research have been totally worth it. I have enjoyed this cycle a lot and with mixed feelings now I must close it. During my time as a PhD student I have met many beautiful people, in addition to the beautiful people who were already in my life, who have contributed in one way or another to reach this point where I am today. I thank my supervisor Thomas Puzia, who has been always there, thanks for all the support, trust and learning given. To my supervisor Eva Grebel, always attentive and willing to help, her scientific comments have been very valuable. It has been a pleasure to have both of you as supervisors and guides of my PhD thesis. To the research groups of the IA in Santiago and ARI in Heidelberg, the meetings and scientific discussions were very fruitful to improve or obtain new ideas for the science that one is doing and also learn to communicate it, specially to Roberto, Paul E., Karla, Matt, Faezeh, Zdenek and Michael. To the administrators of each institute for their willingness to support us as students, especially Mariela, Carmen Gloria and Cynthia. To the IA’s cleaning staff, Sonia and Maria, for the conversations and good vibes. How not to thank my couple, Ariel Tirado, for all the support given in this process and always enhancing our skills and looking together for new challenges as a couple and as individuals. To my family Ordenes-Briceño, my mom Jacqueline, my dad Hugo and my brothers Ochin and Yordan, they are always there in everything, supporting me in every madness/challenge that I undertake, thanks. I have a large family supporting me on the maternal (BriceñoGomez) and paternal (Ordenes-Campos) side, always I have felt your unconditional support, a special thanks to my grandparents Rosa, Juan and Julia, Sergio. To my friends who are scattered in various places of Chile and the world, I can only mention some here, Cristi, Paito, Paul L., Mary, Karla, Cris. To my adoptive grandmothers, Rosita and Maria Ines from the nursing home I visit. To all the women in science who have overcome thousands of barriers to be where they are today, in a science that has been preferentially for men. Things are changing now, in some places more quickly than in others. The path that the new generations faces is much more kind than a few years ago, however we are still far to reach equity. Women in science who managed to surpass social barriers and followed their passion, my admiration to you. From the age of 13 that I was dreaming about studying the Universe, with that wonderful sky that can be seen from the region of Coquimbo and here I am with my goal of being Astrophysicist fulfilled. A lot remains to be done, to explore, to find or be found by new challenges and to continue growing as a person and as scientist. To conclude I want to emphasize my immense gratitude to every person who have been part of this path.. xiii.
(14) "Me estremecieron mujeres que la historia escribió entre laureles y otras desconocidas gigantes, que no hay libro que las aguante. — Mujeres, Silvio Rodriguez. AGRADECIMIENTOS. Esta es la finalización de una etapa, de mucho crecimiento tanto como persona como intelectualmente. Las horas de estudio y de investigación han valido totalmente la pena. He disfrutado mucho de este ciclo y con sentimientos encontrados ahora debo cerrarlo. Durante mi etapa de estudiante de doctorado he conocido muchas personas lindas, además de las personas lindas que ya estaban en mi vida, que han aportado de una u otra forma para llegar a este punto en el que estoy hoy. Agradezco a mi supervisor Thomas Puzia, que ha estado ahi siempre, gracias por todo el apoyo, confianza y el aprendizaje entregado. A mi supervisora Eva Grebel, siempre atenta y dispuesta a ayudar, sus comentarios cientificos han sido muy valiosos. Ha sido un placer tenerlos a los dos de supervisores y guias de mi tesis de doctorado. A los grupos de investigación del IA en Santiago y ARI en Heidelberg, las reuniones y discusiones científicas fueron muy fructiferas para mejorar u obtener nuevas ideas para la ciencia que uno esta haciendo y también aprender a comunicarlas, especialmente a Roberto, Paul E., Karla, Matt, Faezeh, Zdenek and Michael. A los administrativos de cada instituto por su disposición a ayudarnos a nosotros como estudiantes, en especial a Mariela, Carmen Gloria y Cynthia. Al personal del aseo del IA, Sonia y Maria, por las conversaciones y buenas vibras. Como no agradecer a mi pareja, Ariel Tirado, por todo el apoyo entregado en este proceso y siempre potenciando nuestras habilidades y buscando nuevos desafíos como pareja y como individuos. A mi familia Ordenes-Briceño, mi mamá Jacqueline, mi papá Hugo y mis hermanos Ochin y Yordan, siempre estan ahi en todas, apoyandome en cada locura/desafio que me propongo, muchas gracias. Tengo una gran familia respaldandome por parte materna (Briceño-Gomez) y paterno (Ordenes-Campos), siempre he sentido su apoyo incondicional, un agradecimiento especial a mis abuelos Rosa, Juan y Julita, Periquito. A mis amigos que estan esparcidos por varios lugares de Chile y del mundo, solo podre mencionar a algunos, Cristi, Paito, Paul L., Mary, Karla, Cris. A mis abuelas adoptivas, Rosita y Maria Ines del hogar de adultos mayores que visito. A todas las mujeres en ciencia que han superado miles de barreras para estar donde estan hoy, en una ciencia que ha sido preferencialmente para hombres. Las cosas estan cambiando ahora, en algunos lugares más rápido que en otros, por eso el camino que enfrentamos las nuevas generaciones es mucho más amable que hace unos años atrás, pero aún falta bastante para llegar a la equidad. A las mujeres en ciencia que lograron sobrepasar las barreras sociales y seguir su pasión, mi admiración a ustedes. Desde los 13 años que soñaba con estudiar el Universo, con ese maravilloso cielo que se puede ver desde la región de Coquimbo y aqui estoy con mi meta de ser Astrofísica cumplida. Aún queda mucho por hacer, explorar, encontrar o ser encontrado por nuevos desafios y seguir creciendo como persona y como científica. Solo recalcar mi gratitud inmensa a cada una de las personas que han sido parte de este lindo camino.. xiv.
(15) CONTENTS List of Figures xvii 1 introduction 1 1.1 Cluster and group of galaxies 1 1.1.1 Morphological classification of galaxy clusters 2 1.1.2 Morphology-density relation 2 1.1.3 Color-magnitude relation 3 1.1.4 Star formation rate - local projected density relation 3 1.1.5 Butcher-Oemler effect 4 1.1.6 Color distribution of galaxies in different environments 1.1.7 Quenching mechanisms 5 1.1.8 The Fornax Galaxy Cluster 5 1.1.9 Hickson Compact Group 90 7 1.2 Dwarf galaxy population 8 1.2.1 Morphological types 9 1.2.2 Surface Brightness Profiles 9 1.2.3 Stellar populations 10 1.2.4 Scaling relations 11 1.3 Nuclear star clusters 12 1.3.1 Stellar populations 13 1.3.2 Coexistence with Massive Black Holes 14 1.3.3 Scaling relations 15 1.3.4 Formation scenarios 15 1.4 Compact Stellar Systems 16 1.4.1 Globular clusters 16 1.4.2 Ultra compact dwarf galaxies 23 1.4.3 Compact Ellipticals 24 1.5 Hierachical assembly scenario 25 2 science data and its processing: the next generation fornax survey 27 2.1 Observations 27 2.2 Image processing 27 2.3 Photometry 29 3 dwarf galaxy population inside half the virial radius of fornax 31 3.1 Context 31 3.2 Analysis 31 3.2.1 Detection of LSB dwarf galaxy candidates 31 3.2.2 Structural parameters of the dwarf candidates 32 3.3 Results 32 3.3.1 Size-Luminosity Relation 34 3.3.2 Spatial Distribution 35 3.4 Discussion 37 3.5 Summary 42 4 nuclear star clusters in the fornax core region 43 4.1 Context 43 4.2 Analysis 43 4.2.1 Sample selection 43 4.2.2 Spatial distribution 44 4.2.3 Nucleation fraction 44. 4. xv.
(16) xvi. contents. 5. 6. 7 a. 4.2.4 Morphological decomposition of nucleus and spheroid 46 4.2.5 Photometry 47 4.3 Results 48 4.3.1 Color-magnitude and color-color diagrams 48 4.3.2 Stellar mass estimates 51 4.3.3 Stellar population properties 55 4.3.4 Differences between nuclei and galaxy spheroids 57 4.4 Discussion 59 4.4.1 Formation mechanisms 59 4.4.2 Scaling relations 59 4.4.3 Comparison with theoretical predictions 64 4.4.4 Correlation of the nucleation strength with the spatial distribution in Fornax 67 4.5 Summary 67 panchromatic view of the fornax compact stellar systems 71 5.1 Context 71 5.2 Analysis 71 5.2.1 Bright galaxy subtraction 71 5.2.2 Photometry 72 5.2.3 Selecting Compact Stellar System with Machine-Learning Methods 74 5.3 Results 76 5.3.1 Color-magnitude diagrams 76 5.3.2 Estimation of the stellar population properties for the CSS candidates. 76 5.3.3 CSS color distribution as a function of cluster-centric distance 84 5.3.4 CSS mass distribution as a function of cluster-centric distance 84 5.3.5 Age and metallicity trends 85 5.4 Discussion 89 5.4.1 Spatial distributions 89 5.4.2 Comparison with other CSSs 90 5.5 Summary 90 dwarf galaxies in a group environment: the case of hickson compact group 90 97 6.1 Context 97 6.2 Observations and Data Reduction 97 6.3 Analysis 98 6.4 Results 105 6.5 Discussion 107 6.6 Summary 109 summary and outlook 111 7.1 Outlook 112 appendix 115. bibliography. 137.
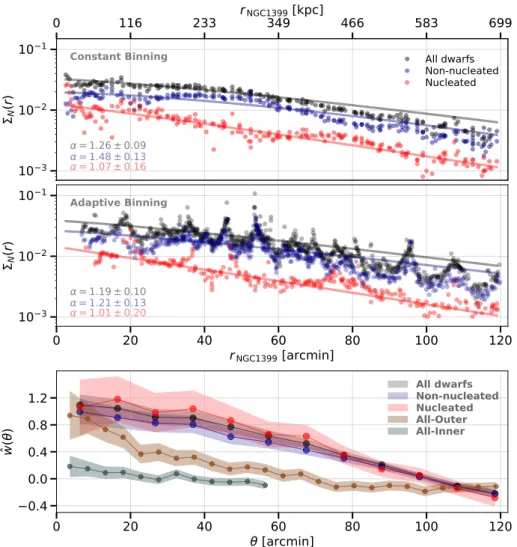
(17) LIST OF FIGURES. Figure 1. Figure 2 Figure 3 Figure 4 Figure 5. Figure 6 Figure 7 Figure 8 Figure 9 Figure 10 Figure 11 Figure 12 Figure 13 Figure 14 Figure 15 Figure 16. Figure 17 Figure 18 Figure 19 Figure 20 Figure 21 Figure 22. Chandra X-ray image of the Fornax galaxy cluster and Fornax partitionn into two subclusters, the main and SW subcluster. 7 Star formation histories obtained with synthetic CMD method for three dwarfs. 11 Effective radius versus stellar mass relation for NGFS galaxies and various other stellar systems. 13 Hertzsprung-Russell diagram for all stars in the GAIA DR2. 18 Luminosity-normalized number of GCs and mass-normalized numbers of GCs for different galaxy mass and environments. 21 Color distributions for the GC population of 100 ETGs in the Virgo cluster (Peng et al., 2006). 22 NGFS Survey footprint of the optical coverage in the Fornax cluster survey. 28 Composite RGB image for the central region of Fornax galaxy cluster. 30 Comparison of dwarfs in the RGB image and a singlefilter image. 33 Illustration of the spatial distribution of Fornax dwarf galaxy candidates. 34 Size-luminosity relation for dwarf and giant galaxies in Fornax and the nearby universe. 36 Surface number density distribution of the Fornax dwarf galaxies within half of its virial radius (∼ rvir /2). 38 The projected surface number density and clustering profiles for NGFS dwarf galaxy candidates. 40 2D density distribution showing dwarf clustering in the Φ − rNGC1399 space. 41 Spatial distribution of nucleated dwarfs and non-nucleated dwarfs in central region of the Fornax galaxy cluster 45 Postage stamp g 0 -band images for the 61 nucleated dwarfs, sorted by the g 0 -band luminosity of their spheroid component. 46 Nucleation fraction (fnuc ) of Fornax dwarfs as a function of g 0 -band galaxy luminosity. 47 Ilustration of the galaxy fitting for two dwarf galaxies in the three optical bands, u 0 g 0 i 0 . 49 Color-magnitude diagrams for the NGFS sample nuclei. 50 Color-color diagrams, (u 0 −g 0 )0 vs. (g 0 −i 0 )0 and (u 0 − i 0 )0 vs. (i 0 −Ks )0 . 52 Mass distribution for the NGFS nuclei, the radial-velocity confirmed CSSs in Fornax, and the dwarf spheroids. 53 (u 0−i)0 vs. (i 0−Ks )0 color-color diagram with SSP models from BC03 using the MILES stellar library and a Kroupa IMF. 54. xvii.
(18) Figure 23. Figure 24. Figure 25 Figure 26. Figure 27. Figure 28. Figure 29 Figure 30 Figure 31 Figure 32 Figure 33 Figure 34 Figure 35 Figure 36 Figure 37 Figure 38 Figure 39 Figure 40 Figure 41 Figure 42 Figure 43 Figure 44 Figure 45. xviii. Color differences between the nucleus and its host dwarf galaxy spheroid in ∆(u 0 −i 0 )0 , ∆(u 0 −g 0 )0 , and ∆(g 0 − i 0 )0 vs. g0,nucleus and vs. g0,spheroid 58 Nucleus vs. host galaxy stellar mass for different subsets of nucleated NGFS galaxies and other galaxies from the literature. 61 Scaling relations of the nucleus and galaxy masses. 65 Illustration of the central region of the Fornax galaxy cluster showing the spatial distribution of the nucleated dwarfs with mass ratio information. 66 Color-color diagrams for all sources with panchromatic photometry in the central regions of the Fornax galaxy cluster. 73 Color-color diagrams for the four filter combinations in which the best separation between different object types is recognized. 74 Four color-color diagrams illustrating the selected CSS candidates. 75 Color-magnitude diagrams for u 0 , g 0 , i 0 , J and Ks with two colors, (u 0 − Ks ) and (g 0 − i 0 ). 77 Model metallicity from BC03 and its dependence in color space 79 Color-color diagrams for 10 color-color combination with BC03 SSP models. 81 0 0 g i Ks diagram color coded with the different parameters for the CSS candidates 82 Metallicity distribution for the CSS candidates 83 Age and mass distributions for the CSS candidates 83 Color distributions for the inner NGC 1399 CSSs, outer NGC 1399 CSSs and intra-cluster CSSs. 86 Mass distribution for the inner NGC 1399 CSSs, outer NGC 1399 CSSs and intra cluster CSSs. 87 CSS mass distributions for three metallicity and age sub-groups. 88 CSS Spatial distribution in the central region of the Fornax cluster for three metallicity subgroups. 93 CSS Spatial distribution in the central region of the Fornax cluster for three subgroups in age. 94 0 0 0 0 0 0 u i Ks , u g Ks and g i Ks color-color diagrams for the CSSs candidates, comparison with Virgo CSSs. 95 Covered area with VLT/VIMOS in the region of HCG 90. U-band VLT/VIMOS images of the new dwarf candidates. 99 Surface brightness light profile fitting procedure for dwarf candidates, conducted in I- and U-bands. 103 Illustrations of the surface brightness profile fitting for the spheroid and central object of HCG90-DW4 in I and U-band. 104. 98.
(19) List of Tables. Figure 46. Size-luminosity relation and color-magnitude diagram, U0 vs (U−I)0 for the HCG 90 dwarf galaxies 106. L I S T O F TA B L E S. Table 1 Table 2 Table 3 Table 4 Table 5 Table 6. Nucleus and spheroid color-magnitude relations 50 Scaling relations 63 HCG 90 LSB dwarf candidate photometry and structural parameters. 101 Age, metallicity and mass (AMM) estimates for all of the HCG 90 LSB dwarf candidates 108 Dwarf galaxies in the Fornax Cluster 116 Nuclear star clusters parameters 134. xix.
(20)
(21) 1. INTRODUCTION. 1.1. cluster and group of galaxies. Stellar systems complete in themselves was the basis of our definition of galaxies given by Edwin Hubble in 1926, it was also the starting point for these nebulae to be recognized as extragalactic stellar systems (Hubble, 1926). By naked-eye only five of this "nebulae" are visible, our own Milky way (a part of it), Andromeda (M31), M33, the Large Magellanic Cloud (LMC) and the Small Magellanic Cloud (SMC). In the Southern skies by looking to the Milky Way we could see how it is a galaxy from inside, a nebula with conglomeration of stars, dust and gas. With the help of telescopes, astronomers could investigate further their properties and soon realize that our closest neighbors were just a tiny fraction of the vast population of galaxies in the universe and with an immense zoo of morphologies. A first attempt to classify them into type of galaxies according to their appearance was Hubble in his work Extragalactic Nebulae (Hubble, 1926). He divided the 400 nebulae in his catalogue from photographic plates into three main divisions, ellipticals, spirals and irregular galaxies. In his work "The realm of the nebulae" (Hubble, 1936), he describes the sequence of nebular types (now known as the Hubble tunning fork) and an intermediate stage nebulae was added between type E7 and Sa/Sab, it was designated as S0 or lenticular galaxy. At that time, it was believed that ellipticals evolve to become spiral nebulae, thus lenticular galaxies were a very important stage in all theories of nebular evolution, as consequence the name "early-type" galaxies was assigned to ellipticals and "late-type" galaxies to spirals. This evolutionary path is no longer valid, but nowadays we still use the term of early-type to refer to elliptical and/or lenticular galaxies (ETGs) and late-type to refer to spirals and/or irregular galaxies (LTGs). The current zoo of galaxy morphologies continues growing with the progress in technology and more sophisticated instruments. However, as a general picture for giant galaxies the one described by Hubble (1936) was quite complete. The real picture for galaxies of each family is much more complex in terms of surface brightness, kinematics, bulge-to-disk ratio, bar, gas fraction, among others. The detailed explanation is beyond the scope of this introduction, but a good review of the different properties between morphological type of galaxies can be found for instance in the book Extragalaxtic Astronomy and Cosmology (Schneider, 2015, chapter 3) and Galaxies in the Universe (Sparke, & Gallagher, 2007). Galaxies are not uniformly distributed in space, but prefer to gather together in groups and clusters of galaxies, forming overdense regions in the Universe. Groups and clusters of galaxies differ mainly in the number of bright galaxies they contain. A group of galaxies is normally defined as 4 to 5 massive galaxies (e.g. Hickson, 1982), our most nearby example is the group we are in, the Local Group (LG). With an extension of ∼1 Mpc, the LG has two massive spirals, the Milky Way and Andromeda, besides the spiral M33 and the two irregular galaxies LMC and SMC, in adittion to more than 100 dwarf galaxies (McConnachie, 2012). A cluster of galaxies can contain hundreds to thousands of galaxy members. The first catalog of galaxy clusters was done by Abell (1958), where he detected 1682 clusters in the Northern sky using the Palomar Observatory facil-. 1.
(22) 2. introduction. ities. The identification was done tracing overdensities of galaxies with the following criteria: galaxy members are no more than two magnitudes fainter than the third brightest member and do not have a projected distance from the center larger than the Abell radius rAbell = 3h−1 50 Mpc. The Southern counterpart catalog was published in the work by Abell et al. (1989), with a total number of 4076 clusters, which includes the galaxy clusters identified in the previous study in the Northern hemisphere. The Abell catalog divides the clusters into six richness classes, depending on the member numbers, richness 0 means N< 50, thus they were not considered in the final cluster catolog. A richness class 5 means that the cluster contains more than 300 luminous galaxies. Galaxy clusters are the most massive gravitationally bound systems in the universe with total masses in the range 1014 to 1015 M . Observing a galaxy cluster in different wavelengths shows that the optical apperance is only a small fraction of the total mass. X-ray observations show that the most massive visible component of clusters is the hot gas (T ∼ 3 × 10⁷ K) coming from the intracluster medium (ICM), in between the galaxies. A massive cluster defined in the optical with the Abell richness class 5, in X-ray would be an extended X-ray source from the hot gas as a result of a deep gravitational potential. The velocity dispersion of galaxy clusters correlates with the richness of clusters. For instance Becker et al. (2007) measured the mean velocity dispersion for 13823 clusters selected with SDSS in a redshift range 0.1 < z < 0.3 and found that σv increases from 202 ± 10 km/s for small groups and can be more than 854 ± 102 km/s for large clusters. 1.1.1. Morphological classification of galaxy clusters. The morphological classification of clusters is based on the distribution of galaxies inside the cluster. There are different classifications in the literature, but they coincide in three main types: regular, intermediate and irregulars distributions. For instance, Zwicky et al. (1961) classified regular clusters as compact and irregular as open and with or without strong central concentrations. Meanwhile, a classification by Rood, & Sastry (1971) indicates six subtypes, from irregular to regular, from a complete irregular distribution (I), to a more centrally concentrated distribution of galaxies, with two bright galaxies in the center (B) or a cD galaxy dominating the cluster center (cD). A cD galaxy is more massive than a regular elliptical galaxy, the most striking characteristic is its low surface brighteness extended stellar halo (Morgan, & Lesh, 1965; Matthews et al., 1964), they are located at the kinematical center of their cluster (Quintana, & Lawrie, 1982) and located in high density peaks, 2-3 times greater than peaks without a cD galaxy (Beers, & Geller, 1983). It is beleived that these massive ellipticals are the consequence of the evolutionary process of dense environments (Dressler, 1984).. 1.1.2. Morphology-density relation. With the study of 55 nearby galaxy clusters, Dressler (1980) showed that the increasing number of elliptical and S0 population is tightly related with the dependence of galaxy morphology and the environmental density, the so called morphology-density relation. As consequence of this relation, low density fields are dominated by spirals and high density fields by ellipticals and S0 galaxies. According to the work of Postman, & Geller (1984), this relation holds for galaxy groups which have a galaxy density larger than ' 5 Mpc−3 . For den-.
(23) 1.1 cluster and group of galaxies. sities below this limit the morpholgy fraction seems to be independent of the environment. Large surveys of galaxies with spectroscopic redshifts like the 2dF Galaxy Redshift Survey (2dFGRS, Colless et al., 2001) and the Sloan Digital Sky Survey (SDSS, York et al., 2000) have found an agreement with early works on this relation. For instance, Domínguez et al. (2002) using the 2dF Galaxy group catalog in the redshift range 0.02 < z < 0.05 found that the morphology-density relation is clearly seen up to galaxy groups with virial masses of Mvirial > 1013.5 M . Goto et al. (2003) using SDSS galaxies in the redshift range of 0.01 < z < 0.054 confirmed that ETGs increase and LTGs decrease toward increasing local galaxy density, and that in the outer region of clusters, the morphologydensity relation becomes less noticeable, thus physical mechanism that change the galaxy morphology act in denser environments, i.e. in the inner regions of clusters. 1.1.3. Color-magnitude relation. The colors of galaxies in clusters have a small spread, with a tight color-magnitude relation (Baum, 1959; de Vaucouleurs, 1961). Visvanathan, & Sandage (1977) confirmed the color-magnitude relation (CMR) using galaxies from nine nearby galaxy clusters, they showed that the relation is strongly wavelength dependent with a maximum near λ3500, a tight relation is seen in the u − V vs V diagram, with brighter galaxies having redder colors. They further noticed the universality of this relation, the color-magnitude relation for all their sample has a roughly constant slope and scatter for their entire sample. They can be made to coincide to form a common composite correlation and, thus, the CMR can be used to find relative distances. Extensive studies have been done in the literature to check the validity of the color-magnitude relation both, in low and high redshift galaxy clusters (Sandage, & Visvanathan, 1978; Bower et al., 1992; Stanford et al., 1998; Ellis et al., 1997; Kodama & Arimoto, 1997; Blakeslee et al., 2003; Mei et al., 2006, 2009), where an insignificant small spread and similar slope is found for clusters from different epochs. The remarkable agreement in the CMR of galaxy clusters and its small evolution with redshift indicates that the ETGs in clusters have formed at earlier times of the Universe, and have evolved passively since then into the old stellar population we observe in the local examples. 1.1.4. Star formation rate - local projected density relation. The difference in colors between spirals in the field and spirals detected in the Virgo cluster by Holmberg (1958), was the first hint that the star formation rate in a cluster environment is reduced or suppressed. On the other hand, the HI content is much lower in cluster galaxies than in field galaxies with this HIdeficiency preferentially occurring in high-density regions (Davies, & Lewis, 1973; Kennicutt, 1983; Giovanelli, & Haynes, 1983; Chincarini et al., 1983). The absence of emission lines in galaxies of clusters compared to the field was identified long ago (Osterbrock, 1960; Gisler, 1978; Dressler et al., 1985). Balogh et al. (1997, 1998) measured the equivalent width of [OII] λ3727 emission line for cluster and field galaxies at 0.2 < z < 0.55 and found that the emission lines in cluster galaxies at all distances from the cluster center (< 2R200 ) are less common than in field galaxies. Large statistical samples of galaxies with SFRHα measurements at 0.05 < z < 0.1 from 2dFGRS (Lewis et al., 2002) and SDSS (Gómez et al., 2003) were used. 3.
(24) 4. introduction. to study the relation between SFR and environment. They found agreement with the work of Balogh et al.. SFR increases towards the cluster outskirts. The correlation found between star formation rate and local projected density is independent of cluster velocity dispersion and disappears at projected densities levels approximately equal to the mean density at the cluster virial radius. They conclude that this relation is not restricted to cluster cores, but are effective in all galaxy groups where the density exceeds this local density value. These observational evidence points to a transformation process, that a starforming field galaxy experiences when infalling into a high density environment, like a galaxy cluster, where its star formation is reduced until it is totally quenched (gas resevoir depleted) and finally become one more of the passively evolving member of the cluster. 1.1.5. Butcher-Oemler effect. An important piece of evidence was obtained by Butcher, & Oemler (1978, 1984) about the evolution of galaxy clusters, when they analyzed a cluster sample at low and at high redshift (z < 0.4) and found that the fraction of blue galaxies (spirals) increases with redshift (Butcher-Oemler effect). Although the above study was based only on photometric results, spectroscopic confirmation was performed by several studies (e.g. Dressler, & Gunn, 1982, 1992). The study by Ellingson et al. (2001) of 16 rich X-ray luminous galaxy clusters with 0.17 < z < 0.55 found evolution in the fractional population where in the core of clusters a similar population was found both at low or at high redshift, however, more star-forming galaxies were found in high redshift clusters at radii outside of the core region. De Propris et al. (2004) used the 2dFGRS sample of 60 clusters at z < 0.11 with spectroscopically confirmed members and compared them to the field galaxy population at the same redshift. They found a significant blue galaxy fraction in all clusters, with some of them having a blue fraction larger than 40%. The study did not find any correlation between the blue fraction and other galaxy cluster properties such as richness, substructure and concentration. Using Spitzer/MIPS 24µm and near-infrared observations for 30 massive galaxy clusters at 0.02 < z < 0.40, Haines et al. (2009) detect an increment of ∼ 3% in the fraction of blue galaxies at z = 0.02 and ∼ 10% at z = 0.30. The Butcher-Oemler effect brings a perspective on clusters as active sites for galaxy evolution and on the environmental effects that their members suffer as their morphologies and star formation histories are dramatically transformed over cosmic time. 1.1.6. Color distribution of galaxies in different environments. Color-magnitude diagrams are useful tools to infer the mass assembly and star formation histories of galaxies. As was explained in Section 1.1.3 the color of galaxies in a cluster environments have a small spread, this tight correlation for the galaxies in cluster environments is called the red sequence. However, when comparing with the field population or loose groups a blue population of galaxies appears. With the increment of large surveys mapping the sky (e.g. 2dFGRS and SDSS) astronomers have been able to study the galaxy population to higher redshifts in all environments, and it was soon realized that the red sequence is only one side of the broader phenomenon of galaxy color. Strateva et al. (2001) studied the optical colors of more than 100 thousand of galaxies with SDSS data and found that the distribution of galaxies in the.
(25) 1.1 cluster and group of galaxies. color-color diagram was strongly bimodal, using a morpholgy separation of subsamples they showed that the two peaks correspond to early and late-type galaxies, driven by their different stellar populations. Later studies have confirmed the galaxy color bimodality (e.g. Baldry et al., 2004; Balogh et al., 2004, and references therein), in that the galaxies belonging to the red peak are the red sequence members seen in high density environments, the ones in the bluer peak are referred to as the blue cloud, and the population in between are called the green valley galaxies (Martin et al., 2007; Wyder et al., 2007). The simplest interpretation for these features are attributed to the idea of an evolutionay sequence from the blue cloud towards the red sequence, with transformation processes in between (green-valley galaxies) causing to quench star formation and leave a passively evolving stellar population. It has also been argued that the green valley galaxies may only be the overlap of two broad red and blue distributions (Taylor et al., 2015) or passive galaxies where the star formation has been rejuvenated (e.g. Thilker et al., 2010; Mapelli et al., 2015). 1.1.7. Quenching mechanisms. As we have seen in the above sections, galaxies are affected by their environment over cosmic time causing changes in their morphology and star formation, the latter of which might be due to either the removal and/or expulsion of the existing gas reservoir, or by preventing the accretion of new material. The mechanisms at play can be divided in three main categories: (i) secular evolution of the galaxy mainly from Active Galactic Nuclei (AGN) and Supernovae (SNe) feedback, (ii) interactions with the intracluster medium, (iii) tidal interaction and galaxy mergers. AGN feedback the central supermassive black hole (SMBH) is an efficient mechanism to heat the halo gas and impede the cooling, which works more efficiently when the AGN is in the radio mode (e.g. Springel et al., 2005). The relation found between SMBH mass and its host mass (Magorrian et al., 1998) and galaxy velocity dispersion (Ferrarese, & Merritt, 2000) confirm the tight link of the SMBH with the evolution of its host galaxy. SN explosions are energetic enough to remove a large fraction of gas for low mass galaxies up to ∼ 108 M (Dekel, & Silk, 1986). Low mass galaxies (LTG and dwarf galaxies) due to their shallow gravitational potentials and, thus, more loosely bound gas are more prone to be affected by the hot intracluster medium that resides in dense environments which exerts pressure that removes the galaxy’s gas by ram-pressure stripping (Gunn, & Gott, 1972; Lin, & Faber, 1983). They are also affected by "galaxy harassment", due to tidally induced mass loss by close encounters with more massive galaxies and/or the tidal field of the cluster itself (Moore et al., 1998), this lead to gas fuelling to the central region of galaxies, resulting in star formation than can cause the gas to be exhausted and thus the SF quenched. Galaxy mergers are expected to be relevant in transforming galaxies. Simulations have predicted that unequal mass spirals can form a lenticular galaxy (Bekki , 1998) and major mergers produce giant ellipticals (Toomre, & Toomre, 1972; Naab, & Burkert, 2003). The high relative speeds of galaxies in the cluster cores make mergers difficult, despite frequent close encounters between the galaxies, but in the cluster outskirts mergers are more likely to take place (Mihos et al., 2004). 1.1.8. The Fornax Galaxy Cluster. The Fornax cluster is the nearest high-density region in the Southern hemisphere (m−M = 31.51 mag or DL = 20.0 Mpc, Blakeslee et al., 2009). Early stud-. 5.
(26) 6. introduction. ies about the galaxies in Fornax were done by (Hodge, 1959; Hodge et al., 1965; Welch et al., 1975; Hodge, 1978). Jones, & Jones (1980) analayzed photometry for 40 galaxies in the Fornax region complete to B = 16 mag and spectra to confirm membership for 25 of them, they found mean radial velocity as v = 1395 km/s and projected velocity dispersion of σ = 361 km/s. A complete catalog in the area was made by Ferguson (1989) with 2678 galaxies in 40 square degree by visual inspection of photographic plates taken with the 2.5m telescope at Las Campanas Observatory. Of the complete catalog 340 galaxies are selected as likely Fornax members down to an absolute magnitude of MB ' −20mag, but the catalog is complete to MB ' −18mag. Although the Fornax cluster is not classified as a rich cluster in the Abell catalog, it is predominant in the Southern hemisphere by its proximity, regular morphology and compactness. The galaxy distribution is centrally dominated by the cD galaxy, NGC 1399, which has an extensive stellar envelope (Schombert, 1986) and has a radio jet structure (Paolillo et al., 2002). Its bright galaxies are mostly ellipticals (e.g. NGC 1404, NGC 1382, NGC 1379), lenticulars (e.g. NGC 1381, NGC 1380) and some late type galaxies (e.g. NGC 1365, NGC 1350, NGC 1436). The S0 galaxy, NGC 1316 also called Fornax A, it is a radio source with an active nucleus and two radio lobes (Wade, 1963; Schweizer, 1980; Kim, & Fabbiano, 2003). In comparison with the Northern counterpart Virgo cluster D=16 Mpc, (Mei et al., 2007; Blakeslee et al., 2009), Fornax is more compact and has higher central density, around seven times less galaxies than Virgo and is 2.5 times denser in the core than Virgo (Ferguson, & Sandage, 1988). A dynamical analysis done by Drinkwater et al. (2001) for 108 member of the Fornax cluster in the magnitudes range −16 < MB < −13.5 with a mean velocity for the total sample of hvi = 1493 ± 36 km/s and a velocity dispersion of σ = 374 ± 26 km/s. They found that the Fornax cluster is composed of two substructures (see Fig. 1), the main Fornax cluster centered on NGC 1399 and a subcluster 3 degree Southwest which includes NGC 1316, with the subcluster bound to Fornax and infalling towards the cluster. They measure some parameters of Fornax at a radius of 1.4 Mpc, such as the total mass (7 ± 2) × 1013 M , luminosity 2 × 10¹¹ L and a mass-light-to ratio of 300 ± 100 M /L . A 12 CO(1 − 0) and HI survey for 21 Fornax galaxies (Horellou et al., 1995) showed that lenticular galaxies near the core of Fornax have HI deficiency, the CO emission from Fornax is weak in general with 11/21 detection and less than 10% of the gas being in molecular state, on average. Two spirals in their survey (NGC 1350 and NGC 1425) are HI-poor spirals with weak Halpha emission. X-ray observations of Fornax (see Fig. 1) with the Chandra Fornax Survey (Scharf et al., 2005) with a coverage of 1 degree centered in the cD galaxy shows highly asymmetric morphology in the soft-band (0.3 − 1.5 keV) of the intracluster gas. NGC 1399 seems to be offset compared to the intracluster core emission. NGC 1404 shows an extended Xray gas emission distorted away from NGC 1399. The temperature map of the intracluster gas in the Fornax mosaic shows that the majority of the gas does not exceed T ' 1.6 keV and indicates a plume for NGC1404 of cooler material to the SouthEast. Another galaxy showing signs of interaction with the intracluster gas is NGC 1387 with a significant X-ray halo. The majority of X-ray bright galaxies in Fornax are distributed between the Fornax core and the infalling structure identified by Drinkwater et al. (2001), away from the bulk of the intracluster gas..
(27) 1.1 cluster and group of galaxies. Figure 1: Left panel: soft-band (0.3 − 1.5 keV ) X-ray image of the Fornax mosaic (Scharf et al., 2005), from left to right the brightest galaxies are NGC 1404, NGC 1399 (cD), NGC 1387. Right panel: number density distribution of Fornax galaxies on the sky (gray scale) with positions of cluster members shown in circles for ETGs and plus signs/asterisks (late-type galaxies). The dashed ellipses are the 2σ limits of the two subclusters in Fornax, the main cluster and the Southwest subcluster (Drinkwater et al., 2001).. 1.1.9. Hickson Compact Group 90. Hickson compact groups (HCGs) are defined as small groups of four or more massive galaxies located in relative isolation (Hickson, 1997). Given that they rival the cores of galaxy clusters as the most dense galaxy environments in the nearby universe (e.g. Rubin et al., 1991; Ponman et al., 1996; Proctor et al., 2004), and with typical velocity dispersion of σ ' 200 km s−1 (Hickson et al., 1992), HCGs are expected to be the ideal environment for galaxy mergers and tidal interactions to occur (e.g. Mamon, 1992). Such events can also generate kinematically decoupled structures with active star formation, so-called tidal dwarf galaxies (TDGs), which have masses similar to dwarf galaxies resembling the metallicities of their hosts and lacking dark matter (e.g. Kroupa et al., 2010; Gallagher et al., 2010). HCGs may also host UDGs and constitute analogues to sites of dwarf galaxy pre-processing before their infall onto larger clusters. At a distance of 33.1 Mpc (m−M = 32.6 mag, see Blakeslee et al., 2001), HCG 90 is one of the most nearby compact galaxy groups accessible from the Southern hemisphere. The 19 known members have a group radial velocity of vr ' 2 600 km s−1 , and a velocity dispersion of σ ' 193 km s−1 , typical of HCGs (Zabludoff & Mulchaey, 1998). The core is dominated by three bright galaxies (NGC 7173/HCG 90b, NGC 7176/HCG 90c, NGC 7174/ HCG 90d), with a fourth giant galaxy (NGC 7172/HCG 90a) located to the north of the core (see Fig. 42), which is a Seyfert 2 galaxy and a bright X-ray source. Despite the relative proximity, there have been no detailed studies on its LSB dwarf galaxy population, as most attention has been paid to the group’s bright and/or ultracompact dwarf (UCD) (de Carvalho et al., 1994; Ribeiro et al., 1994; Da Rocha et al., 2011), and giant galaxies. This avenue of study is ripe for investigation, as other HCGs have been shown to host faint dwarfs (Campos et al., 2004; Carrasco et al., 2006; Krusch et al., 2006; Konstantopoulos et al., 2013), which are to be expected from theoretical considerations, despite the dynamically more hostile environments in these systems (Zandivarez et al., 2014).. 7.
(28) 8. introduction. HCG 90 is at an interesting stage of evolution. Several indications of interactions between its galaxies are evidenced by morphological disturbances, a diffuse X-ray halo, and intra-group light (Mendes de Oliveira & Hickson, 1994; Zabludoff & Mulchaey, 1998; White et al., 2003; Desjardins et al., 2013). It is proposed that current interactions between the core galaxies, strongly between HCG 90b/d and weakly between HCG 90c/d, have given rise to diffuse intragroup light that contributes ∼ 45% to the total light (White et al., 2003). Additionally, a warm gas envelope is shared by HCG 90b and d, while tidal bridges have been found between HCG 90b, c, and d (Plana et al., 1998; Mendes de Oliveira & Hickson, 1994). All this makes HCG 90 an intriguing laboratory to investigate interactions between giant and dwarf galaxies, and their star cluster satellites.. This thesis is mainly focused in a galaxy cluster environment, in particular the Fornax galaxy cluster. There is one special chapter dedicated to a galaxy group environment, the HCG 90, with the aim to compare the different environments, but only focused on the dwarf galaxy population comparison. In the following sections of the introduction, the different stellar systems contained in a galaxy cluster are reviewed with emphasis on the dwarf galaxy population, nuclear star clusters and compact stellar systems. 1.2. dwarf galaxy population. In the annual review by Hodge (1971), he used the definition for dwarf galaxies as galaxies of small intrinsic size, small absolute luminosity and low surface brightness. At that time only few members of the Local Group were identified as members, e.g. Ursae Minor and Draco (Wilson, 1955), Sculptor (Shapley, 1938), Fornax (Shapley, 1939), LeoI and LeoII (Harrington, & Wilson, 1950), NGC 205 (Messier, 1798) and NGC 185 (Herschel, 1789) and outside the Local Group dwarf galaxies also started to be detected (e.g. Hodge et al., 1965; Sandage & Binggeli, 1984; Karachentseva et al., 1985; Impey et al., 1988). Further progress with photographic plates in the dwarf population was not possible due to instrumental limitations. The advent of charge coupled device detectors in astronomy changed the course for the low surface brightness science and an exponential growth in the number of dwarf galaxies have been and will continue to be detected. Dwarf galaxies are the most numerous types of galaxies in the universe, and according to the hierarchical assembly scenario are the essential ingredients for the build up of massive galaxies. The Local Group dwarf population is now about 10 times larger in number than half a century ago, with more than 100 nearby dwarfs. An overview of the properties of our closest dwarf population can be found in the reviews by Tolstoy et al. (2009); McConnachie (2012) and some of the new LG dwarf members in Laevens et al. (2015); Koposov et al. (2015); Bechtol et al. (2015). The rise of large detector arrays in present-day observatories have helped to survey large areas of the sky in different environments throughout the local Universe (e.g., Chiboucas et al., 2013; Merritt et al., 2014; van Dokkum et al., 2015; Muñoz et al., 2015; Ordenes-Briceño et al., 2016; Müller et al., 2017; Venhola et al., 2017; Wittmann et al., 2017; Eigenthaler et al., 2018)..
(29) 1.2 dwarf galaxy population. 1.2.1. Morphological types. The overwhelming number of dwarf galaxies have made possible to understand in much more detail their stellar populations, surface brighteness, gas fraction, mass-to-light ratio, among other properties. The general agreement to consider a galaxy as a dwarf is when its absolute magnitue is MV > −18 mag (Grebel et al., 2003). Dwarfs can be grouped in two main categories according to their properties: Early-type dwarfs, which tend to be gas poor, quiscent, preferentially found in high-density environments and late-type dwarfs with a higher gas fraction and with star formation, regularly found in low-density environments. For the early-type dwarfs, we have the dwarf ellipticals (e.g. Ferguson, & Binggeli, 1994), dwarf spheroidals (e.g. Grebel et al., 2003), ultra-faint galaxies (e.g. Belokurov et al., 2006) and ultra-diffuse galaxies (van Dokkum et al., 2015; Mihos et al., 2015). For the late-type dwarfs (e.g. Schombert et al., 1995; Matthews, & Gallagher, 1997), we have the dwarf spirals, dwarf lenticulars, dwarf irregulars and blue compact dwarf galaxies. As this thesis is about a cluster environment, further details will be given only for the early-type dwarfs, further information about the different morpologycal types and the late-type dwarfs can be found in Grebel (2001), and the book Galaxies in the Universe (Sparke, & Gallagher, 2007, chapter 4). The main differences between the different early-type dwarfs are in surface brightness, luminosity and size. Dwarf ellipticals are bright and have a higher central stellar density, and, for instance in the LG, are only found near Andromeda galaxy (McConnachie, 2012). Dwarf Spheroidals are more diffuse, with lower surface brightness and less concentration in the galaxy center compared to dwarf ellipticals. Smaller in size and much fainter than dSph are the ultra-faint dwarfs, they have luminosities comparable with those of globular clusters. On the other hand, the ultra-diffuse galaxies have similar low surface brightness as dSph but are much more extended in size and less luminous. van Dokkum et al. (2015) considers a galaxy as an ultra-diffuse galaxy when the effective radii is reff > 1.5 kpc. 1.2.2. Surface Brightness Profiles. The surface brightness profiles of galaxies are well parameterized by a (Sérsic , 1963) model with the form: I(r) = Ie exp −bn [(r/re )1/n − 1]. (1). With re as the effective radius, Ie as the intensity at re , n as the shape or Sersic index which definess the curvature of the model. bn is a constant chosen to be consistent with re to enclose half of the galaxy luminosity (Caon et al., 1993). Capaccioli et al. (1989) estimated an empirical value for the constant bn to be ' 2n − 0.327. de Vaucouleurs (1948) studied the light distribution of early-type galaxies, including the bulge of disc galaxies and found a power law ∝ r1/4 , thus later with the generalized Sersic model this would be n = 4. For disk galaxies an exponential profile with n = 1 is a good approximation for their light profile. The work by Ferrarese et al. (2006) using exquisite data from the Advance Camera for Survey (ACS) on the Hubble space telescope (HST) for Virgo earlytype galaxies showed that their light profiles are generally well described by a Sérsic model with index n depending on the luminosity, increasing steadily for brighter ETGs.. 9.
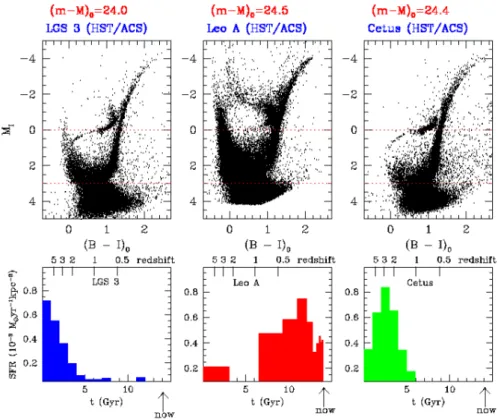
(30) 10. introduction. Bright galaxies have complex light profiles, usually with more than one morphological component. For instance, spiral galaxies have a disc, bulge and halo as symmetric components and the asymmetric component are their spirals arms, which are harder to model (e.g. Kormendy, 1977, 1979; Peletier, & Balcells, 1996; Kormendy et al., 2009). Therefore, when trying to fit a galaxy with a complex light profile, there are residuals left for the components that are not symmetric and easy to fit. These residuals are very helpful to identify hidden components and/or signatures of interactions or mergers (e.g. Ferrarese et al., 2006; Kormendy et al., 2009). The profile for dwarf galaxies is normally well fit by a single Sersic model for magnitudes fainter than MV ' −16 mag, after that the light profiles becomes more complex, requiring the fit of more profiles. For instance, in the Virgo cluster, more than 50% of the bright early-type dwarfs were found to show underlying disk features (Lisker et al., 2006a). 1.2.3. Stellar populations. A galaxy harbors a composite stellar population in terms of age and metallicity with stars of different spectral types and luminosities. The distribution of ages and metallicities of a galaxy can tell us about its star formation history. The nearby dwarfs in the LG can be resolved into individual stars. Several studies have investigated the chemical composition of LG dwarfs using their red giants (e.g. Geisler et al., 2005; Koch et al., 2008; Kirby et al., 2017). Red giant stars (see Sect.1.4.1.1) are sensitive to metallicity. We can observe this in a color magnitude diagram when the range in color for red giants is widely populated, which can be verified with spectroscopic observation to be consistent with a spread in metallicity in the observed stellar population. The use of the information from CMDs in combination with spectroscopic metallicities for individual red giant branch stars is a tool to constrain the star formation and chemical evolution histories of composite stellar populations. The technique is known as synthetic CMD method and is based on comparing the observed CMD with a theoretical one that is created via Monte Carlo simulation, extracting the parameters for stars from stellar evolutionary tracks (or isochrones) with different star formation laws, IMFs, binary fractions, agemetallicity relations, among other parameters (see the review by Tolstoy et al., 2009). The resulting synthetic CMD has to reproduce all the main features of the observed one (e.g. shape of the CMD, luminosity, color distribution, etc). An example of the SFH that can be obtained with this method is shown in Fig. 2 for three LG dwarfs: LGS 3, LeoA and Cetus (Tolstoy et al., 2009). For extragalactic studies, integrated galaxy colors are widely used as proxy mainly for the metallicity but also for age of the galaxy stellar population. The color of galaxies in a cluster environment have a small spread, the so called red sequence of galaxies (see Section 1.1.3 and 1.1.6). The studies in the literature until some years ago were done in the bright galaxy regime due to a lack of a large dwarf sample with color information and with lower surface brightness. Recent studies have shown that the red sequence for bright galaxies in a cluster is naturally extended towards the dwarf regime, becoming broader in color and with a flatter distribution towards fainter magnitudes compared to the bright regime (Roediger et al., 2017; Eigenthaler et al., 2018). No color bimodality is seen neither in the Virgo or Fornax cluster as expected, suggesting that their galaxy members have been long enough in their potential to have truncated star formation histories. Spectroscopic studies of dwarf galaxies using Lick absorption line indices revealed intermediate to old ages, subsolar metallic-.
(31) 1.2 dwarf galaxy population. Figure 2: HST/ACS CMDs and SFHs for three LG dwarf galaxies: LGS 3, Leo A and Cetus (Tolstoy et al., 2009). ities and around solar α-element abundances (e.g. Geha et al., 2003; Michielsen et al., 2008; Paudel et al., 2010; Chilingarian, 2009; Koleva et al., 2009). For bright dEs, stellar population gradients were found for a large fraction of dEs, some dEs have a steep radially declining metallicity profile, but some show no metallicity gradients. The stellar age seems to remain constant or slightly increasing outwards. 1.2.4. Scaling relations. The fundamental plane (FP) for ellipticals is a tight correlation between three parameters: effective radius, central velocity dispersion and effective surface brighteness (Djorgovski, & Davis, 1987; Faber et al., 1987, and references therein). The FP links the structural and dynamical properties of galaxies with their stellar content. The Kormendy relation is a projected FP onto the reff -Ie plane (Kormendy, 1977) and the Faber-Jackson relation is recovered when the FP is preojected onto σ − L plane (Faber, & Jackson, 1976). The existence of the FP and its small scatter (e.g. Jorgensen et al., 1996) points to a uniform formation proccess for the massive ellipticals, with tight age and metallicity constraints for their stellar population. For more details see the review by Renzini (2006). The extension of the FP towards the low mass galaxies was first studied by Kormendy (1985) finding a discontinuity between the parameter correlation for ellipticals and those of dwarf galaxies. Interesting results of this study are: (i) the seven dwarfs from the Local Group and the three in the Virgo Cluster have a radius vs luminosity relation which does not resemble the one as the bright ellipticals. (ii) The dwarf ellipticals in his sample have larger core radii with increasing luminosity. (iii) The dwarf spheroidals also have smaller velocity dispersions than. 11.
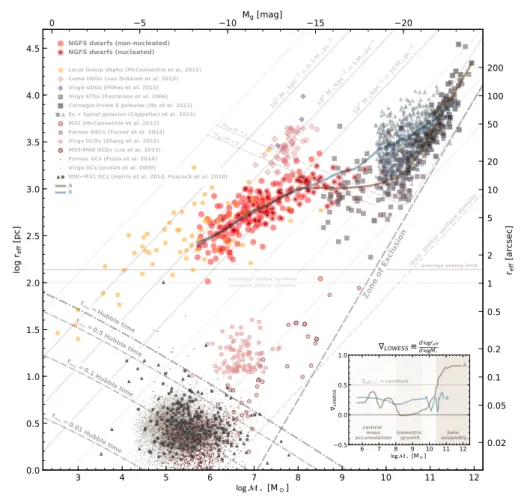
(32) 12. introduction. ellipticals of comparable luminosity. (iv) Fainter spheroidals have lower central surface brightnesses. (v) dSph, dwarf spirals and irregular galaxies have identical range in the parameter correlations. (vi) bulges and ellipticals, dwarf spheroidals, and globular clusters are three remarkably different kinds of stellar systems. Binggeli, & Cameron (1991) studied the correlation properties of ETGs in the Virgo cluster, they found that in the radius range between 0.1 − 1 kpc, the relation with luminosity shows two well distinct classes, clasyfing them into the "classical" types (E,S0) and the "dwarf" types (dE,dS0). The dichotomy seen in the FP parameter between elliptical and dwarf galaxies is understood as a proof of the the different formation processes for both systems. The common idea is that ellipticals formed from the continuous merger events and dSph formed via environmental and secular processes from a late-type dwarf with star formation into dSph with little or non SF processes (e.g. Kormendy et al., 2009). A recent study done by Eigenthaler et al. (2018) analyzed the color and structural parameters for 258 dwarf galaxies in the core region of the Fornax galaxy cluster, covering stellar masses in the range of log(M/M ) ' 5.5 − 9.5, the majority of them with effective surface brightness of ∼ 1 − 10 M /pc−2 but the massive dwarfs reach ∼ 100 M /pc−2 . The scaling relations in sizemass-surface density plane for Fornax dwarfs with lower stellar masses than log(M/M ) < 8 start to deviate towards lower effective surface mass density P ( eff,η∗ ). In the size-luminosity plane (see Fig.3), this is seen as the faint dwarfs P to be positively inclined with respect to the lines of equal eff,η∗ . In their scaling relations they overplot other systems, among them the Local Group dwarfs that were catalogued in McConnachie (2012), some of them being the ultrafaint dwarf galaxies. Their scaling relations appear to line up seamlessly with the Fornax dwarf sample occupying the lower stellar masses and lower surface mass densities. In the extended objects regime of the size-luminosity diagram, there is the well known sequence for bright ETGs, beside that there is another sequence that emerges for the UDG type. A few UDGs were found in the core region of Fornax, but overplotting the UDG parameters from the literature, a clear sequence, as a natural linear extension of the low surface brightness dwarf galaxies (dSph). 1.3. nuclear star clusters. Nuclear star clusters are very dense stellar systems with sizes similar to globular cluster (GCs, ∼ 3 − 10 pc) (Böker et al., 2004; Côté et al., 2006; Turner et al., 2012; den Brok et al., 2014; Georgiev & Böker, 2014; Puzia et al., 2014) but with a broader range of masses 105 −108 M (e.g., Walcher et al., 2006; Georgiev et al., 2016; Spengler et al., 2017). Nuclei are a common characteristic in galaxies, from dwarfs to giants. The nucleation fraction can reach around 70-80% and is independent of the galaxy morphology (Böker et al., 2004; Côté et al., 2006; Georgiev et al., 2009; Turner et al., 2012; den Brok et al., 2014; Georgiev & Böker, 2014; Muñoz et al., 2015; Eigenthaler et al., 2018). As NSCs are common in all galaxy types, this suggests that their formation is instrinsically linked to galaxy evolution. The nuclear star cluster in the Milky Way has been studied extensively (e.g. Launhardt et al., 2002; Schödel et al., 2009; Chatzopoulos et al., 2015). The study by Schödel et al. (2014) used mid-IR data to overcome the interstellar extinction toward the galactic center and found that the NSC is centered on Sgr A∗ has a half light radius of rh = 4.2 ± 0.4 pc and stellar mass of M = 2.5 ± 0.4 × 10⁷ M with axis ratio q = 0.71 ± 0.02..
(33) 1.3 nuclear star clusters. Mg [mag]. 2. pc. pc. =1 0M. M =1 2. 2. kp c. kp c. M. kp c M. M 10 7. 10 5. 100 50 20 10. de. ns. 3.0. 200. ity. 3.5. 2. Local Group dSphs (McConnachie et al. 2012) Coma UDGs (van Dokkum et al. 2015) Virgo UDGs (Mihos et al. 2015) Virgo ETGs (Ferrarese et al. 2006) Carnegie-Irvine E galaxies (Ho et al. 2011) Es + Spiral galaxies (Cappellari et al. 2011) M32 (McConnachie et al. 2012) Mdyn /M = Fornax NSCs (Turner et al. 2012) 1 Mdyn /M = Virgo UCDs (Zhang et al. 2015) 5 M59/M60 UCDs (Liu et al. 2015) Fornax GCs (Puzia et al. 2014) Virgo GCs (Jordan et al. 2009) MW+M31 GCs (Harris et al. 2010, Peacock et al. 2010) A B. 4.0. 20. =0 .1 M. 4.5. 15 2. NGFS dwarfs (non-nucleated) NGFS dwarfs (nucleated). 2. 10. pc. 5. 10 6. 0. 1.5 t. 1.0 0.5 0.0. t. =H ubb le ti = 0. me 5H ubb le ti me. reff [arcsec]. lla rs. 1. LOWESS. 1.0. d reff d M. 0.2 A. eff,. 0.5. 0.1. = constant B. 0.05. 0.0. = 0. 01 H ubb le ti me. 4. 2. 0.5. = 0. 1H ubb le ti me. 3. ste. sion t. ma x.. Exc lu t. average seeing limit. e of. 2.0. urf. ace. 5. Zon. extended stellar systems compact stellar systems. LOWESS. log reff [pc]. 2.5. 0.5. 5. 6. 7. [M ]. 8. 9. central isometric mass accumulation growth. 6. 7. 10. 8. halo assembly. 0.02. 9 10 11 12 [M ]. 11. 12. Figure 3: Effective radius versus stellar mass relation for NGFS galaxies (red symbols) and various other stellar systems (Eigenthaler et al., 2018). The nucleation fraction decreases with luminosity (e.g., Muñoz et al., 2015), going from as high as ∼ 90% for galaxies brighter than Mi ' −16 mag to 0% for Mi ' −10 mag. This may be related to instrument sensitivity limits, beyond which it becomes harder to detect the lowest surface brightness spheroids and, thus, to associate a nucleus with a low-surface-brightness galaxy spheroid. Towards the bright galaxy regime, it has been noticed that nuclei are no longer detected for galaxies with MB < −19.5 mag. This might be related to the fact that the central parsecs of bright galaxies can have complex surface brightness profiles, which makes it difficult to separate the galaxy light from the nucleus light, if at all present (e.g. Côté et al., 2006; Turner et al., 2012). 1.3.1. Stellar populations. The stellar population properties of nuclei are complex, revealing multiple stellar populations rather than being old and metal-poor objects. Using spectra, Rossa et al. (2006) found in a sample of 40 late-type galaxies (LTGs) that the luminosity weighted ages of half of the nuclei are younger than 1 Gyr, within a range from 10 Myr to very old ages > 10 Gyr (see also Walcher et al., 2006). For 26 early-type galaxies (ETGs) in the Virgo cluster, Paudel et al. (2011) found spectroscopic evidence that the age distribution of nuclei is dominated by young ages. In terms of metallicity, their work revealed a broad metallicity distribution of the nuclei, from −1.22 dex to +0.18 dex, which was wider compared to the. 13.
(34) 14. introduction. host galaxy metallicity range. When analyzing age and metallicity distributions in radial profiles using bins along the major axis of the dwarf galaxies, Paudel et al. found that the inner bins are dominated by young ages and broader metallicity distributions than outer regions. In the Virgo cluster about 15% of the Virgo early-type dwarfs brighter than MB = −15.5 mag reveal blue centers, which were spectroscopically shown to correspond to recent star formation (Lisker et al., 2006b). A more recent study by Spengler et al. (2017) observed in the same cluster that, on average, the nuclei and host galaxies have similar metallicities with a mean metallicity of 0.07 ± 0.3 dex, but if they exclude the galaxies that deviate from the mass-metallicity relation then nuclei are on average 0.20 dex more metal-rich than their host galaxies. The observational evidence of young ages in stellar nuclei hints towards a picture where star-formation episodes seem to be frequent and repetitive. However, the underlying old stellar population for individual nucleus (> 1 Gyr) is hard to detect in spectroscopy data, as the young stellar population is the one that dominates the spectrum. Therefore, an accurate age determination for the most recent and the oldest star formation episodes is still needed. 1.3.2. Coexistence with Massive Black Holes. At the bottom of the potential well of a galaxy where the nuclear star clusters are located, we also find super massive black holes (SMBH). In our own galaxy, there is strong evidence for the existence of a SMBH coming from stellar dynamics, the SMBH mass is 4 × 10⁶ M and it is located at the heart of the Milky Way’s NSC (e.g. Genzel et al., 2010; Gravity Collaboration et al., 2018). The presence of SMBHs in other galaxies has been probed over the years, and it is believed that it is an ubiquitous component for massive galaxies (> 1010 M ) (see the review Kormendy & Ho, 2013). In some galaxies the nuclear star cluster coexists with the SMBH (e.g. Seth et al., 2008; Graham, & Spitler, 2009; Neumayer & Walcher, 2012; Nguyen et al., 2018). For some galaxies,the presence of a stellar nucleus is confirmed, but no apparent SMBH is present (Gebhardt et al., 2001; Valluri et al., 2005). While some massive ellipticals with an enhanced core have SMBHs but lack NSCs (Côté et al., 2006). Nevertheless, for low mass galaxies the presence of central BHs is not well constrained (e.g. Miller et al., 2015), but we know that most of them host a nucleus (e.g. Turner et al., 2012; Georgiev & Böker, 2014; Spengler et al., 2017). As the low mass galaxies dominate the number density in the Universe, the search for BHs in low-mass galaxies is important for constraining galaxy evolution models. Recently, Nguyen et al. (2018) presented a study of the NSCs and SMBHs of three low-mass early-type galaxies in the field: M 32, NGC 5102, and NGC 5206. They measured the dynamical masses for the BHs and NSCs using stellar kinematics, photometry and Jeans Anisotropic Models. These studies confirm the view that BHs and NSCs coexist in the inner parsecs of galaxies. The absence of NSC in the high mass galaxy regime and the abscence of BHs in the low mass regime are intriguing. Probably as we have seen with the study of Nguyen et al. (2018), BHs will continue to be detected in dwarf galaxies, the question is whether there is a limit in mass to have a BH-NSC coexistence in dwarf galaxies. At the high mass regime, the lack of detection of NSCs can be related with the complex inner parsecs of high-density cored galaxies and/or with the fact that the SMBHs may efficiently dissolve the NSCs inside their increasingly large spheres of influence, that are comparable.
(35) 1.3 nuclear star clusters. in radius to those of the nuclear clusters (e.g. Bekki, & Graham, 2010; Antonini , 2013). 1.3.3. Scaling relations. Nuclear cluster studies have revealed several correlations between nuclei and their host galaxies, such as the nucleus to galaxy luminosity relation (Carollo et al., 1998; Lotz et al., 2001; Graham, & Guzmán, 2003; Böker et al., 2004; Côté et al., 2006), their velocity dispersion and galaxy mass1 and Sersic index (e.g. Ferrarese et al., 2006; Rossa et al., 2006; Graham, & Driver, 2007), and the sizeluminosity relation (Böker et al., 2004; Côté et al., 2006; Turner et al., 2012; Georgiev & Böker, 2014; den Brok et al., 2014; Spengler et al., 2017). These correlations indicate a connection between the nucleus and the formation of its parent galaxy. The general trend in the high-luminosity galaxy regime is that the brighter the galaxy becomes the brighter (proportionally) its nucleus becomes. Although, for LTGs the slope of the relation is less steep, indicating that for a fixed galaxy mass (or luminosity) the stellar nucleus seems to have a lower mass and size than the nucleus of ETGs (Georgiev & Böker, 2014). The ratio between the nuclei over galaxy luminosity (ηL ) has been studied in dense environments like Fornax and Virgo clusters and found a large scatter in the luminosity range MB > −15 mag with a mean value hηL i = 0.41% in Fornax (Turner et al., 2012) and hηL i = 0.3% for Virgo (Côté et al., 2006). 1.3.4. Formation scenarios. The two proposed formation scenarios for nuclei are globular cluster infall due to dynamical friction (Tremaine et al., 1975) and in situ star formation (van den Bergh, 1986). The latter needs a mechanism to funnel gas into the galaxy center. Some studies that suggest a mechanism to carry the gas inwards to be galaxy mergers between two disk galaxies (Mihos & Hernquist, 1994), supernova feedback outflows that become stalled because the intergalactic medium (IGM) pressure prevents the gas from escaping the dwarf galaxy (Babul & Rees , 1992), and gas disks embedded in an old stellar spheroid (Bekki , 2007). Observational studies for ETGs have argued that the predominant mechanism for nucleus formation in more massive galaxies are dissipative processes, sinking gas to the central galaxy regions with star formation occurring in situ, while for low-mass galaxies nucleus formation occurs via GC infall due to short dynamical timescales (e.g. Lotz et al., 2004; Côté et al., 2006; Turner et al., 2012). In this context, we note that in the Virgo cluster, more than 50% of the bright early-type dwarfs were found to show underlying disk features, with the disk fraction decreasing to only a few % for such dwarfs fainter than MB = −15.5 mag (Lisker et al., 2006a), corresponding to log(M? /M ) ' 8.6 (see Fig. 7 in Eigenthaler et al., 2018). Moreover, about 15% of the Virgo earlytype dwarfs brighter than MB = −15.5 mag reveal blue centers, which were spectroscopically shown to correspond to recent star formation (Lisker et al., 2006b). In a more recent work, Spengler et al. (2017) have compared their multiband photometry of nuclei with scaling relation predictions from Bekki (2007) and Antonini et al. (2015) and inferred that there is no single preferred formation scenario for nuclei, suggesting a mix of processes instead (see also Da Rocha et al., 2011). 1 For late-type galaxies, this would be the bulge mass.. 15.
Figure

+7


Documento similar