Large scale anisotropies on halo infall
12
0
0
Texto completo
(2) 2. L. Ceccarelli et al.. the mass increases (see for instance Paz et al. 2006). Therefore halo shapes are likely to depend on the accretion process driven by halo mergers. Following this line, it is expected a strong correlation between the velocity field in the neighborhood of haloes and the directions defined by the halo shape axes. Most of these previous studies focused on the fact that alignments and preferential directions are consequences of the formation process of haloes. However, the effects of such preferential directions on the peculiar velocity field at large scales have not been so extensively addressed. In a hierarchical clustering scenario these peculiar velocities are generated by inhomogeneities in the distribution of matter in the universe. The nature of this velocity field depends on the local density. High density regions show random motions typical of virialised objects whereas low density environments, on the other hand, are more likely to show streaming motions: objects falling towards larger potential wells constantly increasing the amplitude of their clustering strength (Diaferio & Geller 1997). In this work we use a numerical simulation of the standard scenario of Cold Dark-Matter with a cosmological constant (ΛCDM) to explore different features of the peculiar velocity field and its relation to haloes and their large-scale surrounding region (referred to as LSSR hereafter). In Section 2 we describe the analysis of the simulation, Section 3 deals with the anisotropies of the velocity field in relation to halo and LSSR shape and orientation. We also consider in this section the infall of particles and haloes in different local density regions. In Section 4 we explore the turbulence of the flow along different directions and finally in Section 5 we analyse the outflow of particles from haloes and its relation to the LSSR. We present our conclusions in Section 6.. sis on samples of central haloes with different masses. We draw five halo subsamples with equal number of haloes of different mass starting at a minimum of 50 particles or 3.5 × 10¹² M⊙ h−1 (the lowest mass sample considered includes haloes of up to 64 particles each). The subsample with the most massive haloes starts at 260 particle members corresponding to 1.9 × 10¹³ M⊙ h−1 . Throughout this work, we estimate statistical errors by means of the jacknife technique, which has been shown to provide equivalent results to error estimates obtained from the variance of a large number of independent simulations (see for instance, Croton et al. 2004; Padilla & Baugh 2003). These results indicate that jacknife errors provide a reasonable estimate of statistical uncertainties and cosmic variance.. 2. Iij = (1/Nh ). DATA. Throughout this work we use a collisionless numerical simulation of 5123 particles covering a periodic volume of 5003 (h−1 Mpc)3 . We assume a spatially flat low-density Universe, with a matter density Ωm = 1 − ΩΛ = 0.28, Hubble constant H◦ = 74 km s−1 Mpc−1 , and normalisation parameter σ8 = 0.8. With these parameters the resulting particle resolution is mp = 7.2 × 10¹⁰ M⊙ h−1 . The initial conditions at redshift ∼ 50 were generated with the GRAFIC2 package (Bertschinger 2001), which also computes the transfer function as described in Ma & Bertschinger (1995). The simulation run was performed using the second version of the GADGET code developed by Springel (2005), with a gravitational softening of 0.03h−1 Mpc chosen following Power et al. (2003). The identification of particle clumps to be associated to dark matter haloes was carried out by means of a standard friends-of-friends algorithm with a percolation length given by l = 0.17 ν̄ −1/3 , where ν̄ is the mean number density of dark matter particles. We identified approximately 470, 000 dark-matter haloes with at least 10 particle members, resulting in a minimum halo mass of Mmin = 7.2 1011 M⊙ h−1 . It should be noticed that this algorithm does not resolve substructures within the dark-matter haloes. From this point on, we will centre most of our analy-. 3. VELOCITY FIELD ANISOTROPIES. In this section, we analyse anisotropies of the radial velocity field relative to the centre halo shape axes. We also analyse the dependence of this velocity field with respect to the surrounding mass distribution at small and large scales.. 3.1. Dependence on the halo shape. Several authors (Warren et al. 1992; Thomas et al. 1998; Hopkins et al. 2005; Allgood et al. 2006; Kasun & Evrard 2005; Lau et al. 2010; Paz et al. 2006, and references therein) have analysed the properties of halo shapes using the best-fitting ellipsoid to the spatial distribution of the halo material. Following this standard method, we calculate the shape tensor for each dark-matter halo using the positions of its particle members. This can be written as a symmetric matrix, Nh X. Xαi Xαj ,. (1). α=1. where Xαi is the ith component of the displacement vector of a particle α relative to the centre of mass, and Nh is the number of particles in the halo. The matrix eigenvalues correspond to the square of the axis (a, b, c were a > b > c) of the characteristic ellipsoid that best describes the spatial distribution of the halo members. The principal axes of this ellipsoid are represented by the eigenvectors â, b̂ and ĉ1 . Haloes with b/a < c/b are associated to general triaxial ellipsoids with prolate shape, while the opposite case, b/a > c/b, corresponds to predominantly oblate systems. Numerical results based on this shape analysis have shown that haloes exhibit aspherical shapes, with a slight preference toward prolate forms. Moreover, it has been shown that their orientations are related to their surrounding structures (Colberg et al. 2005; Kasun & Evrard 2005; Basilakos et al. 2006; Allgood et al. 2006; Altay et al. 2006; Aragón-Calvo et al. 2007; Brunino et al. 2007; Bett et al. 2007; Zhang et al. 2009). Several authors have found that 1. A fixed b/a = 1 with an arbitrary value of c/b, corresponds to perfect oblate ellipsoids. On the other hand, systems with fixed c/b = 1 are perfect prolate ellipsoids.
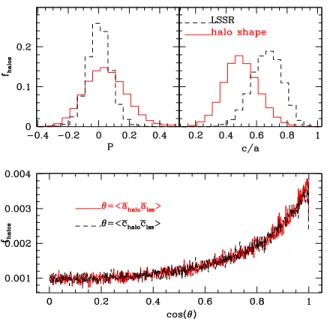
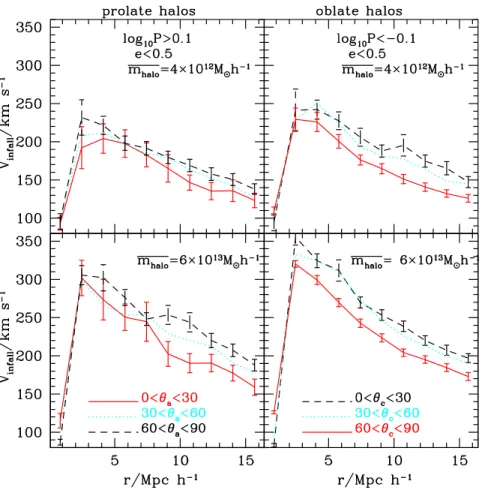
(3) Large scale anisotropies on halo infall. Figure 1. Upper panel: histograms showing the shape (left) and eccentricity distribution (right) of haloes (red) and the LSSR (black). Lower panel: normalised distribution of the angle between haloes and LSSR minor axes (black). The corresponding distribution for major axes is shown in red lines.. dark matter haloes tend to be more prolate and aspherical when larger halo masses are considered (Kasun & Evrard 2005; Paz et al. 2006, and references therein). This trend could be easily understood as the result of an accretion process driven by halo mergers. Therefore, we have a physical motivation to expect a connection between the halo surrounding velocity field and the particular directions defined by the halo shape axes. The resulting halo ellipticities, which are defined as the ratio c/a, are shown in red lines in the right upper panel of Figure 1. Following Paz et al. (2006) we separate prolate and oblate ellipsoids through a triaxiality parameter “P ” defined as: P = log ((c/b)/(b/a)) ,. (2). where systems characterised by P > 0 (P < 0) correspond to halo with prolate (oblate) shapes. In the left upper panel of Figure 1 we show the distribution of triaxiality parameter values (red line) derived for haloes. As can be noticed in this figure haloes show a trend towards prolate shapes, in agreement with previous results (see for instance Paz et al. 2006) In order to characterise velocity field anisotropies around haloes, we calculate the mean radial velocity of particles taking into account their positions relative to the dark matter halo major axes. We compute radial velocities relative to the halo centre, with positive velocities indicating mean infall flux and negative values, outflow velocities. Along this subsection we analyse elongated haloes, characterised by small ellipticity parameters (e = c/a < 0.5). From this subsample we select either prolate or oblate haloes, corresponding to triaxiality parameters P > 0.1 or P < −0.1. From this point on we will simply refer to these two halo subsamples as prolate and oblate haloes.. 3. For prolate haloes, we define θa as the angle subtended by the halo-particle relative position and the major axis. We calculate the average radial velocity as a function of haloparticle separation in three cases; i) for particles close to the major axis (θa < π/6), ii) for particles roughly perpendicular to the major axis (π/3 < θa < π/2) and iii) for particles at intermediate positions (π/6 < θa < π/3). The resulting velocity curves are shown in the left panels in Figure 2, where the upper panel corresponds to low mass haloes (m̄halo = 4×10¹² M⊙ h−1 ; 7.2×10¹¹ M⊙ h−1 < mhalo < 4.5× 10¹² M⊙ h−1 ) and the lower panel corresponds to high mass haloes (m̄halo = 6×10¹³ M⊙ h−1 ; 1.9×10¹³ M⊙ h−1 < mhalo ). Red lines in the left panels Figure 2 show the velocity field traced by particles along the major axis ; cyan lines correspond to particles in intermediate positions and black lines correspond to velocities of particles with positions perpendicular to the major axis. Similar results were obtained for the intermediate mass bins. In a similar fashion, we derive the velocity field for particles along the minor axis and in the perpendicular direction for oblate haloes. We define θc as the angle subtended by the halo-particle relative position and the minor axis direction. The mean velocities obtained are shown in the right panels of Figure 2 where black lines show the velocity field traced by particles along the minor axis (θc < π/6), red lines correspond to velocities of particles with positions perpendicular to the minor axis (π/3< θc < π/2), and cyan lines correspond to particles at intermediate positions (π/6< θc < π/3). We use the same halo mass ranges in both left and right panels of Figure 2. As can be seen in Figure 2, velocities are positive over the entire scale range, indicating that the surrounding material is infalling onto haloes regardless its mass or direction. It is worth mentioning that the larger infall velocities are obtained for the more massive haloes, in agreement with previous results (Ceccarelli et al. 2005) and theoretical predictions (Pivato et al. 2006; Croft et al. 1999, and references therein). Regarding the analysis of prolate haloes, it can be seen in the left panels of Figure 2, that the mass infall amplitude is sightly smaller in the direction along the major axis (red lines) than the corresponding infall obtained over the perpendicular plane to major axis (black lines). For oblate haloes (right panel on Figure 2), the largest infall velocities are obtained at directions parallel to the minor halo axis (black line), which exceed by approximately 40 km/s the corresponding velocities obtained along the perpendicular direction (red line). Both observed anisotropies for prolate and oblate halo subsamples, can be understood as a tendency of the surrounding mass to fall faster from minor axis directions, which are the directions set by the more flattened sides of the halo shape ellipsoid. This difference is detected up to distances to the halo centre of the order of a few times the virial radius (approximately up to distances around 2 to 3 Mpc h−1 ). 3.2. Dependence with the surrounding structure. We have also analysed the velocity field dependence on directions defined over the surrounding large scale mater distribution. For this purpose we estimate the shape tensor of a spherical large scale region around dark matter haloes, ex-.
(4) 4. L. Ceccarelli et al.. Figure 2. Mean infall velocity as a function of distance to the central halo for different shape of halo. Upper panels correspond to high mass haloes and lower panels to low masses as is indicated in the figure. Left panels show results for prolate haloes and right panels for oblate haloes. Different colours indicate infall directions at different angles from the halo principal axes a and c. Red lines in the left panels indicate θa < π/6, cyan lines π/6< θa < π/3 and black lines π/3< θa < π/2. Black lines in right panels indicate θc < π/6, cyan lines π/6< θc < π/3 and red lines π/3< θc < π/2.. cluding the inner region containing the central halo. In the same way as for dark matter haloes, the surrounding large scale distribution can be characterised by triaxial ellipsoids with positive or negative triaxiality parameters. It can be said that LSSR with P > 0 (P < 0) correspond to “filamentary” (“sheet-like”) matter distributions. We use this surrounding large-scale structure at the present time (z = 0) to characterise the large-scale environment. We expect the presence of correlations between the LSSR distribution, and the surrounding velocity field at the present time. We stress the fact that the dynamical timescale of this volume is large enough to contain information on the accretion process of the central halo across the halo evolutionary stages. Thus, compared to the halo crossing time, the LSSR inertia principal axes can be taken as quasi stationary. For instance, a typical halo of 1013 M⊙ has a velocity dispersion around 300 km/s, with a crossing time at virial radius of 1.4 Gyrs, whereas a particle with typical velocity of 400 km/s takes 75 Gyrs to reach a position 10 Mpc h−1 distant. As described above, we characterise the LSSR by means of the shape tensor as defined in equation 1. For the calculation we use particles between 2 and 15 Mpc h−1 from halo centres, with a minimum separation threshold so as to. avoid the central halo particles. In order to fix the maximum distance of this spherical shell we have considered several thresholds and finally selected the specific value that shows the stronger signal. Nevertheless we obtain similar results for the different distances considered. The principal axes are labelled with Â, B̂ and Ĉ, for the major, intermediate and minor axes, respectively. We use capital letters in order to avoid confusion with the axes â, b̂ and ĉ, which are used to characterise the intrinsic halo shapes. Given that the LSSR shape tensor represents the second moment of the matter distribution around a given halo centre, the  axis corresponds to the direction along the densest direction, whereas the Ĉ axis corresponds to the lowest density regions. As in the previous section (see equation 2), we define a triaxiality parameter for the surrounding distribution using the eigen-values of the LSSR shape tensor, P = log((C/B)/(B/A)). In the top panels of Figure 1 we show the distribution of P and C/A (dashed black lines). The cases with positive parameter, P > 0, (i.e. C/B >> B/A, and then C < B << A) correspond to structures resembling to some extent ellipsoidal prolate distributions, hereafter we shall refer to such regions simply as prolate LSSR; filamentary structures are included in this category. On.
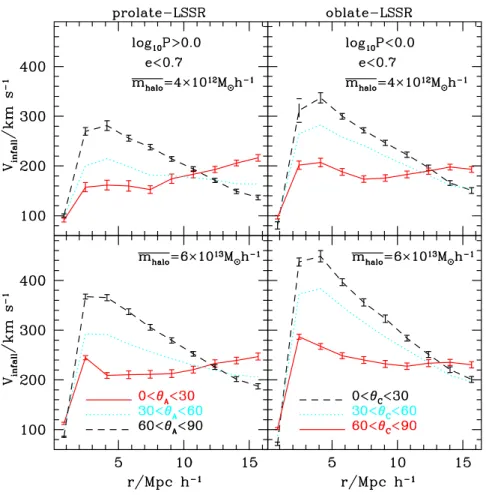
(5) Large scale anisotropies on halo infall. 5. Figure 3. Mean infall velocity as a function of distance to the central halo for different LSSR. The upper panels correspond to high mass haloes and the lower panels to low masses as is indicated in the figure. Left panels show results for prolate-LSSR and right panels for oblate-LSSR. Different colours indicate infall directions at different angles from the LSSR principal axes A and C. Red lines in the left panels indicate θA < π/6, cyan lines π/6< θA < π/3 and black lines π/3< θA < π/2. Black lines in the right panels indicate θC < π/6, cyan lines π/6< θC < π/3 and red lines π/3< θC < π/2.. the other hand, the condition P < 0 (i.e. B/A >> C/B, so C << B < A ) selects LSSR regions which resemble oblate structures. Hereafter we shall call such regions simply oblate LSSR. Structures such as pancakes or walls are examples of this class. We acknowledge that through this analysis of triaxiality parameter we cannot obtain a complete topological description of the LSSR as would be obtained, for example, using a Minkowski functional analysis. However, given the statistical scope of the current analysis, we restrict our study to regions with large ellipticities (C/A < 0.7), in order to diminish under-determinations of the corresponding characteristic axes A and C for both prolate and oblate LSSR samples. In order to assess the alignment between the LSSR distribution and the halo shapes we compute the angle θ between their major axes; the result is shown in red lines in the lower panel of Figure 1. Similarly the same panel shows the angles between the minor axis of halos and LSSR (black lines). As can be seen, the major and minor axes of the halo shape and the LSSR are highly aligned, in qualitative agreement with previous results (Colberg et al. 2005; Kasun & Evrard 2005; Basilakos et al. 2006; Allgood et al. 2006; Altay et al. 2006;. Aragón-Calvo et al. 2007; Brunino et al. 2007; Bett et al. 2007; Zhang et al. 2009). Using a similar analysis to that performed in the previous subsection we compute averages of the radial velocity field as a function of the distance to the halo centres for different directions. The direction is selected using the angle (θ) subtended by the halo-to-particle position vector with respect to the axes  or Ĉ, for prolate or oblate LSSR, respectively. The results are shown in Figure 3. Depending on the triaxiality parameter of the LSSR region, the mean velocity is computed taking into account particles with angles θ < π/6 with respect to the axis  and Ĉ, red (black) lines in left (right) panels of Figure 3. On the other hand, we also compute the mean radial velocity field in the perpendicular directions to these axes requiring π/3 < θ < π/2, black (red) lines in left (right) panels of Figure 3. Intermediate positions for both, prolate and oblate LSSR shapes, are obtained in the interval π/6 < θ < π/3 (cyan lines). The left and right panels in Figure 3 correspond to prolate and oblate LSSR regions, respectively, whereas the upper and lower panels show results for low and high mass haloes, respectively. For simplicity we only show the results corresponding to the lowest and highest mass samples. As.
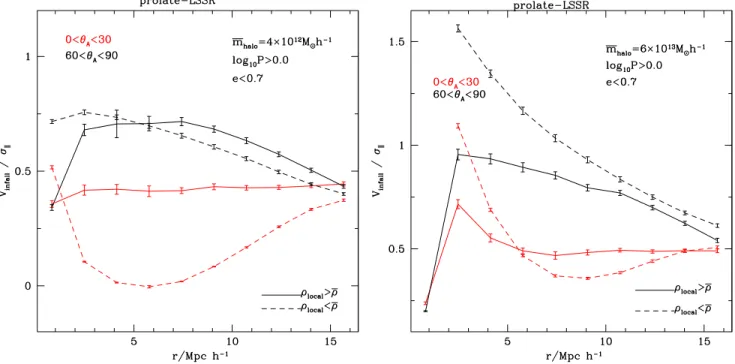
(6) 6. L. Ceccarelli et al.. can be seen in the left panels of Figure 3 (prolate environments) particles perpendicular to the major axis (black lines) exhibit noticeably higher velocities than particles parallel to this axis (red lines). A similar behavior can be seen in the right panels on Figure 3 (oblate LSSR), where particles tend to fall faster from directions parallel to the minor axis Ĉ. Both results are consistent and indicate the preference for a small velocity infall along the characteristic axis of both, oblate and prolate surrounding structure. In other words, particles show a faster infall when they come from low density regions which can be related to the direction of the smaller shape tensor eigenvalues. The mean infall velocity reaches a maximum of approximately 300 km/s and exhibits values higher than 400 km/s for the more massive haloes. As the distance from halo centre increases, the infall velocity monotonously decreases. Along the major axis direction, particles arrive slower with radial velocities that approach constant values or even increase at greater distances. 3.3. Local density and the LSSR. It is widely accepted that mass follows anisotropic streaming motions toward clusters, preferentially via the filaments (Colberg et al. 1999; Splinter et al. 1997; van Haarlem & van de Weygaert 1993b). Also, some authors claim that higher density particles exhibit higher infall velocities and coherence than particles in lower density environments (see for instance Pivato et al. 2006; González & Padilla 2009). This behaviour seems to be opposite to the correlation observed in the previous subsection, where we found larger infall velocities along the minor axes for both, haloes and the surrounding LSSR. Therefore, we now explore the dependence on the local density field of the mean radial velocities and their anisotropy. We define a local density parameter (ρ) for each particle, which measures the mass density in a sphere of radius equal to the distance to the 100th nearest neighbour, centred around the particle. We also define a mean local density ρ̄ as the average of density parameter logarithms (Log(ρ)), its value corresponds to 5 particles/M pc3 for this simulation. We separate the particles in the simulation according to their associated local density, into high and low density samples, defined by ρ > ρ̄ and ρ < ρ̄, respectively. The left panel of Figure 4 shows the mean radial velocity as a function of the distance to halo centres, for particles in low and high density regions. We also analyse the dependence of these results on the LSSR axis directions. For simplicity we only show results for prolate-LSSR. The velocity curves shown in this figure correspond to low mass central haloes (3.5 × 10¹² M⊙ h−1 < mhalo < 4.5 × 10¹² M⊙ h−1 ), solid lines represent results obtained by using particles in dense local environments (ρ > ρ̄), and dashed lines correspond to particles in underdense local regions (ρ < ρ̄). The different colours in Figure 4 correspond to different LSSR directions; red lines show the mean velocity for particles close to the major LSSR axis (θA < π/6) whereas black lines show the mean velocity for particles with π/3 < θA < π/2. By inspection of the left panel of Figure 4, it can be seen for both, parallel and perpendicular directions to the LSSR major axis (red and black lines respectively), that high den-. sity particles (solid lines) exhibit higher velocities than low density particles (dashed lines). In addition, regardless of the particle local density, lower radial velocities are obtained along directions parallel to the LSSR major axis. Therefore we recover the results obtained in the previous subsection regarding the general dependence of the radial velocity field on the LSSR. This figure also reveals a significant dependence of radial velocities on the local density confirming previous communications (Pivato et al. 2006; González & Padilla 2009). Galaxies and groups are expected to flow onto large clusters. Thus, it is interesting to study the mean radial velocity of haloes in the surroundings of the most massive systems. For the purpose of the analysis of halo dynamics we have considered similar conditions than those applied to particles. For haloes we redefine the parameter characterising the local environment; the halo local density parameter is calculated using the 100th nearest particle neighbour. We exclude particles within 3 virial radii in order to avoid the internal regions. We consider haloes in prolate LSSR regions and compute the averaged radial velocities of high and low local density haloes in preferred LSSR directions. The results are shown in the right panel of Figure 4 and consist on the radial velocity of low mass haloes (7.2×10¹¹ M⊙ h−1 < mhalo < 4.5 × 10¹² M⊙ h−1 ) in the surroundings of high mass haloes (1.9 × 10¹³ M⊙ h−1 < mhalo ). Solid (dashed) lines symbolise the infall of haloes in high (low) local densities while red and black lines correspond to haloes along, and in the direction perpendicular to, the major axis. From a general point of view we obtain radial velocities with similar characteristics than the velocity field traced by mass particles, namely, low density haloes show higher velocities than haloes in dense regions. We see an important distinction between infall of material in the different LSSR directions, where velocities along the major LSSR axis direction are larger than along the perpendicular direction. From the comparison of both panels of Figure 4 it can be seen that the most prominent difference resides on the velocity amplitudes. Halo velocities are systematically higher than for particles. This difference is mainly be due to the higher mass of the central haloes, and it is consistent with the differences detected in Figure 2. We have also explored the infall velocities around central haloes of different masses, and for different LSSR shapes, and find consistent results (including higher velocities for higher masses).. 4. VELOCITY DISPERSIONS AND LAMINARITY OF THE FLOW. In the previous sections we reported a significant dependence of the peculiar velocity field on LSSR directions and local density. Our results indicate that radial peculiar velocities deliver information on the large scale anisotropies suggesting that the velocity dispersions could also be correlated. We are now interested in analysing the coherence of motions around haloes and its relation with the infall of mass onto haloes. To do this analysis we define a laminar-.
(7) Large scale anisotropies on halo infall. 7. Figure 4. Left panel: Mean infall velocity as a function of distance for particles around low mass haloes (3.5 × 10¹² M⊙ h−1 < mhalo < 4.5 × 10¹² M⊙ h−1 ) and prolate-LSSR (C/A < 0.7 and P > 0.0) . Solid lines correspond to local densities higher the mean local density and dashed lines correspond to local densities lower than mean, as is indicated in the figure. Red lines indicate θA < π/6, whereas black lines indicate π/3< θA < π/2. Right panel: Mean radial velocity as a function of the distance for low mass haloes (7.2 × 10¹¹ M⊙ h−1 < mhalo < 4.5 × 10¹² M⊙ h−1 ) around high mass haloes (1.9 × 10¹³ M⊙ h−1 < mhalo ) and prolate-LSSR (C/A < 0.7 and P > 0.0). Lines and colours are as in the left panel.. Figure 5. Left panel: Mean laminarity parameter (the ratio between the radial velocity and the velocity dispersion in the radial direction) as a function of distance for particles around low mass haloes (3.5 × 10¹² M⊙ h−1 < mhalo < 4.5 × 10¹² M⊙ h−1 ) and prolateLSSR (C/A < 0.7 and P > 0.0). Solid lines correspond to high local densities and dashed lines to low local densities, as is indicated in the figure. Red lines correspond to θA < π/6, whereas black lines correspond to π/3< θA < π/2. Right panel: Mean laminarity parameter as a function of distance for particles around high mass haloes (mhalo < 1.9 × 10¹³ M⊙ h−1 ) and prolate-LSSR, lines and colors are as in the left panel..
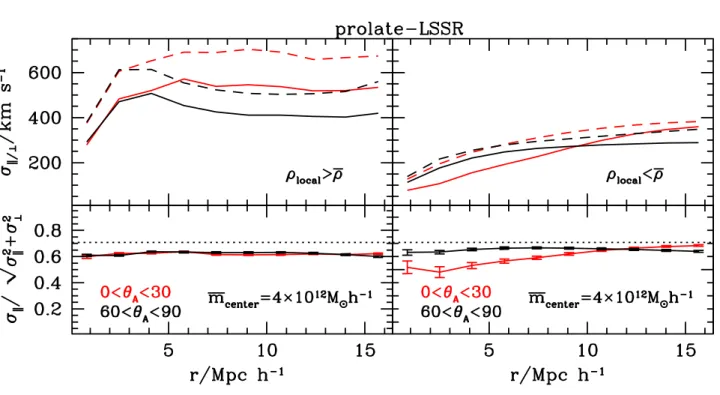
(8) 8. L. Ceccarelli et al.. Figure 6. Upper panels: Velocity dispersions as a function of distance for particles of high and low local densities (left and right panels respectively) around low mass halo centres (3.5 × 10¹² M⊙ h−1 < mhalo < 4.5 × 10¹² M⊙ h−1 ) and prolate-LSSR. Solid and dashed lines indicate radial and perpendicular velocity dispersion respectively, and red lines correspond to θA < π/6, whereas black lines correspond to π/3< θA < π/2. Low panels: Ratio between radial and total velocity dispersions as a function of distance for particles around low mass haloes and prolate-LSSR. Left (right) panels correspond q to high (low)√local densities and colours indicate position angles as in the 2 = 1/ 2 upper panels. In the low panels the dotted lines show σk / σk2 + σ⊥. ity parameter as the ratio between radial velocity and its dispersion. In order to obtain a suitable laminarity parameter we compute the local velocity dispersion for each halo using all the particles (haloes) within spherical shells. As it was described above we consider separately the angle subtended by the direction to a particle or halo and the principal axes of the LSSR. We also take into account the local density. In Figures 5 and 7 we show the laminarity parameter as a function of the distance to the central halo, for mass particles and small haloes respectively. We only show the results obtained for central haloes in a prolate LSSR. In Figure 5 we select low and high mass central haloes (left and right panels respectively), whereas in Figure 7 we show velocities of low mass haloes around massive haloes. As can be seen in the left panel of Figure 5, along perpendicular directions to the LSSR major axis (black lines) particles in either high or low local densities (solid and dashed lines) present similar laminarity parameters. In the case of particles along the direction parallel to the LSSR major axis (red lines), high density particles (solid lines) show higher laminarity parameters than those at low local densities (dashed lines). We also obtain similar results using halo velocities instead of particles (Figure 7). When considering. particle velocities around high mass haloes (right panel of Figure 5), it can be noticed that along directions perpendicular to the LSSR major axis (black lines) low density particles (dashed lines) show higher laminarity parameters than those at high local densities (solid lines). From these results we can infer that the flow along the different directions becomes more laminar (i.e. v/σ > 1) closer to the halo centre. This effect is significantly more pronounced for infalling clumps than for infalling individual particles. This laminarity is also larger along the plane perpendicular to the LSSR major axis indicating that, besides the fact that this direction shows the largest infall, it is also the less turbulent; the material is more smoothly accreted. The implications of this behaviour for halo structure could reside in the dynamical memory of the systems of this quasi stationary process which acts on time-scales of halo formation. We also explore possible differences of the peculiar velocity field along the directions parallel and perpendicular to the halo-centric direction. In order to analyse this we calculate the 1-D velocity dispersion of galaxies in both the σk and, σ⊥ directions, respectively, on the frame of the mean infall stream. Our results are shown in Figures 6 and 8, where we plot the velocity dispersions (top panels) and the.
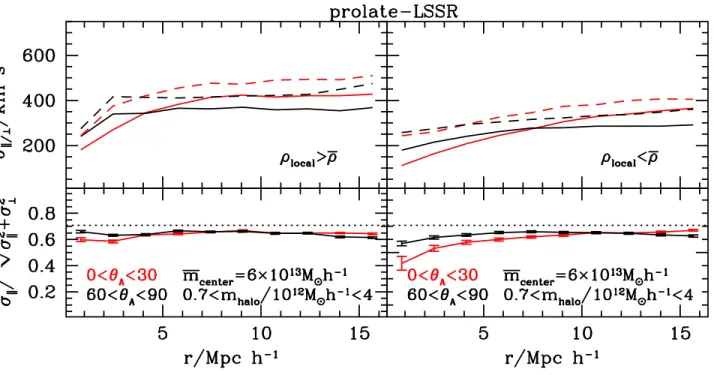
(9) Large scale anisotropies on halo infall. 9. Figure 8. Upper panels: Velocity dispersions as a function of distance for low mass haloes (0.7 × 10¹² M⊙ h−1 < mhalo < 4.5 × 10¹² M⊙ h−1 ) of high and low local densities (left and right panels respectively) around high mass halo centres (mhalo < 1.9×10¹³ M⊙ h−1 ) and prolate-LSSR. Solid and dashed lines indicate radial and perpendicular velocity dispersion respectively, and red lines correspond to θA < π/6, whereas black lines correspond to π/3< θA < π/2. Low panels: Ratio between radial and total velocity dispersions as a function of distance for low mass haloes around high mass haloes and prolate-LSSR. The left (right) panel corresponds q to high (low) √ 2 = 1/ 2. local densities and colours indicate position angles as in the high panels. In the low panels the dotted lines show σk / σk2 + σ⊥. ratio between radial and total velocity dispersions (hereafter the relative dispersion, bottom panels) as a function of distance, for both particles and haloes. Different colours indicate the position relative to the major axis (red lines for particles/haloes along the major axis and black lines for the perpendicular directions). Left and right panels correspond to high and low local densities, respectively. Different lines in the top panels indicate radial and perpendicular velocity dispersions (solid and dashed lines respectively). For comparison, the expectedq value for the relative dispersion in an √ 2 isotropic case is σk / σk2 + σ⊥ = 1/ 2, and is shown as horizontal dotted lines in the bottom panels. As can be seen from the top panels of Figures 6 and 8 the dispersion of radial velocities (solid lines) is smaller than that of velocities along the perpendicular direction (dashed lines). This behaviour can also be seen from bottom panels of Figures √ 6 and 8 where the relative dispersion is lower than 1/ 2, regardless of the local density, LSSR shape and distance to the central halo. We find this behavior out to distances as large as 15 Mpc, indicating that the radial infall dominates over random motions. From the top panels of Figures 6 and 8 it can be seen that the velocity dispersion for high local densities (left panels) is higher than for low local densities (right panels), this. behaviour is stronger for particle velocities (Figure 6). With respect to the LSSR principal axis, the velocity dispersion along the mayor axis (red lines) is higher than in its perpendicular direction (black lines) for high local densities at distances larger than 5 Mpc h−1 (left top panels of Figures 6 and 8). In general, the velocity dispersion tends to decrease towards smaller distances from the central halo. The lower panels of Figures 6 and 8, which correspond to low local densities, show that the relative dispersion along the major axis decreases as the distance to the central halo decreases. At smaller distances from the central halo (r < 10 Mpc h−1 ) the relative dispersion along the major axis (red lines) is smaller than along the perpendicular direction (black lines), whereas at larger distances (r < 13 Mpc h−1 ) we find the opposite behaviour. We note that the dependence of the relative dispersion on the direction with respect to the LSSR major axis tends to be smaller as the distance increases (as expected due to the tendency towards homogeneity of the LSSR). The relative dispersion for high local densities (left bottom panels of Figures 6 and 8) shows similar behaviours for the different LSSR directions and, as it can be seen, there is little dependence on the distance to the central halo with a q roughly constant value σk /. 2 σk2 + σ⊥ = 0.6. We do not de-.
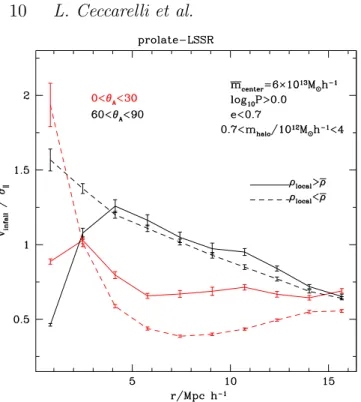
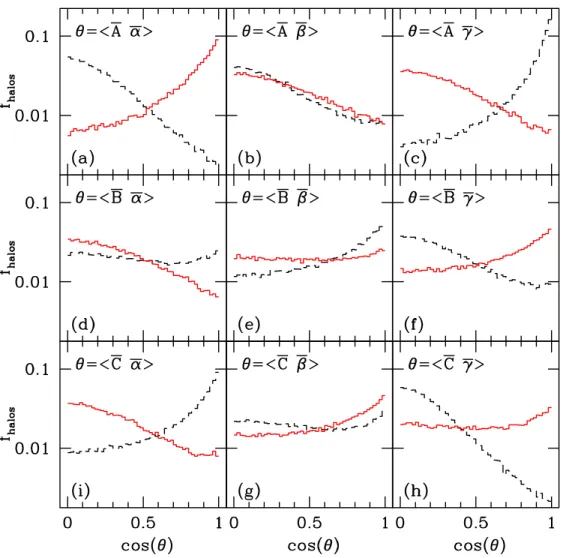
(10) 10. L. Ceccarelli et al.. Figure 7. Mean laminarity parameter as a function of distance for low mass haloes (7.2 × 10¹¹ M⊙ h−1 < mhalo < 4.5 × 10¹² M⊙ h−1 ) around high mass haloes (1.9 × 10¹³ M⊙ h−1 < mhalo ) and prolate-LSSR (C/A < 0.7 and P > 0.0). Red lines indicate θA < π/6, whereas black lines indicate π/3< θA < π/2. The two pairs of solid and dashed lines correspond to high and low local densities as is indicated in the figure.. tect a strong dependence of the relative dispersion on local density and LSSR. A more detailed analysis shows a slight tendency of the relative dispersion to be smaller along the radial than the perpendicular direction, for both, particles and haloes, as is seen in the right bottom panels of Figures 6 and 8.. 5. INFALL AND OUTFLOW. In this section we provide further statistical properties of matter infall to, and outflow from haloes. For this aim we have considered separately particles with negative (infalling) and positive (outflowing) radial velocity components. Therefore, these two groups of particles consist in local diverging and converging flows onto the halos. Velocity moments for each group of converging or diverging particles are obtained in a similar way as the one used to obtain the shape tensor (Equation 1), using the components of the peculiar velocity vector of each particle relative to the centre of mass velocity of the surrounding LSSR (within a sphere of 15 Mpc h−1 from the halo centres) instead of the position vector. Then, for each group of particles we obtain a triaxial ellipsoid that approximates the velocity distribution. The corresponding major, intermediate and minor principal velocity axes are referred to as α, β and γ. We analyse the orientation of these two velocity ellipsoids (for infalling and outfalling particles), with respect to the principal axes of the surrounding structure. As in previous sections, we refer to these spatial axes as A, B and C, for the major, intermediate. and minor axes, respectively. We compute the angles subtended by the principal axes of shape and velocity ellipsoids and summarise our results in Figure 9. This figure shows the distributions of the cosine of the angles between LSSR and velocity axes, for converging (black lines) and diverging particles (red lines). Each panel in this figure corresponds to a different pair of axes, the three upper panels correspond to angles between the LSSR major axis and the velocity major, intermediate and minor axes (panels a, b and c, respectively). Similarly, the three middle panels correspond to the LSSR intermediate axis and the three lower panels for the LSSR minor axis, as indicated in the figure. As can be seen in the left upper panel of this figure, the major LSSR and velocity axis tend to be perpendicular for converging particles (black lines in panel (a)), and parallel for diverging particles (red lines in panel (a)). The right upper panel of this figure shows that the major LSSR axis tends to be aligned with the minor velocity axis for converging particles (black lines in panel (c)) whereas for diverging particles they tend to be perpendicular (red lines in panel(c)). Regarding the angles between the LSSR major axis and the velocity intermediate axis there are no significant differences between converging and diverging particles (black and red lines in panel (b)). By inspection of the lower panels of this figure, which correspond to the angles between the LSSR minor axis and the velocity ellipsoid, it can be seen, consistent with the results in the upper panels, that the minor LSSR axis and the major velocity axis are aligned for converging particles and perpendicular for diverging particles (black and red lines in panel (i)). The main results shown in Figure 9 indicate that LSSR major axes tend to be parallel to major (minor) velocity axes for diverging (converging) particles. The alignment signals for the converging flow is consistent with the results derived in the previous sections, namely a preference for larger amplitudes of the infalling velocity field along directions perpendicular to the principal axes of the surrounding structure. Regarding the outflowing velocity particles we notice the opposite behaviour, the largest amplitude occurs along the LSSR major axis direction. Thus, in part, the reduced mean infall along the LSSR major axis could be caused by the preference of outflowing particles along this direction. We can interpret this trend as generated by particles expelled from the virialised structures, which could occur more easily along the major axis where the gravitational potential shows a more gentle decrease than along the minor axis direction. Thus, a possible implication of our results would be the presence of galaxies that passed close to the halo centres and are outflowing along the surrounding filamentary and planar structures.. 6. CONCLUSIONS. Using a numerical simulation we have performed a detailed analysis of the peculiar velocity field around dark matter haloes. We have explored the relation between the flows of mass towards haloes and the shapes of the central haloes, their large-scale surrounding region (LSSR) shape, and their orientation. We found a significant anisotropy in the velocity field.
(11) Large scale anisotropies on halo infall. 11. Figure 9. Histograms showing the vectorial products between principal axes derived from the infall velocity tensor and the LSSR for particles (dashed black lines). Each panel represents the angle between different pairs of vectors as is indicated in the corresponding panel in the figure. A, B, and C represent the major, intermediate and minor axes of the LSSR, respectively. α, β and γ represent the major, intermediate and minor axes of the infall velocity ellipsoid, respectively. The corresponding histograms derived from the outflow velocity tensor and the LSSR are shown as solid red lines.. which correlates with the surrounding LSSR principal axes. The amplitude of the velocity field of infalling particles onto dark matter haloes is maximum along the direction of underdense surrounding regions (LSSR minor axis), whereas along the direction of dense LSSR regions, it exhibits the smallest velocities. With respect to the shape ellipsoid of the central haloes, we found that the amplitude of the infall velocity field along the halo minor axis is larger than that along the major axis. We find consistent results for general triaxial haloes, and for both prolate and oblate systems. Therefore, there is a clear preference for matter to infall towards haloes along regions of low “global” density. When looking at the dependence with local density, either measured in cubic cells in the simulation volume for individual particles, or using the 100th closest particle neighbour outside 3 virial radii for tracer haloes, we find that objects in local high density regions infall faster. By defining a suitable laminarity parameter we find that. the velocity field is less turbulent along the direction towards underdense surrounding regions, with a ratio between mean flow velocity and velocity dispersion of order unity and nearly constant up to scales of 15 Mpc h−1 . The flow of particles moving away from haloes are found to be highly anisotropic. The major axis of the outflowing velocity field is aligned with the surrounding LSSR major axis.. ACKNOWLEDGMENTS This work has been partially supported by Consejo de Investigaciones Cientı́ficas y Técnicas de la República Argentina (CONICET), the Secretarı́a de Ciencia y Técnica de la Universidad Nacional de Córdoba (SeCyT)..
(12) 12. L. Ceccarelli et al.. REFERENCES Allgood B., Flores R. A., Primack J. R., Kravtsov A. V., Wechsler R. H., Faltenbacher A., Bullock J. S., 2006, MNRAS, 367, 1781 Altay G., Colberg J. M., Croft R. A. C., 2006, MNRAS, 370, 1422 Aragón-Calvo M. A., van de Weygaert R., Jones B. J. T., van der Hulst J. M., 2007, ApJL, 655, L5 Basilakos S., Plionis M., Yepes G., Gottlöber S., Turchaninov V., 2006, MNRAS, 365, 539 Bertschinger E., 2001, ApJS, 137, 1 Bett P., Eke V., Frenk C. S., Jenkins A., Helly J., Navarro J., 2007, MNRAS, 376, 215 Brunino R., Trujillo I., Pearce F. R., Thomas P. A., 2007, MNRAS, 375, 184 Ceccarelli M. L., Valotto C., Lambas D. G., Padilla N., Giovanelli R., Haynes M., 2005, ApJ, 622, 853 Colberg J. M., Krughoff K. S., Connolly A. J., 2005, MNRAS, 359, 272 Colberg J. M., White S. D. M., Jenkins A., Pearce F. R., 1999, MNRAS, 308, 593 Croft R. A. C., Dalton G. B., Efstathiou G., 1999, MNRAS, 305, 547 Croton D. J., Gaztañaga E., Baugh C. M., Norberg P., Colless M., Baldry I. K., Bland-Hawthorn J., Bridges T., Cannon R., Cole S., Collins C., Sutherland W., Taylor K., 2004, MNRAS, 352, 1232 Diaferio A., Geller M. J., 1997, ApJ, 481, 633 Faltenbacher A., Gottlöber S., Kerscher M., Müller V., 2002, A&A, 395, 1 González R. E., Padilla N. D., 2009, MNRAS, 397, 1498 González R. E., Padilla N. D., 2010, MNRAS, pp 1071–+ Hopkins P. F., Bahcall N. A., Bode P., 2005, ApJ, 618, 1 Kasun S. F., Evrard A. E., 2005, ApJ, 629, 781 Kitzbichler M. G., Saurer W., 2003, ApJL, 590, L9 Lau E. T., Nagai D., Kravtsov A. V., Zentner A. R., 2010, ArXiv e-prints Ma C., Bertschinger E., 1995, ApJ, 455, 7 Padilla N. D., Baugh C. M., 2003, MNRAS, 343, 796 Paz D. J., Lambas D. G., Padilla N., Merchán M., 2006, MNRAS, 366, 1503 Paz D. J., Stasyszyn F., Padilla N. D., 2008, MNRAS, 389, 1127 Pivato M. C., Padilla N. D., Lambas D. G., 2006, MNRAS, 373, 1409 Plionis M., Basilakos S., 2002, MNRAS, 329, L47 Power C., Navarro J. F., Jenkins A., Frenk C. S., White S. D. M., Springel V., Stadel J., Quinn T., 2003, MNRAS, 338, 14 Splinter R. J., Melott A. L., Linn A. M., Buck C., Tinker J., 1997, ApJ, 479, 632 Springel V., 2005, MNRAS, 364, 1105 Thomas P. A., Colberg J. M., Couchman H. M. P., Efstathiou G. P., Frenk C. S., Jenkins A. R., Nelson A. H., Hutchings R. M., Peacock J. A., Pearce F. R., White S. D. M., 1998, MNRAS, 296, 1061 van Haarlem M., van de Weygaert R., 1993a, ApJ, 418, 544 van Haarlem M., van de Weygaert R., 1993b, ApJ, 418, 544 Warren M. S., Quinn P. J., Salmon J. K., Zurek W. H., 1992, ApJ, 399, 405 West M. J., 1994, MNRAS, 268, 79. Zhang Y., Yang X., Faltenbacher A., Springel V., Lin W., Wang H., 2009, ApJ, 706, 747.
(13)
Figure
+5
Documento similar
Then, the problem is modified to meet the adverse conditions for which the source terms become stiffer: very low initial pressure, high particle concentration and high density of
In Figure 4.16 A) the interior of a pyrolyzed pineapple with 10% sat. of FeCl 3 on acetone can be observed, along with a histogram representing the diameter of the analyzed particles
but no common halo able to reproduce simultaneously the properties of red and blue GCs velocities of some blue GCs require very large apogalactic distances – recent
The basic quantities that we need to know to asses whether or not these outflows can have an impact on the host galaxy properties are: velocities, mass, mass outflow rate, energy
Paper I: The clustering of galaxies in the SDSS-III Baryon Oscillation Spectroscopic Survey: modelling the clustering and halo occupation distribution of BOSS CMASS galaxies in
The lists of (bound) particles are used to calculate canon- ical properties of haloes (subhaloes), like the position of the halo centre, which is given by the centre of mass of all
It combines 2 nd -order Lagrangian Perturbation Theory (2LPT) to generate the large-scale dis- tribution, statistical sampling of a theoretical mass function to generate halo
Our previous results on the Higgs mass corrections show that the corrections to the lightest Higgs mass ∆m h are negative in many of the studied cases and can be very large for
