Quantification of the effect of both technical
and non-technical measures from road
transport on Spain’s emissions projections
José M. López
1, Julio Lumbreras
2, Alberto Guijarro
2, Encarnación
Rodriguez
21
University Institute of Automobile Research (Instituto de Investigación del Automóvil- INSIA), Carretera de Valencia, km.7. 28031 - MADRID. Madrid, Spain
2
Department of Chemical & Environmental Engineering. Technical University of Madrid (UPM), José Gutiérrez Abascal, 2. 28006. Madrid, Spain
Abstract
Atmospheric emissions from road transport have increased all around the world since 1990 more rapidly than from other pollution sources. Moreover, they contribute to more than 25% of total emissions in the majority of the European Countries. This situation confirms the importance of road transport when complying with emission ceilings (e.g. Kyoto Protocol and National Emissions Ceilings Directive).
A methodology has been developed to evaluate the effect of transport measures on atmospheric emissions (EmiTRANS). Its application to Spain in the horizon of 2020 allows the quantification of the effect of several measures on emission reductions.
This quantification was done through scenario development. Several scenarios were calculated considering technical measures (e.g. vehicle scrapping systems, higher penetration of hybrid and electric vehicles, fuel substitution, etc.) and non-technical measures (mileage reduction, implementation of Low Emission Zones and/or Congestion Charges in main cities, reduction of average speeds, logistical improvements that affects heavy duty vehicle load factors,
etc.). The scenarios show the effect of each measure on NOx, SO2, CO, PM10,
combine both technical and non-technical measures to increase global effectiveness. In the analysis of specific pollutants, there is a great dispersion on reductions effect: technical measures are more effective to reduce air pollutants while non-technical measures are better options to reduce greenhouse effect gases (even though they also reduce air pollutants in a less efficient way).
Keywords: Emissions, road transport, air quality, green house gases, methodology, Policies and Measures
1
Introduction
In recent years the growing traffic demand combined with an increase in exhaust gas emissions is the main reason for permanent deterioration of air quality in
urban areas (Lim et al [1], Colvile et al [2]). In order to reduce emissions, we
need to gain precise information about emission behaviour of motor vehicles. Vehicle exhaust emissions have been cause of much concern regarding the
effects of urban air pollution on human health (Curtis et al [3]) and green house
gases (GHG) emissions.
The International Energy Agency’s (IEA’s) World Energy Outlook Reference
Case projects that between 2000 and 2030, transport energy use and CO2
emissions in OECD countries will increase by 50%, despite recent and ongoing policy initiatives intended to dampen this growth.
As an example, CO2 emissions from road transport in Spain have increased in
an 80% during the period 1990-2005 (fig.1). This percentage is higher than the
increase in the number of vehicles in the same period. SO2 emissions show a
sharp decline due to reduction in sulphur content of fuels. Nevertheless, N2O
emissions suffered a strong increase but the amount, in terms of CO2 equivalent,
is significantly lower than CO2 emissions from road transport. CO and VOC
experimented a significant reduction, about 55%. NOx emissions were stabilized
while PM2.5 have only increased a 25%.
In order to facilitate the analysis of this situation, environmental protection authorities are interested in performing emission and air pollution simulation as well as scenario analysis by means of model based simulation systems
(Winiwarter et al [4]). Traffic flow models provide a promising approach
(Schmidt et al [5], Xia et al [6]), including calculations of air pollutant emissions
from all transport sectors (Symeomidis et al [7]).
This paper presents a methodology to estimate atmospheric emissions from road transport including the development of a tailored software tool. Pollutants
considered are those related to current air quality problems in urban areas (SO2,
NMVOC, NOX and PM) while N2O and CO2 as GHG.
2
Methodology
developed [8], most of which are included in the EMEP/CORINAIR methodology [9].
Then, we have developed a software tool called EmiTRANS, which allows the inclusion of technical and non-technical measures leaded to quantity their influence in emissions reduction.
0 50 100 150 200 250 300 350
1990 1991 1992 1993 1994 1995 1996 1997 1998 1999 2000 2001 2002 2003 2004 2005
year
1
9
9
0
e
m
is
s
io
n
s
=
1
0
0
Vehicles CO NMVOC NOX PM2,5 CO2 SO2 N2O
Figure 1: Historic trend of Spanish road transport emissions vs. number of vehicles
The purpose of this tool is to obtain emissions from developed scenarios
through Copert4 software (Gkatzoflias et al [10]) and other outputs that are
useful to get conclusions.
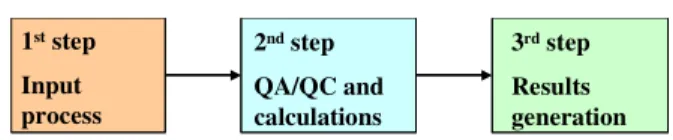
We have also applied EmiTRANS to the case of Spain. This application consists of three blocks, as indicated in fig.2.
• The first block includes input data. These are divided into six different
sectors: passenger cars, light duty vehicles, buses, heavy duty vehicles, mopeds and motorcycles.
• In the second block, implicit variables (those that are not directly used
by Copert4, e.g. mileage in units of passenger-km, occupancy rate, load factor, etc.) are transformed into explicit variables (e.g. mileage in veh-km). Afterwards, Quality Assurance/Quality Control (QA/QC) procedures are used (e.g. check that the sum of % is equal to 100, contrast if parameters are in previously assigned range, etc.). Eventually, developed algorithms are applied to obtain outputs.
• In the third block, results are generated according to Copert4
1ststep
Input process 1ststep
Input process
2ndstep
QA/QC and calculations 2ndstep
QA/QC and calculations
3rdstep
Results generation 3rdstep
Results generation Figure 2: Blocks for running EmiTRANS.
3
Sensitivity analysis
The method has been applied to Spain, carrying out a sensitivity analysis of the factors and using the EmiTRANS tool to develop different scenarios for Spanish road transport emission up to 2020. In order to compare the variation results of the different factors, emissions have been calculated for the road transport sector, no matter the scope of the factor modified (type of vehicle, driving modes, etc.). The sensitivity analysis has been done according to the changes included in table 1 to identify the influence of several factors in atmospheric emissions.
Table 1: Selection of factors that influence on the emissions
Factor Sensitivity analyses
Reference: 46.6% petrol, 53,4% diesel 30% petrol, 70% diesel
40% petrol, 60% diesel 60% petrol, 40% diesel Fuel distribution for
vehicles
70% petrol, 30% diesel Reference: 25 km/h 20 km/h
22.5 km/h 27.5 km/h Urban average speed
30 km/h
Reference: 105 km/h 84 km/h
94.5 km/h 115.5 km/h Highway average
speed
126 km/h
Reference: vehicles with engine cylinder>2 l are 6.2% for petrol and 14.2% for diesel Number of large vehicles are tripled Number of large vehicles are doubled Number of large vehicles are divided by 2 % of large vehicles
There are no large vehicles
Reference: 5,375 M vehicles (26.5 %) 20% substitution by Euro 5 vehicles 40% substitution by Euro 5 vehicles 60% substitution by Euro 5 vehicles Number of old
passenger cars
80% substitution by Euro 5 vehicles
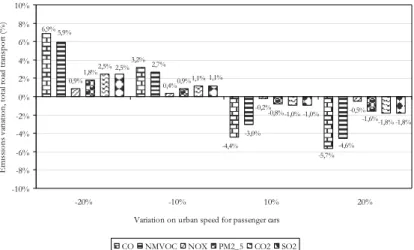
inefficient combustion process mainly in spark engines (volumetric efficient has
a high influence in urban driving). CO2 emissions decreased when incrementing
the speed due to open throttle condition.
Fig. 4 shows the influence on road transport emissions due to slight variations on highway speed for passenger cars. At the range of reference speed (105
km/h), positive variations increase emissions. For instance, CO2 emissions
experiment a 5% raise when average speed is incremented in a 20%. These results are the consequence of the increasing rolling and drag resistance with the speed. Concerning CO emissions, the enrichment of the mixture at higher speeds causes its large augmentation.
0,9% 0,4% -0,2% -0,5% 1,8% 0,9% 2,5% 1,1% -1,0% -1,8% -5,7% -4,4% 3,2% 6,9% -4,6% -3,0% 2,7% 5,9% -1,6% -0,8% 2,5% 1,1% -1,8% -1,0% -10% -8% -6% -4% -2% 0% 2% 4% 6% 8% 10%
-20% -10% 10% 20%
Variation on urban speed for passenger cars
E m is si o n s v ar ia ti o n , to ta l ro ad t ra n sp o rt ( % )
CO NMVOC NOX PM2_5 CO2 SO2
Figure 3: Sensitivity analysis to changes in urban speed. Ref. speed: 25 km/h
-4,6%
-2,5%
3,2%
6,4%
-2,7%-2,4% -1,9%
-1,5% 2,2% 5,2% 11,4% 3,9% -1,9% -2,1% 1,7% 0,5% 0,2% 1,0% 5,4% 2,4% -2,4% -1,5% 5,2% 2,2% -10% -5% 0% 5% 10% 15%
-20% -10% +10% +20%
Variation on highway speed for passenger cars
E m is si o n s v ar ia ti o n , to ta l ro ad t ra n sp o rt ( % )
CO NMVOC NOx PM2,5 CO2 SO2
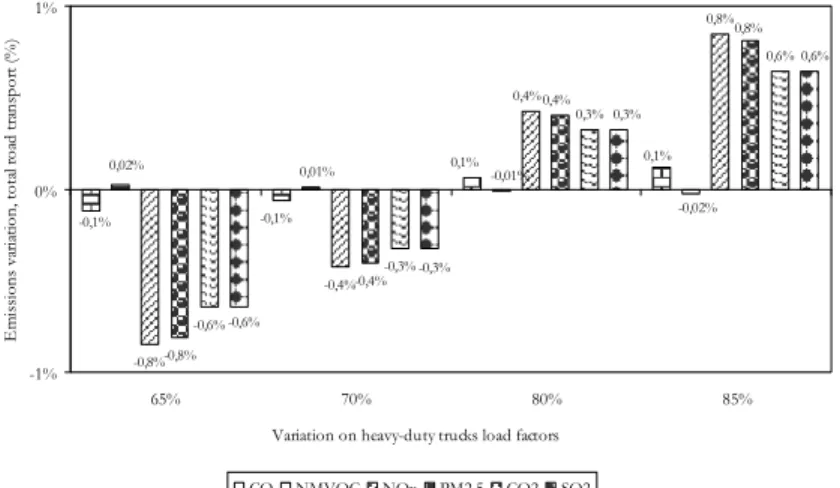
Fig. 5 shows the influence of the load in heavy-duty vehicles on road transport emissions. In this case, mileage per vehicle has been assumed constant for all scenarios; therefore, the amount of tonnes-km of each scenario is different.
Considering these hypothesis, NOx and PM2.5 emissions increase with the load
due to higher torque and fuel injection. CO2 emissions show a growth of 0.6%
when the load achieved 85%. CO and NMVOC are not relevant in diesel engines. -0,8% -0,4% 0,8% -0,8% -0,4% -0,6% -0,3% 0,3% 0,6% 0,1% 0,1% -0,1% -0,1% -0,02% -0,01% 0,01% 0,02% 0,4% 0,8% 0,4% -0,6% -0,3% 0,6% 0,3% -1% 0% 1%
65% 70% 80% 85%
Variation on heavy-duty trucks load factors
E m is si o n s v ar ia ti o n , to ta l ro ad t ra n sp o rt ( % )
CO NMVOC NOx PM2,5 CO2 SO2
Figure 5: Sensitivity analysis to changes in heavy-duty vehicles load (constant mileage). Ref. load range: 75%
-4,7% -9,3% -14,0% -18,7% -2,1% -4,2% -6,3% -8,3% -0,1% -0,2% -0,4% -0,5% -11,4% -22,8% -34,1% -45,5% -11,4% -22,9% -34,3% -45,7% -0,4% -0,5% -0,2% -0,1% -50% -45% -40% -35% -30% -25% -20% -15% -10% -5% 0% 5%
20% 40% 60% 80%
Variation on pre-EURO passenger cars substitution by EURO5 vehicles
E m is si o n s v ar ia ti o n , to ta l ro ad t ra n sp o rt ( % )
CO NMVOC NOx PM2,5 CO2 SO2
Figure 6: Sensitivity analysis to old vehicles substitution by Euro 5. Ref. case: 26% pre-Euro of passenger car park
catalysers decline CO, NMVOC and NOx emissions up to 95% in spark engines.
Nevertheless, PM2.5 emissions are more difficult to reduce in diesel engines. CO2
emissions remain almost constant when replacing old vehicles because emission
standards did include neither CO2 limits nor efficiency improvements.
Fig. 7 evidences the proportionality of road transport pollutant emission to mobility variations. Higher mobility of diesel cars is more important to increase
NOx and PM2.5 in the sector. CO2 emissions experiment an increment of 6.8%
when increasing the mobility a 20%.
-5,5%
-2,7%
2,7%
5,5%
-8,6%
-4,3%
4,3%
8,6%
-6,8%
-3,4%
3,4%
6,8%
4,0% 2,0%
-2,0% -4,0%
4,4%
2,2%
-2,2%
-4,4%
-6,8%
-3,4%
6,8%
3,4%
-10% -8% -6% -4% -2% 0% 2% 4% 6% 8% 10%
-20% -10% +10% +20%
Variation on urban passenger cars mileage
E
m
is
si
o
n
s
v
ar
ia
ti
o
n
,
to
ta
l
ro
ad
t
ra
n
sp
o
rt
(
%
)
CO NMVOC NOx PM2,5 CO2 SO2
Figure 7: Sensitivity analysis for changes in mobility for passenger cars in urban areas. Baseline: 1070 km/year for gasoline cars and 7954 km/year for diesel cars.
4
Emission scenarios results
Regarding emission projections, the main assumptions for each of the five scenarios are shown in table 2. These assumptions were used to calculate emission projections using EmiTRANS model and Copert4 software as presented in section 2.
Business as Usual (BAU) scenario was defined under the hypothesis of high passenger and freight mobility, non-presence of biofuels and new technologies. The rest scenarios present several improvements related to mobility, penetration of new technologies or biofuel use.
Baseline scenario presents a moderated increment of mobility and includes the effect of Policies and Measures planned by the Spanish Administration. Besides, includes more environmental friendly technologies such as hybrid vehicles, electric vehicles and hydrogen or natural gas vehicles.
Table 2: Selection of factors that influence in the emissions
Scenario Mobility Technology in 2020 Power Biofuels
Business as usual
+4% PC
+6% HDV Same as baseline Same as baseline
Same as baseline
Baseline
+3.6-0.5% PC
+5.1-0.2% HDV
1.4% Electric/H2
3.2% Hybrid 16% NG urban buses
Petrol: 41%<1,4l; 52% ∈ (1,4l-2l); 7%>2l
Diesel: 86%<2l; 14% >2l
2010: 5.83% 2012: 8% 2016-2020: 10%
Technological Same as baseline
10% Electric/H2
20% Hybrid 50% NG urb. buses
Same as baseline Same as baseline
Lower mobility
No mobility
increase Same as baseline Same as baseline
Same as baseline
Biofuel promotion
Same as
baseline Same as baseline Same as baseline
2010: 6.88% 2012: 9.5% 2020: 20% PC: Passenger Cars. HDV: Heavy Duty Vehicles.
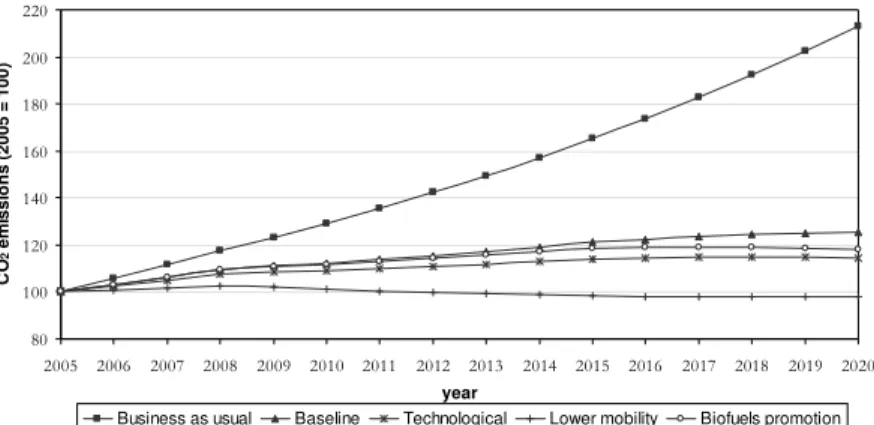
Fig. 8 displays the results for CO2 emissions. The largest emissions
correspond to the BAU scenario. It does not include any technological measure and the passenger and freight mobility evolve as they did in the past (from 1990-2005). The lowest emissions scenario is the “lower mobility”. This remarks that
the most effective measure to reduce CO2 emissions is mobility cutback. The
other scenarios project similar emissions: baseline has higher emissions but not far away from the promotion of biofuels and higher technology penetration. That is, in 2020 emissions under baseline scenario are 25% higher than in 2005 while “technological” and “Biofuel promotion” scenarios only increase a 14 and 18%, respectively.
80 100 120 140 160 180 200 220
2005 2006 2007 2008 2009 2010 2011 2012 2013 2014 2015 2016 2017 2018 2019 2020
year
C
O
2
e
m
is
s
io
n
s
(
2
0
0
5
=
1
0
0
)
Business as usual Baseline Technological Lower mobility Biofuels promotion
Figure 8: CO2 emission projections for road transport in Spain
Emission projections for NOx and PM2.5 are shown in fig. 9 y 10. Every
and biofuels yield relevant emission reductions respect to BAU scenario. In
2020, these reductions would be of 54.5% and 41.2% for NOx and PM2.5,
respectively. The most advantageous scenarios for emission decline, under the assumed hypotheses, are the “lower mobility” followed by “new technologies”.
30 40 50 60 70 80 90 100 110
2005 2006 2007 2008 2009 2010 2011 2012 2013 2014 2015 2016 2017 2018 2019 2020
year
N
O
x
e
m
is
s
io
n
s
(
2
0
0
5
=
1
0
0
)
Business as usual Baseline Technological Lower mobility
Figure 9: NOx emission projections for road transport in Spain
10 20 30 40 50 60 70 80 90 100
2005 2006 2007 2008 2009 2010 2011 2012 2013 2014 2015 2016 2017 2018 2019 2020
year
P
M2
,5
e
m
is
s
io
n
s
(
2
0
0
5
=
1
0
0
)
Business as usual Baseline Technological Lower mobility
Figure 10: PM2.5 emission projections for road transport in Spain
5
Conclusions.
(technical and non-technical measures) show clear trends on emissions pollutant. Furthermore, the model is a valuable tool for environmental planning and for the delineation of rational strategy towards the reduction of the atmospheric pollution levels.
This methodology also allows the development of different emission scenarios for future years. The application to Spain for the period 2006-2020 shows that
the most effective measures to abate CO2 emissions are those aimed to reduce
passenger and freight mobility while vehicle scrapping systems are also effective to reduce air pollution.
References
[1] Lim, L., Hughes, S. Hellawell, E., Integrated decision support for urban air
quality assessment. Environmental Modelling & Software 20 (2005)
947-954, 2005.
[2] Colvile, R.N., Hutchinson, E.J., Warrenl, R.F., The transport sector as a
source of air pollution (Chapter 6). Developments in Environmental
Sciences, Volume 1, pp 187-239, 2002.
[3] Curtis, L., Rea, W., Smith-Willis, P., Fenyves, E., Pan, Y., Adverse health
effects of outdoor air pollutants. Environment International 32, 815–830,
2006.
[4] Winiwarter, W., Sscmidt, G., Environmental software system for emission
inventories. Environmental Modelling & Software 20 (2005) 1469-1477,
2005.
[5] Schmidt, M., Schäfer, R., An interated simulation system for traffic induced
air pollution. Environmental Modelling & Software 13(1998) 295-303, 1998.
[6] Xia, L., Shao, Y., Modelling of traffic flow and air pollution emission with
application to Hong Kong Island. Environmental Modelling & Software 20
(2005) 1175-118, 2005.
[7] Symeonidis, P., Ziomas, I., Proyou, A., Development of an emission
inventory system from transport in Greece. Environmental Modelling &
Software 19(2004) 413-421, 2004.
[8] Lumbreras, J., Guijarro, A., Lopez, J.M., Rodríguez, E., 2008. Methodology
to quantify the effect of policies and measures in emission reductions from road transport. Urban Transport Conference. Wessex Institute of
Technology.
[9] European Environment Agency, EMEP/CORINAIR Emission Inventory
Guidebook. 2007 update of the third edition. 2007.
[10] Gkatzoflias, D., Kouridis, CH., Ntziachristos, L., Samaras, Z., COPERT 4.