Applications of sources reconstruction techniques:
theory and practical results
Francisco Cano
(1),
Manuel Sierra-Castañer
(1), Sara Burgos
(1), José Luís Besada
(1) (1) Radiation Group; Signal, Systems and Radiocommunications DepartmentTechnical University of Madrid. Ciudad Universitaria. 28040. Madrid [email protected]
Abstract— In this paper, four new applications of sources reconstruction techniques (also called diagnostic techniques) are presented. First of all, the important information of such techniques will be mentioned, seeing that they are a tool to obtain the extremely near field from the measured data. Depending on the region where these data are taken (near field or far field), the reconstruction method will be different. Also, all of them may be classified in other two groups depending on its features: Integral Equation Methods (IEM) or Modal Expansion Methods. Classical applications of such techniques are errors detection, like phase errors in arrays or conformal errors in reflectors, therefore, they constitute an important antenna design tool. But also and it has been said, they can be used as the basis to other applications whose aim is to improve the measurement results in anechoic chambers or non anechoic environments. Here, four of them are presented, being the reflection cancelling, the detection of unwanted radiation points, the truncation error reduction in planar or cylindrical near-field and the noise reduction.
Keywords: Diagnostic technique, integral equation method, modal expansion method, spatial filtering, plane wave spectrum, reflection, fictitious excitations, plane shift, truncation error.
I. INTRODUCTION
The main intention of this work is to show that it is possible to use a diagnostic technique in new applications to improve the data quality which are obtained in antenna measurements, reducing the perturbations effect. The algorithm used in all cases is similar. Firstly, the radiated field is measured, then, if the measurement has been performed in near-field and the diagnostic technique which has been implemented uses the far field information, a near field to far field transformation is carried out. Once the field over the aperture antenna is known, the next step is to replace the field out of the antenna dimensions by zeros, where the effect of reflections, unwanted radiation (like faulty connectors or cables), truncation in planar or cylindrical near-field and noise appear. Finally, a new radiated field is obtained by means of an inverse diagnostic procedure where all those effects have been suppressed.
Before presenting the theory that is behind these applications and its results, the diagnostic techniques are reviewed. This is dealt in the following section, II, where it is indicated the definition of an antenna diagnosis, their classical applications (widely studied, [1]-[2]), and the different ways or methods to make such diagnosis. In section III, a reconstruction result is shown. After that, the most relevant information of each new application is presented in four
independent sections. First of all, the theoretical aspects will be described, and then, results from simulations or measurements, to justify that the applications proposed are useful to improve the measurement results, will be shown.
II. DIAGNOSTICTECHNIQUES
A diagnostic technique is a method to obtain the extremely near field or the equivalent currents distribution of an antenna from the knowledge of its radiated field (near or far field). With this information, it is possible to detect errors, and also to identify which are the causes of such errors, for example, electrical errors in arrays or mechanical errors in reflectors. The presence of these errors is always detected in the far field pattern, when a difference between the real case and the design case is observed. However, to know the fault of the antenna under test could be a very hard and long task for the antenna designer. So, in this point it is interesting to use one of these kinds of techniques to reduce the difficulty and the time in the design stage. This is the typical and classical application of a diagnostic process. But also, a source reconstruction gives a complete electromagnetic characterization of the antenna (near field to far field transformation, radioelectric coverage…).
The following step is to indicate the different methods that exist to obtain the field over the antenna aperture (extremely near field). Basically, there are two types of diagnosis [3], where the first of them is based on the application of the equivalence principle and the integral equations relating fields and sources (integral equation methods, IEM), and the last one based on modal expansions (modal expansion methods, MEM). Next, each of these kinds of techniques is presented in more detail.
IEM has the advantage to be a general technique, but from a numerical point of view it is more complex, since it is necessary to solve an integral equations system. Several studios about how to obtain a solution of such system depending on the geometry of the measurement system have been performed recently [4]-[5]. Those integral equations are defined by (1).
(1)
2 (2)
On the other hand, MEM implies just the opposite of the previous methods, less numerical complex, that is, less computational complex, but in contrast, only can be used in particular situations, when the measurement is performed over canonical surfaces. The reason of this last, is the necessity to express the measured field like a superposition of orthogonal functions (vector wave solutions), and there are only six coordinate systems that provide that orthogonality between the solutions of the Maxwell`s equations. Moreover, just three of them (planar, cylindrical and spherical) offer mechanically convenient scanning. Depending on the coordinate system, one particular kind of expansion (plane wave expansion, cylindrical wave expansion or spherical wave expansion) is performed, explained in detail in [6]-[7]. Finally, the diagnosis is made from these expansions and using the plane wave spectrum (plane expansion coefficients) as intermediary, since there is a direct connection between that spectrum and the field over the antenna aperture, as it can see in (3).
, , (3)
In this point, it is necessary to distinguish different situations depending on the coordinates system and the region where the measurement is made.
- Planar near field: the plane wave spectrum referred to the measurement plane [8] is obtained immediately as the inverse expression of (3).
, , (4)
Once this PWS is known, it is only necessary a backpropagation, calculating the plane wave spectrum referred to the antenna aperture (5), and finally, the reconstructed field is obtained by means of (3).
, , 0 , , (5)
- Spherical near field: in this case a transformation from spherical wave expansion to plane wave expansion is required. This transformation was recently developed in [9], and relates spherical and plane coefficients:
, ∑ ∑ (6)
- Far field: the last possibility is to use the far field information [10] either because the measurement has been made in that region or because a transformation from near field to far field has been employed. In this case, the plane wave spectrum is calculated by means of a system of two equations, where the components of the field are the known information.
(7)
In the next table, all the different diagnostic techniques are summarized, indicating the steps to determine the field over the antenna surface, Ea, from the measurements.
TABLEI
DIFFERENTKINDSOFDIAGNOSTICTECHNIQUE
Equation integral methods
,
Modal expansion methods
, 0
, 0
0
, , , , ,
0
III.DIAGNOSTIC TECHNIQUE PRACTICAL RESULT As it has been seen in the previous section, there are several ways to be able to know the field distribution over a close surface to the antenna. In our case, only three of these techniques have been implemented. One of them is an integral equation method, where the input data are values in planar near field and is described completely in [5]. And the others two are modal expansion methods for planar near field and far field data.
Now, the results of a diagnostic, not using the information of a simulation, but also the data of a measurement, are going to be presented. The antenna under test was the VAST-12 Antenna, developed by the DTU and used as reference in several comparison campaigns [11].
IV.REFLECTION CANCELLING
The errors due to reflections can appear when an antenna is measured in a non anechoic environment or even in an anechoic chamber. There are several ways to reduce them, but the most popular is the use of radiation absorbent material (RAM) in the chamber. Also, there are reflections cancelling techniques which are applied to the measurement data, like the Matrix Pencil Method [12] or methods based on the Fast Fourier Transform [13]. Here, an application of the traditional diagnostic techniques to reduce the effect of the reflections coming from side directions on the antenna measurement systems is proposed. The advantage of this method is that only need the measurement data in one frequency.
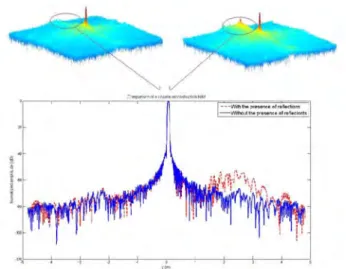
The process is based on the substitution of the “fictitious” excitations which appear out of the antenna area by zeroes. Once these excitations are cancelled, the plane wave spectrum is recalculated, and with this last information and applying (7), the new radiation pattern components. To summarize, the different steps of this cancellation technique, are the following: - Apply a diagnosis method (inverse problem) and obtain the value of the excitations in a zone larger than the antenna dimensions. Out of the antenna, “fictitious” excitations due to reflections in the walls of the anechoic chamber appear.
Fig. 2 Fictitious excitations that appear out of the antenna dimensions when there are reflections in the measurement.
- Replace by zeroes the value of the “fictitious” excitations which are out of the antenna dimensions.
- Recalculate the Plane Wave Spectrum and with this, the radiation pattern, employing the excitations of the previous point (direct problem).
To validate this first proposed algorithm, several experimental measurements were performed in the anechoic chamber of the Technical University of Madrid. The probe and the antenna under test were selected to be a corrugated conical-horn antenna and a pyramidal-horn antenna respectively, and separated from each other 1,6 m. First of all, the reference measurement was obtained, and then, a rectangular metallic plate was placed inside the anechoic chamber (Fig. 3) in order to introduce reflections in the measurement.
Fig. 3 Experimental measurement system without metallic plate (left) and with metallic plate (right).
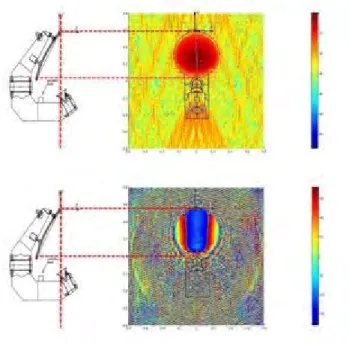
After applying the first step of the algorithm, the reconstruction field is obtained in both cases, depicting the results in the next figure, seeing that, the mentioned “fictitious” excitations appear only in the second experiment, where the metallic plate has been used.
Fig. 4 Reconstruction field (above) and comparison between the two cases (below).
Finally, the second and the third points are carried out, achieving a very good agreement between the reference and the radiation pattern after the reflection cancelling.
V. UNWANTED RADIATION POINTS DETECTION The second proposed application of the diagnostic techniques is the detection of unwanted radiation points. These points may be faulty connectors or cables, and their presences modify the real data. Once the measurement has been made, the following algorithm is applied to detect such points.
- Apply a diagnostic technique and identify disturbed zones out of the antenna dimensions, where the field amplitude is large due to possible leakage sources.
- Cancel the antenna under test field. This new reconstructed field, without the presence of the antenna, is shifted along the z-axis to search the maximum, where the leakage source will be placed.
- Once the unwanted radiation has been identified, to reduce its effect in the radiation pattern, the field around the coordinates which has been obtained in the previous point, is cancelled. In this way, the leakage is removed, and then, applying an inverse process, a radiation pattern very similar to the ideal case is achieved.
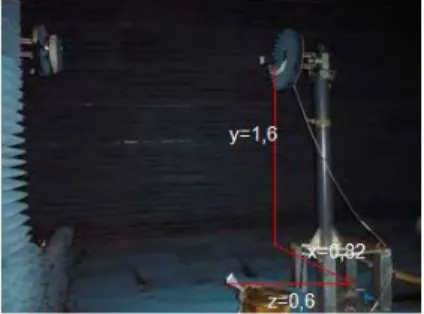
To prove the validity of this second application, a new measurement campaign was performed, employing the same facilities of the experiment in the IV section. A pyramidal-horn was measured in planar near field, introducing other pyramidal-horn of lower gain placed at (0.82, 1.6, 0.6) m to simulate a leakage source.
Fig. 6 Experimental measurement system with leakge.
The radiation pattern results are shown in Fig. 7, where it is possible to see the improvement obtained.
Fig. 7 Radiation pattern comparison with leakage, without leakage and after applying the leakage cancelling algorithm.
VI.TRUNCATION ERROR REDUCTION IN PLANAR AND CYLINDRICAL NEAR FIELD
As it is known, to avoid make a measurement in far field there are different possibilities. One of them is to make it in near field and then to employ a transformation. However, it is necessary to have data over a complete surface surrounding the antenna under test. So, in planar and cylindrical surfaces the finite size of the scan area introduces a so-called truncation error in the calculated far-field pattern. This error may be arbitrarily high outside the so-called reliable region defined by the rays running from the edge of the antenna aperture through the boundary of the scan area. The way to reduce such error has been studied before [14], and it is based on the use of the Gerchberg-Papoulis algorithm:
- First of all, a diagnostic technique is applied.
- Secondly, an iteration process is performed to increase the visible range: after the first reconstruction, all the currents (electric or magnetic) out of the antenna area are replaced by zeroes. Then, the plane wave spectrum is calculated again, and the original results in the invisible region are replaced by these new ones. This process can be iterated until the difference in the invisible region between two iterations is less than one threshold.
As in the two previous sections, a practical result is presented. Here, the algorithm is applied to a satellite antenna which was measured in planar near field.
Fig. 8 Satellite antenna measured in planar near field at 27,9 GHz.
VII. NOISE REDUCTION
In this section it is going to be proposed one way to reduce the noise in antenna measurement, using, as the other algorithms, a diagnostic technique. It is based on the fact that the noise is identically distributed over the reconstruction surface, when a diagnosis is performed. This last affirmation was demonstrated mathematically in [15]. Since the field out the antenna dimensions must be theoretically zero, it is possible to obtain the field over a surface bigger than the aperture antenna and then to cancel the field in that region, where has to be null. Finally, employing an inverse diagnostic technique, a new radiation pattern with less noise level is obtained. This is the theoretical approach, however, after several practical analysis, it was concluded that it is necessary to employ a window larger than the antenna dimensions, since the reconstructed field value around the antenna is not negligible.
Next, the results achieved with the indicated spatial filtering technique are presented. For this, the data which has been employed, are the obtained in the first experiment for the reflection cancelling, where moreover, a noise component has been added (SNR = 27 dB). The next figures depict some results which have been achieved during this research.
Fig. 10 Far field comparison with noise, without noise and after applying the noise reduction technique with a rectangular window with the same antenna dimensions.
Fig. 11 Far field comparison with noise, without noise and after applying the noise reduction technique with a window three times larger than the antenna dimensions, uniform in the middle and with quadratic slope at the edges.
VIII. CONCLUSIONS
The classical application of the diagnostic techniques is to identify the causes of possible errors, like conformal errors in reflectors or phase errors in array antennas. Moreover, in this work, the diagnostic techniques have been employed in four
new algorithms to improve the antenna measurements results, reducing reflections, leakage, truncation errors and noise. In all cases, the steps have been illustrated and then, each algorithm has been validated with a practical result.
ACKNOWLEDGMENT
This work has been developed thanks to the Spanish FPU grant for Ph.D. students and the financing of the Crocante Project (TEC2008-06736-C03-01/TEC).
REFERENCES
[1] B. Svensson and H. Eriksson, “Antenna Diagnostic Applictions”, Third
European Conference on Antennas and Propagation, EuCAP, 23-29 March 2009, Berlin, Germany.
[2] Y. Rahmat-Samii, “Microwave holography of large reflector
antennas-Simulation algorithms”, IEEE Transactions on antennas and Propagation, vol. AP-33, no. 11, November 1985.
[3] D. Sánchez and M. Baquero, “High-resolution algorithms for the
reconstruction of the equivalent currents of an antenna by means of modal theory and a priori information”, PhD Dissertation, UPV, May 2009.
[4] Y. Álvarez, F. Las-Heras and M. Rodríguez, “Reconstruction of
Equivalent Currents Distribution Over Arbitrary Three-Dimensional Surfaces Based on Integral Equation Algorithms”, IEEE Trans. Antennas and Propagation, Vol. 55, pp. 3460-3468, December 2007.
[5] P. Petre and T. K. Sarkar, “Planar Near-Field to Far-Field
Transformation Using an Equivalent Magnetic Current Approach”, IEEE Trans. Antennas and Propagation, Vol. 40, pp. 1348-1356, November 1992.
[6] A. D. Yaghjian, “An overview of Near-Field Antenna Measurements”,
IEEE Trans. Antennas and Propagation, Vol AP-34, pp. 30-45, January 1986.
[7] R. C. Johnson, H. A. Ecker and J. S. Hollis, “Determination of
Far-Field Antenna Patterns from Near-Far-Field Measurements”, Proceedings of the IEEE, Vol. 61, NO. 12, December 1973.
[8] M. S. Narasimhan and B. Preetham, “A Technique to Synthesizing the
Excitation Currents of Planar Arrays or Apertures”, IEEE on Transactions and propagation, Vol 38, No. 9, September 1990. “PDCA12-70 data sheet,” Opto Speed SA, Mezzovico, Switzerland.
[9] C. Cappellin and O. Breinbjerg, “Antenna Diagnostics for Spherical
Near-Field Antenna Measurements”, Phd Tesis, September 2007..
[10] F. J. Cano, L. Orgaz, S. Burgos, M. Sierra-Castañer and J. L. Besada,
Aplicación de técnicas de diagnóstico de agrupamiento de antenas para aumentar el margen visible y cancelar reflexiones, XXIII Simposium Nacional de la Unión Científica Internacional de Radio, Septiembre
2008.Wireless LAN Medium Access Control (MAC) and Physical Layer
(PHY) Specification, IEEE Std. 802.11, 1997.
[11] J. E. Hansen, ‘‘Definition, design, manufacture, test and use of a 12 GHz Validation Standard Antenna’’, Technical Report R672, EMI, Technical University of Denmark,October 1997.
[12] T. K. Sarkar and O. Pereira “Using the Matrix Pencil Method to
Estimate the Parameters of a Sum of Complex Exponentials” IEEE, Antennas and Propagation Magazine, Vol. 37, No. 1, pp. 48-55, February 1995.
[13] S. Loredo Rodríguez, M. Rodríguez Pino, F. Las Heras Andrés, T. K.
Sarkar, “Ecos Identification and Cancellation Techniques for Antenna Measurement in Non-Anechoic Test Sites”, IEEE, Antennas and Propagation Magazine, Vol. 46, No. 1, pp. 100-107, February 2004
[14] E. Martini, O. Breinbjerg and S. Maci, “Reduction of Truncation
Errors in Planar Near-Field Aperture Antenna Measurements Using the
Gerchberg-Papoulis Algorithm”, IEEE Transactions on Antennas and
Propagation, Vol. 56, November 2008.
[15] S. Burgos, F. Cano, M. Sierra-Castañer and J. L. Besada,”
Improvement of the signal to noise in spherical near field antenna
measurement through mode truncation and spatial filtering”, 31st