MICRO CALCIFICATION DETECTION APPLYING ARTIFICIAL NEURAL NETWORKS AND MATHEMATICAL MORPHOLOGY IN DIGITAL
MAMMOGRAMS
J. QUINTANILLA-DOMINGUEZ1,2, M.G. CORTINA-JANUCHS1,2, B. OJEDA-MAGANA 1, ALEKSANDAR JEVTIct, A. VEGA-CORONA 2 AND D. ANDINA 1
I Group for Automation in Signal and Communications, Technical University of Madrid, Spain 2Laboratorio de Inteligencia Computacional, LABINCO, University of Guanajuato, Mexico
ABSTRACT- Breast cancer is one of the leading causes to women mortality in the world and early detection is an important means to reduce the mortality rate. The presence of microcalcifications clusters has been considered as a very important indicator of malignant types of breast cancer and its detection is important to prevent and treat the disease. This paper presents an alternative and effective approach in order to detect micro calcifications clusters in digitized mammograms based on the synergy of the image processing, pattern recognition and artificial intelligence. The mathematical morphology is an image processing technique used for the purpose of image enhancement. A k means algorithm is used to cluster the data based on the features vectors and finally an artificial neural network-based classifier is applied and the classification performance is evaluated by a ROC curve. Experimental results indicate that the percentage of correct classification was 99.72%, obtaining 100% true positive (sensitivity) and 99.67% false positive (specificity), with the best classifier proposed. In case of the best classifier, we obtained a performance evaluation of classification of Az = 0.9875.
Key Words: Microcalcifications Clusters, Mathematical Morphology, Artificial Neural Networks, Pattern Recognition.
1. INTRODUCTION
regions with similar characteristics. Zhang et al. [9] proposed a bagging-based twin support vector machine
(8-
TWSVM) to detect MCs, using 164 features. Verma [8], evaluated the impact of multiple clusters in regions of interest (ROls), using a neural network with six features as inputs. Vega-Corona et al. [10]. propose and test a method for the detection of MCs in digital mammography. The method combines selections of Region of Interest (ROI) where MCs were diagnosed, enhanced of the image by histogram adaptive techniques, processing by multiscale wavelet and gray level statistical techniques, clustering and labelling of suboptimal feature vectors applying an unsupervised statistical method base on improvedROI selected from Database Images
Features
(j)
q�:�
[:,1
O
ql
l�
Clustering &q
Labeling4 by k.means
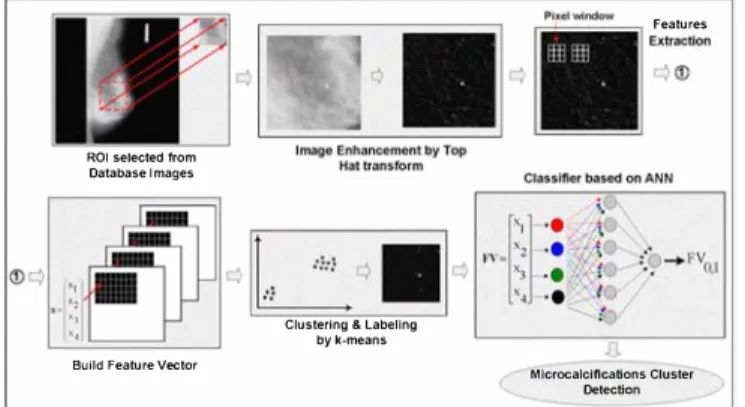
k-means algorithm and a neural feature selector based in a GRNN and detector based in a MLP to finally classify the MCs. In this paper we present a methodology based on Image Processing, Pattern Recognition and Artificial Intelligence for identification of MCs clusters in digitized mammogram images. The method consist in four modules: ROI image selection, ROI image enhancement and feature extraction, data clustering and labeling, finally classification module. Fig. 1 shows the block diagram of our proposed method.
Build Feature Vector
Mlcrocalcltlcations Cluster
Detection
Fig. 1 An overview of the proposed method.
2. ROI SELECTION
The mammograms used to test our method were extracted from a mini Mammographic database provided by Mammographic Image Analysis Society (MIAS) [11]. Each mammogram from the database is a 1024 x 1024 pixels and with a spatial resolution of 200,um/pixel. These mammograms have been reviewed by an expert radiologist and all the abnormalities have been identified and classified. To the place where these abnormalities have been located is known as, Region of Interest (ROI). In this work, the ROI images with a size of 256 x 256 were used.
3. IMAGE ENHANCEMENT AND FEATURE EXTRACTION
3.1
Image Enhancement
In the field of image processing, image enhancement
- -l
includes intensity and contrast manipulation, noise reduction, 1."� - 1-- - -1-- - -l - - 4 - - - � background removal, edges sharpening, filtering, etc. The main
;;
= goal of mammogram enhancement is to sharpen the edges of
�'�
-
- - - 1--- 1-- - � - - - - � -- - - �ROI, or to increase the contrast between ROI and background.
i
� - I. - - I ...j - � - - L In this work we applied the Top-Hat transform in order to1 1
enhancement the ROI image. A Top-Hat is a residual filter
'�P
I
"},.
IIIt
�
�>-k:��_"""'�
""""
..J
which preserves those features in an image that can fit insideFig. 2 Application of the Top the structuring element and removes those that cannot in other
Hat Transform. words the Top-Hat transform is used to segment objects
that differ in brightness from the surrounding background in images with uneven background intensity. The Top-Hat transform is defmed by the following equation:
IT
=lin - [(IineSe)
®se]
(I)
where,
hn
input image,IT
transformed image, se structuring element, e morphological erosion operation, EB morphological dilation operation and - image subtraction operation. [(lin e se) EB se] is also known as the morphological opening operation. Fig 2 shows the Top-Hat transform of a row of a ROI image.3.2
Spatial domain features
are mean and standard deviation, extracted from the images within a rectangular window size n X m
centered into position (i,j). The purpose of applying these characteristics is to distinguish the pixels that correspond to possible MCs clusters of the pixels that correspond to background. The mean and standard deviation are defined by the following equations:
n m
I,,(i,})= �mL L/(i,})
i=1 I=l
(2)
IQ"(i,j)=[ �mt �(f(i,j)-I"(i,j»2r2
(3)where,
IJ.I.,Iu
andfU,n
represent the mean, deviation standard and the gray level value of a pixel located in (i,j) respectively.4. DETECTION OF MICROCALCIFICATION CLUSTERS
In this work uses the general structure of pattern recognition using a classifier based on ANN which stacks and spatially registers a group of feature images. The MCs are identified applying a clustering method such as, the k-means algorithm. Next, the MCs are represented by an image segmented. The detection and posterior consideration of every MCs in the images can obtain improvements in the results in the process of classification.
4.1
Feature vector creation
We build a Features Vector
(FV), FVs
= {xCqs): qs =1, ... , Qs},
where xCqs) E jRD is aD-dimensionalvector and
Qs
is the number of pixels into the image. TheFV
set by pixel inFVs,
are then clustered and labelled using k-means algorithm. Then, we build a vectorx(qs),
with four features by pixelxCqs) = {[ xiqS), x�qS), x�qS), x�qS)]}, where qs =
1 ... , Qs
and Qs =M
X N" whereM
X N is image size. Thepattern vector x is represented by a set of four features described as follows: XI gray level value of original image, X2 gray level value of Top Hat image processed X3 and X.J correspond to mean and deviation standard of image processed by Top Hat transform.
4.2
Clustering and labelling
FVs
are grouped in k-clusters where only one group corresponds to MC (class 1) and other group correspond to some features such as background, vases and normal tissue (class 0). The main idea is thatFVs
is clustered en two class and build two sets one for each classFVJ
andFVo
around of the prototypes of the class centers Z(l) and z(O). For this, we applied a well-established clustering method k means algorithm and then classify the features intoFVs
in two classFVo
andFVJ,
and definedFVo1J
respectively in the equation 4.
FVs = {xCqO/1):
qO/l
=1, ... , Qo/VXCqO/l)
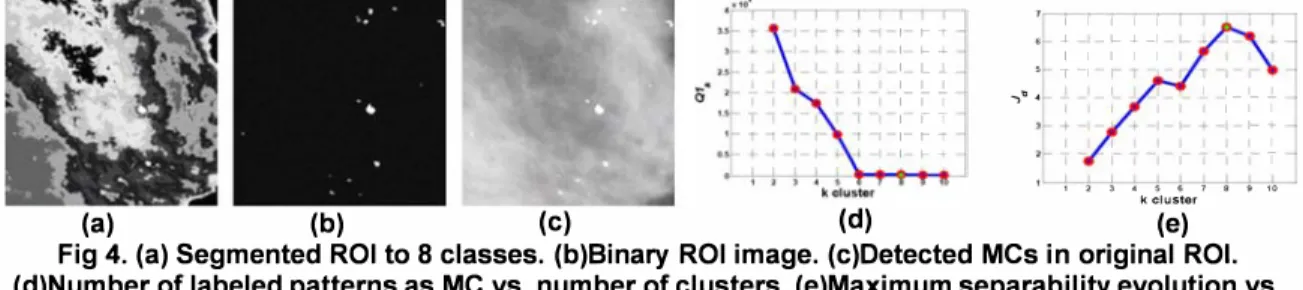
E II�P} (4)In this work the used criterions to determine which cluster represent MC group were: minimum number of data clustered into class with maximum gray level value as well as the clusters separability approach by Fisher Linear Discriminant Analysis [12, 13]. We used a between class matrix dispersion (Sb) and intra class matrix dispersion (Sw), these matrix are used to obtain a separability metric between clusters according to equation 5 proposed in [14]:
Jd =
tr(S�l Sb)
(5)where, and.
Sb
=r�=l
nk(zCk) - Z)(ZCk) - Z)T, Z =11M
r�=l
xCq) andM
=r�=l
nk' Where k is the number of clusters, xCqk) is the vector into cluster Qk and nk is the number of vectors into k cluster,M
is the total features vector. The results of clustering are represented as a segmented image of binary form.5. MICROCALCIFICATIONS CLASSIFICATION
by the network through a learning process known as the Back Propagation (BP) algorithm. The BP algorithm has emerged as the workhorse for the design of a special class of layered FFNN. A FFNN has an input layer of source nodes and an output layer of neurons these two layers connect the network to the outside world. In addition to these two layers, the multilayer perceptron usually has one or more layers of hidden neurons, which are so called because these neurons are not directly accessible. The hidden neurons extract important features contained in the input data. Using supervised learning, these networks can learn the mapping from one data space to other using examples. The terms BP refers to the way that error computed at the output side is propaged backward from the output layer, to hidden layer, and finally to the output layer, details of this method can be found in [15]. For the classifier design, one has to obtain a number of nodes in each layer, number of hidden layers and the type of the training function. The number of hidden layers is usually chosen based on training of the network under various configurations. In many cases, a single hidden layer is sufficient, but the addition of the second hidden layer improves network's prediction capability due to nonlinear separability property of the network.
6. EXPERIMENTAL RESULTS
In this section, the experiments results obtained of each stage of the methodology are presented. In first stage, we selected several ROI images from mammograms with dense tissue and the presence of MCs. Next, the morphological Top-Hat transform is used in order to enhancement the ROI image, with the goal of to segment objects that differ in brightness from the surrounding background. In this work, we apply the same structuring element at different sizes, but the best results in this stage were obtained with the 9 x 9
size. Fig. 3 shows a original ROI image processed by Top Hat transform, as well as topographical relief of each image. In the next stage two window-based features such as, mean and standard deviation were applied. They are extracted from enhancement images within a rectangular window. Five size windows were applied. The correlation analysis was made in order to find the best pixel block window, finally according with the obtained results, we have chosen a 5 x 5 pixel block window. In the next stage, we
(b)
(d)
Fig. 3 (a) Original ROI. (b) Enhancement ROI. (c) Topographic relief of original ROI. (d)
Topographic relief of enhancement ROI.
to train and test our the classifier, for this case we used the 70% of the data to train, 6901 samples, of which 1160 are MCs and 5741 are normal tissue. 30% of the data were used to test, 2657 samples, of which 483 are MCs and 2474 are normal tissue. In this work we apply different network structures, of which the best obtained results were with the following structure 4:9:
I
fully connected with a sigmoidal function in each hidden node.,
1-, j.. .j. , L J. ,_ � J. , , I I r T ,- r- i , I- +
I I I I I • .J. .1
I I
5 T-'
.,' .
L .J. _I I I I
I 1 _ 1 _ 1..
I I I - 1 - ... + I I f T
1 2 , • 5 , 1 II II '0
k cluster
(a) (b) (c) (d) (e)
Fig 4. (a) Segmented ROI to 8 classes. (b)Binary ROI image. (c)Detected MCs in original ROL
(d)Number of labeled patterns as MC vs. number of clusters. (e)Maximum separability evolution vs. number of clusters.
The node output is thresholded to obtain a output between [0,1]. With the following structure 4:12:1 we obtained different results with the previous structure. Next, we build a confusion matrix to determine the probability of the detection MCs (true positive rate, TP) vs probability of false MCs (false positive rate, FP). In Table I shows the performance of the classifiers presented in this work. The performance of the proposed method is evaluated by means of the ROC (Receiver Operating-Characteristics) curve analysis. The ROC curve is a plot of the Sensitivity vs. Specificity for the different possible cut-points of a diagnostic test. Fig 5 shows the ROC curves and the area under the curve (Az) to the classifiers with the structure 1 and structure 2, respectively.
Table I. Confusion matrices and performance of the classifiers presented. Classifier Desired Results Output Results Sensitivity Specificity Total Classification
MCs Normal Tissue (%) (%) Accuracy
(%)
Structure 1 4:9:1 Structure 2
4:12:1
I I IIIIII -1-1-1--1 t-It-I I I IIIIII
0.8 -'- '-Ii TlTI
�O.6 .;;
�
0.5� 0.4
0.2 o.
I IIIIII
MCs Normal Tissue MCs Normal Tissue 483 8 476 9
, I I I 1 1 ' 1
I I I II III
_1_ .J. -l -l J. W W _ _ J. _ L .L J.. 1-1 J.I
I I , '1111 1 I I I IIIII
- 1 - + -i --i + H H - - -t - I- + + 1-1 +1
I I , '1111 1 I I I II III
-, T --, --, T n n - - -r - r T r rl n
I I , 1 1111 1 I I I II III
- -, I' , -, T I-I II -- "1 - ITT II II
1 _, .J llJ IJ __ 1 _ L 1 1 '-'ll
I I , '1111 1
1-Specificity
I I I II III
10'
Fig 5. ROC curves of the classifiers.
7. CONCLUSIONS
0
2466 \00 99.67 99.72
7
2465 98.55 99.63 99.45
Table II. Comparison of this work with other methods presented.
Autor Method Az
A. Vega-Corona et GRNN 0.954
al. (2003)
J.e. Fu et al. (2005) GRNNISVM 0.978/0.98 Y. Peng et al. (2006) KO-GA 0.952 x. Zhang et al. (2009) 8-TWSVM 0.9627
This work
FFNN(BP)
0.9875Table II shows the Az values obtained in previous works, in order to compare the proposed methodology in this work.
Clustering algorithms help us to get a better comprehension and knowledge of the analysed data with the objective to segment the image into different areas according to the problem at hand. In this work, we propose an ANN-based classifier. The ANNs have been used with success in different research areas. The classifier plays an important role in our methodology, because the ANN can learn from the data patterns contained in the training set and conduct complex decision-making. Experimental results presented in this work indicate that our method is an interesting alternative for MCs detection in mammograms in comparison with the methods proposed by the other researchers.
ACKNOWLEDGEMENTS
The authors wishes to thank to The National Council for Science and Technology (CONACyT), The Secretariat of Public Education (SEP) and Government of Mexico and Group of Automation in Signal and Communications (GASC) of Technical University of Madrid for their contribution.
REFERENCES
1. D. Zhao, M. Shridhar and D.G. Daut, "Morphology on detection of calcifications in mammograms", IEEE International Conference on Acoustics, Speach and Signal Processing, ICASSP-92, San Francisco, USA, 1992, pp. 129-132, 1992.
2. M. Wirth, M. Fraschini and J. Lyon, "Contrast enhancement of micro calcifications in mammograms using morphological enhancement and non-flat structuring elements", 17th IEEE Symposium on Computer-Based Medical Systems, CBMS 2004. Bethesda, MD, USA, 2004 , pp.134-139.
3. J.C. Fu, S.K. Lee, S.T.C. Wong, J.Y. Yeh, A.H. Wang and H.K. Wu, "Image segmentation feature selection and pattern classification for mammographic microcalcifications", Computerized Medical Imaging and Graphics( 29), Elsevier, 2005, pp.419-429.
4. Y. Peng, B. Yao and J. Jiang, "Knowledge-discovery incorporated evolutionary search for microcalcification detection in breast cancer diagnosis", Artificial Intelligence in Medicine 37(1), Elsevier, 2006, pp.43-53.
5. P.Mc. Leod, B. Verma and R. Panchal, "Combining SOM based Clustering and MGS for Classification of Suspicious Areas within Digital Mammograms". 3rd International Coriference on Intelligent Sensors, Sensor Networks and Iriformation, ISSNIP '07, Melbourne, Australia, 2007,pp. 413-418.
6. G. Veni, E.E. Regentova and A.K. Mandava, "A New Method of Detecting Microcalcification Clusters for Computer Aided Digital Mammography", 19th International Conference on Systems Engineering, ICSENG '08, Las Vegas, USA, 2008, pp.532-537.
7. C.M. Tiu, T.L. Jong and C.W Hsieh, "Self organizing map neural network with fuzzy screening for micro-calcifications detection on mammograms", IEEE Conference on Soft Computing in Industrial Applications, SMCIa '08, Muroran, Japan, 2008, pp.421-425.
8. B. Verma, "Impact of multiple clusters on neural classification of ROIs in digital mammograms". International Joint Coriference on Neural Networks, /JCNN '09, Atlanta, USA, 2009,pp. 3220-3223. 9. X. Zhang and H. Xie, "A New Approach for Clustered Microcalcifications Detection". Asia-Pacific
Conference on Information Processing, APACIP '09, Shenzhen, China, 2009, pp.322-325.
10. A.Vega-Corona, A.Alvarez, and D.Andina, "Feature Vectors Generation for Detection of Microcalcifications in Digitized Mammography Using Neural Networks", ArtifiCial Neural Nets Problem Solving Methods, LNCS Springer Berlin-Heidelberg, Vo1.2687, 2003, pp. 583-590.
11. J.Suckling, J.Parker and D. Dance, "The mammographic image analysis society digital mammogram database. Exerpta Medica". International Congress Series, Vo1.1069, 1994, pp. 375-378.
12. R.O. Duda, P.E. Hart and D.G Stork. "Pattern Classification", Wiley-Interscience, 2nd ed. 2001. 13. A.Vega-Corona, A.Sanchez-Garcia, M. Gonzalez-Romo, J. Quintanilla-Dominguez, J.M Barron
Adame, "Contextual and Non-Contextual Features Extraction and a Selection Method for Microcalcifications Detection". World Automation Congress, WAC '06, Sevilla, Spain, 2006, pp.I-6. 14. K. Fukunaga. "Introduction to Statistical Pattern Recognition", Academic Press, 2nd ed., 1990. 15. I.A.Basheer and M.Hajmeer, "Artificial neural networks: fundamentals, computing, design, and