Simulation of an electrical substation using the Bond Graph technique.
Gregorio Romero, Jesus Felez, Joaquin Maroto, Jose Manuel Mera
ETSI Industriales, Univ. Politécnica de Madrid, José Gutiérrez Abascal, 2, 28006 Madrid, Spain
E-mail {gregorio.romero, jesus.felez, joaquin.maroto, josemanuel.mera}@upm.es
Abstract
Simulation and especially computer simulation, is a basic tool since it enables engineers to understand how systems work without actually needing to see them. They can learn how they work in different circumstances and optimize their design with considerably less cost in terms of time and money than if they had to carry out tests on a physical system.
There is a wide range of commercial brands on the market offering products for electrical simulation. These are powerful tools, but require the engineer to have a perfect knowledge of the electrical field.
This work will firstly develop the simulation models of different elements that characterise an electrical substation in isolation; they will then be put together to model the full system, all of this using the Bond Graph technique. Finally, the system thus developed will be compared with the one developed in a specific electrical simulation program.
1. Introduction
In electrical engineering, simulation is an indispensable tool when working with complex systems [3]. Studying electrical systems is relatively simple if their behaviour is being analysed under a permanent regime and they consist of few nodes. However, when the systems are complex and require a qualitative and quantitative analysis of the transitory regimes, the problems become considerably more complex.
This method reduces both time and costs since it eliminates the need to build prototypes of circuits. Computer simulation [1] can be used to design the circuits before building them. This method reduces time and costs as the need to build prototypes of the circuits is avoided. By using computer simulation, not
only can an electrical system be designed, but it can also be optimized and its behaviour examined in depth more quickly and cheaply than by using prototypes, tests or analytical studies. Therefore, by being able to see the responses produced as the different parameters are varied, a much deeper understanding of the system under study is reached.
The Bond Graph technique enables systems belonging to the different areas of physics to be modelled in a way that is both intuitive and close to reality [2]. It is a perfect technique for representing elements belonging to the area dealt with in this paper. This paper presents an application by using the Bond Graph technique to simulate an electrical substation.
2. Elements of an electrical substation
When it comes to analyzing a three-phase electrical circuit, which is what we are dealing with, it may be assumed that the three phases are balanced and therefore behave similarly. For this reason, when simulating an electrical substation, it is possible to work with the single-line circuit of one of the phases where the line and the different elements to be taken into account can be more easily analyzed.
Figure 1 shows a typical single-line substation circuit diagram where two active input positions can be seen (lines L1 and L2) and two output positions (lines L3 and L4). Additionally, there is one input and two output positions in reserve.
This diagram shows how the two input positions are connected to a common busbar and the two output positions terminate in another busbar, also common to both of them. This leads to the different input or output branches being placed in parallel and the power transformer being situated between both parts.
There is a series of elements that are needed for this type of facility to operate, which are described below. Tenth International Conference on Computer Modeling and Simulation
Figure 1. Single-line electrical diagram of a substation
2.1. Switches
In an electrical system actions need to be carried out to vary its layout or topology. Certain manoeuvres are simply necessary to connect or disconnect loads, others to interrupt the passage of current in the event of failure and others to earth some part of the system [4].
An automatic switch can establish, support, and interrupt currents under normal circuit conditions, as well as establish, support for a determined period of time and interrupt currents under abnormal specified circuit conditions, such as a short-circuit. In a Bond-Graph, a resistance port placed in series can be modelled with the rest of the circuit to which the values have to be introduced as a conditioned parameter. If the switch is closed, the resistance value will be zero, while if it is open the value is very high, preventing the passage of flow or current.
Figure 2. Modelling a switch in a Bond-Graph.
To open or close a switch, the resistance value can either be based on a function that evolves over time or set to the value that other circuit parameters acquire. In this latter case, relays can be generated to open the switch if a current level is exceeded in some element. Likewise, but making its operation conditional on normal circuit conditions or on abnormal conditions
for a determined period of time, a contactor can be modelled. This type of apparatus can support and interrupt currents under normal circuit conditions, including specified in-service overload conditions temporarily, as well as support specified abnormal circuit conditions for a determined period of time, such as short-circuits. This is the case with voltage and intensity transformers that are at the beginning of the L1 and L2 input positions and at the end of the L3 and L4 output positions.
On occasions, for safety reasons a mechanical connection device in an open position must satisfy a cut-off distance that will satisfy the specified conditions. This is the case of the cut-offs placed in the busbars of each input and output position. These types of elements can open and close a circuit when the current to be established or interrupted is negligible or when no appreciable change of voltage in the terminals of each of the cut-off poles is produced. There is a type of cut-off that is used to earth part of a circuit and which can support currents under abnormal conditions for a determined period of time, such as a short-circuit. Modelling the first of the cut-offs in a Bond Graph is the same as for the switch, although its operating conditions must be conditional on the status of the associated switch; the second type of cut-off will be completed by placing a zero effort source in series to simulate the earth.
L1 L2
Figure 3. Earth cut-off in a Bond Graph.
2.3. Loads
Regarding load modelling, it must be borne in mind that in an electrical node, the current is divided by the cables connected to it, the voltage at all points of the contact being equal. This behaviour is obtained in a Bond Graph with type 0 nodes, where the (current) is equal to the sum of the output flows and the effort of the bonds it joins is the same, while with type 1 nodes the input current is equal to the output current less what is lost in the element, such as happens with elements in series.
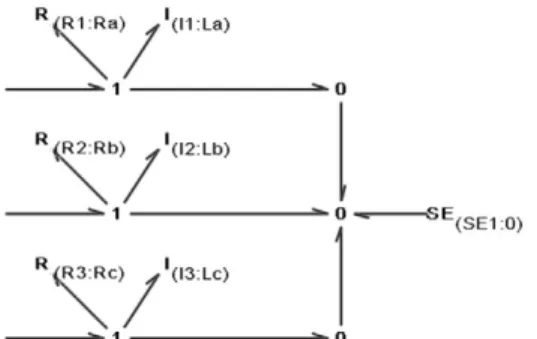
In three-phase systems [5], the loads can be connected either in a triangle or a star, and this in turn, to earth or insulated. In an insulated three-phase star load the resistance and inductance of each phase will be joined by a type 1 node, since the Bond Graph elements are in series, and subsequently the bonds of each of the three phases will be joined by a type 0 node, of common potential representing the neutral of the star. If the neutral is rigidly earthed, the bonds joining it will need to be set to zero potential. This can be achieved with a zero level effort source joined to the 0 node representing the neutral, as shown in figure 4.
Figure 4. Three-phase load in a star with rigid neutral to earth.
2.4. Sources
As with the loads, the effort sources (voltage) represented by the Bond Graph technique are ideal sources and generate a potential difference across the terminals that is constant and independent of the load. Unlike ideal sources the potential difference produced by real sources is dependant on the load to which they are connected. A real voltage source may be considered an ideal voltage source, U, in series with a
resistance Rg, denominated internal resistance. In
order to obtain real sources in a Bond-Graph, a resistance port needs to be added to act as an internal resistance using a node 1, so that it will be in series.
Then, by joining the single-phase effort forces in an appropriate star or triangular layout, three-phase systems can be attained. In the case under study, three-phase, star voltage sources can be obtained by connecting the different effort sources in type 1 nodes, and subsequently, all of them in a type 0 node and a zero value effort force that simulates the earth.
Figure 5. Three-phase voltage source with neutral to earth.
2.5. Transformer
The transformer comprises two primary and secondary coils and enables the electric power to be transformed, with specific magnitudes of voltage and intensity, into other usually different voltages. The electromagnetic part of a transformer comprises a magnetic nucleus and windings.
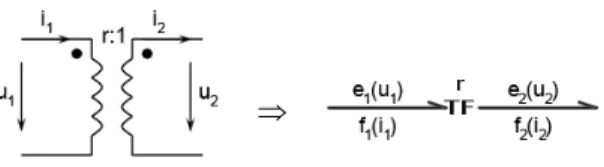
The windings around the nucleus form the primary and secondary coils, with N1 and N2 number of turns respectively. When an alternating current is applied to the primary, an alternating current flows through it, which, in turn, produces an alternating flow in the nucleus whose direction is determined by Ampere’s law applied to this coil. Due to the periodical variation of this flow induced electromagnetic forces are created in the coils and this leads to a voltage in the terminals of the secondary coil whose ratio to the primary is:
r N N e e
2 1
2
1 = = (1)
⇒
Figure 6. Ideal single-phase transformer.
However, real transformers have losses and therefore, the resistance of the coils and the dispersion flows need to be taken into account. This is done with the R1 and R resistances, for the primary and secondary
coils and with the X1 and X2 reactances.
By reducing the windings to the same number of turns an equivalent circuit is obtained. However, in practice, and due to the low value of the intensity i0
equivalent to the current responsible for creating the magnetic flux in the nucleus compared to the currents i1 and i2, an approximate equivalent circuit is usually
worked with, which is obtained by grouping the impedances in series. In this way, the resistances and reactances of the short-circuit (Xcc y Rcc) are obtained.
Figure 7. Real simplified single-phase transformer.
In this work, a three-phase transformer will be formed by using a single magnetic nucleus incorporating all the windings required. It will comprise three equal columns on which the turns are rolled that make up the primary and secondary coils of each phase. Each column is considered as a single-phase transformer, so that the same analytical techniques as in the single-phase study can be applied.
Depending on the types of winding connections of a transformer (star or triangle), some phase differences may appear between the primary and secondary compound voltages and the concept of phase-lag index appears. On the other hand, the voltages of the windings that are in the same column UAA’ and Uaa’ are
in phase, but since there is a mixed connection in the coils Yy, Yd, Dy, the primary and secondary compound voltages will present a phase-lag with one another, which will be a multiple of 30º. The value of this inter-voltage phase-lag will depend on the type of coil and how they are connected.
In our example, a transformer, Yy, has the primary and secondary connected in a star, as the following figure shows.
Figure 8. Connection Yy.
In this type of connection, the phase-lag between the primary and the secondary is 0º, and therefore, can be modelled using three single-phase transformers with no parallel branch, since the effort outputs will be the effort inputs divided by the ratio of the MTF element. Since this value is a scalar, there will be no phase-lag between them, the same as with the flows.
Figure 9. Three-phase transformer Yy.
3. Opening and closing manoeuvres.
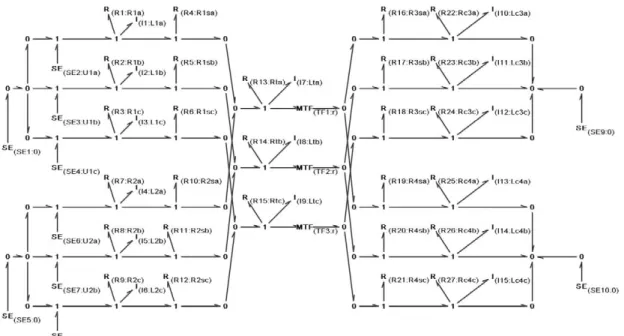
In order to proceed to the electrical substation simulation, it is necessary to draw a simplified three-phase diagram showing the different elements dealt with in the preceding paragraphs. The different Bond Graph models analyzed will have to be substituted in order to generate a valid simulation model.
Figure 10. Equivalent circuit of an electrical substation.
Figure 11. Equivalent circuit in a Bond Graph.
Regarding the values taken by way of example, some apparent powers of 4 and 5 GVA have been taken into account in the input positions respectively, and of 60 and 90 MVA in the output positions.
( )
1 1 1
2
220
12 1 38 515 0 2
4
cc cc cc
kV
Z , L , mH (con R , ) GVA
= = Ω⇒ = = Ω (2)
( )
2 2 1
2
220
9 68 30 812 0 2
5
cc cc cc
kV
Z , L , mH (con R , ) GVA
= = Ω⇒ = = Ω (3)
( )
3 3 3
2
132
290 4 402 921 261 36
60
c c c
kV
Z , L , mH ,R , MVA
= = Ω⇒ = = Ω (4)
( )
4 4 4
2
132
193 6 268 611 174 24
90
c c c
kV
Z , L , mH ,R , MVA
= = Ω⇒ = = Ω (5)
To see how one position affects another, 4 seg. will be simulated bearing in mind that the line L1 switches are open between t=0.3 sec. and t=1 sec., and those of the L2 line between t=2.3 sec. and t=3 sec., while the remainder will be closed at all times.
Figure 12. Diagram drawn in PSCAD ©.
In order to validate this, the same exercise was done with PSCAD © elements (fig. 12) [6].
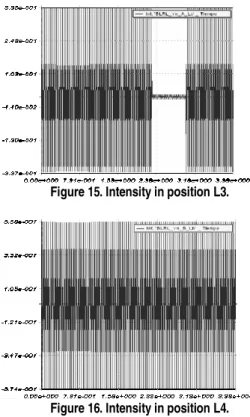
The following results (figs. 13 to 16) show the intensity (A) vs time (sec.) flowing through a single phase in each of the positions. It can be seen how they are equal to those performed with PSCAD © (fig. 17).
Figure 13. Intensity in position L1.
Figure 15. Intensity in position L3.
Figure 16. Intensity in position L4.
In this simulation the currents required for the L3 and L4 positions are 0.39 A and 0.55 A respectively when the four switches are closed. Regarding the supply from the power stations in the L1 and L2 positions, 0.24 A and 0.32 A are supplied respectively, whose sum after applying the transformation ratio is the total current required of 0.94 A. On the other hand, when the L1 position switch is opened, all the current must be supplied by the power station in position L2. When it is closed again, in the transitory process it can be seen that the current in position L2 is the difference between that demanded by the load and that supplied by the power station in the other position.
Regarding the opening of the switch in position L3, it can be seen how the current demanded drops to 0.55 A ((0.15+0.18)·220/132).
Figure 17. Simulation results (Intensity vs time) performed in PSCAD ©.
Thus, the model developed for the simulation of an electrical substation using the Bond Graph technique may be considered as valid.
4. Conclusions.
Computer simulation is a basic tool since it leads to an understanding of how systems work without actually needing to see them.
It may be said that the Bond Graph technique is a simple and effective mathematical modelling technique that lets the model be understood without losing the physical sense of each of its components, no matter how complex it may be. Its methodology unified for different physical domains enables the electrical part to be joined to other parts of the systems that appear in engineering, such as, mechanics or hydraulics, it being unnecessary to change the simulation environment or computer application when machines need to be joined to mechanical shafts, pumps or turbines,…
In addition, as has been seen in this work, their hierarchical ordering lets large systems be easily modelled, such as substations or electrically operated devices by joining together simpler subsystems.
5. Acknowledge
This project is supported by Spanish Agency CICYT under the Project of Reference TAP99-0968.
6. References
[1] D.C. Karnopp, D.L. Margolis and R.C. Rosenberg. System Dynamics: a Unified Approach. 2nd Edition, Wiley
Interscience, New York, 1990.
[2] J. Buisson and H. Cormerais. Avoiding singular bond graphs in the field of electricity. International Conference on Computer Engineering in Systems Applications, Nabeul-Hammamet. p. 403-406. 1998.
[3] E. Arroyo and J.L. Los Arcos. SRV: a virtual reality application to electrical substations operation training. IEEE International Conference on Multimedia Computing and Systems (ICMCS’99), vol. 1, 1999, p. 9835. 1999.
[4] M. Poyraz, Y. Demir, A. Gülten and M. Köksal Analysis of switched systems using the bond graph methods. Journal of the Franklin Institute, Volume 336, Issue 3, , p. 379-386. 1999.
[5] A. Bose. Three-Phase Alternating Current Systems. The Electrical Engineering Handbook, p. 709-711. 2005.