BARCELONA
Credit: Jorge Lizana
Edited by
Urban Ecology Department.
Ajuntament de Barcelona.
December, 2018.
Contents coordination
Urban Resilience Department, Ajuntament de Barcelona.
Editorial team. Preliminary Resilience Assessment of Barcelona.
Urban Resilience Department, Ajuntament de Barcelona, 100 Resilient Cities and the City Resilience Profiling Programme at UN-Habitat.
Printed on 100% recycled paper.
The CO2 emmissions related to the publication of this document have been offset through the Clean CO2 project in Brazil.
The contents of this publication are published under an Attribution (by) license. This material can be copied and redistributed in any medium or format, for any purpose, even commercially, as long as the derivative publications are also distributed without restriction and always giving appropriate credit.
The full license description can be accessed at:
CONTENTS
1. INTRODUCTION
2. DIAGNOSIS
3. INTERNAL AND CITIZEN PERCEPTION
4. DISCOVERY AREAS
1.1 Justification: Why is resilience so important?
1.2 Background: Resilience in Barcelona
1.3 Process: Institutionalising resilience
1.4 Model: Barcelona's resilience model
1.5 Strategy: Barcelona’s resilience strategy
2.1 Barcelona now
2.2 Barcelona's resilience profile
2.3 Definition of current risks: Shocks and stresses 2.4 Analysis of vulnerabilities
2.5 Action mapping
4.1 Stages of life
4.2 Living conditions
4.3 Public spaces
4.4 Social and economic prosperity
4.5 City of refuge and migrations
6
8
16
20
24
28
38
46
56
62
80
82
84
86
88
4
26
68
76
3.1 Tools for incorporating the main concerns of municipal professionals andcity residents: sectoral interviews and perception surveys
3.2 Mapping of perceptions from the survey of the six-monthly Barcelona
Barometer for 2018
70
1.
INTROD
The overall trend in the development of civilisation is shifting towards the concentration of populations in urban areas. According to data from the United Nations, over 54% of the world’s population currently lives in cities. By 2050, some 6,300 million people – 66% of the total and the equivalent of the world’s entire population in 2000 – are expected to live in an urban environment.
That means cities already play a key role in human development and will be increasingly influential in promoting living conditions that guarantee their residents’ protection, health, equal opportunities and well-being. Hence the pressing need for a development model that is sustainable over time and environmentally friendly from a global perspective.
It is in this context that we understand the concept of resilience applied to city residents and urban systems. Urban resilience is the capacity of cities to prevent or, where inevitable, minimise the impact of both chronic stresses and exceptional emergency situations or one-off incidents. Such situations may be the result of natural, man-made or technological causes. Resilience provides a series of general principles and guidelines for coping with such shocks and stresses through the sustainable development of cities and urban areas from a holistic perspective.
In the last few years, a number of influential
organisations have strengthened their activity in this area, among them the United Nations, the Rockefeller Foundation, C40 and Local Governments for Sustainability (ICLEI). They identified the need to start urgent work on creating the necessary bases for examining, planning and building cities that guaranteed a sustainable model for a safe and positive community life for their citizens. Resilience strategies have also been developed by the the United Nations Office for Disaster-Risk Reduction (UNISDR) programme – which aims to raise world awareness through risk-reduction strategies – and the UN-Habitat’s City Resilience Profiling Programme (CRPP), which is based in and co-led by Barcelona, and is focused on establishing and sharing city profiles and the most effective indicators for developing urban resilience.
More recently, collaboration with the 100 Resilient Cities programme has further strengthened the progress of this movement. Their programme has promoted the creation of resilience offices in the 100 participant cities worldwide, more than 40 of which have already established their Resilience Strategies. These constitute clear examples of the confluence of our approach with the impetus of this comprehensive universal goal.
Resilience is also part of the New Urban Agenda and the Sustainable Development Goals (SDGs)
1.1
Justification:
Why is resilience so important?
promoted by the UN and agreed to at the Habitat III United Nations Conference on Housing and Sustainable Urban Development held in Quito in 2016 (SDG 11. Goal 11: ‘Sustainable cities and communities’).
A resilient city is not just a city that protects itself in order to cope effectively with the impact of critical situations, whether because
it has suffered them in the past or expects to experience them in the future. A resilient city is forward-thinking. It is a city that has taken the initiative to plan and provide for potential risks by establishing preventive initiatives and by intervening to change the parameters that enable us to develop towards our ideal city.
Festival of Castellera in the Plaza St Jaume, 2015 Credit: Ajuntament de Barcelona
7
Ajuntament de Barcelona
1.2
Background:
Resilience in Barcelona
Barcelona has a long history of implementing measures to promote urban resilience, some of which pre-date the use of this specific term. As the city has made progress through several stages, it has gradually strengthened areas where it was vulnerable, adjusted operating procedures and protocols, and addressed critical situations more strongly from a holistic perspective. This has happened as a result of the development of increasingly complex processes and systems with a major inter-dependency factor, each one having an impact on the another if one of them fails. More recently, this has involved the integration and develoment of processes to protect and support vulnerable groups and individuals.
We have defined three distinct stages in this process of development.
During the first stage, until 2009, individual sectors and departments implemented plans and projects that generated resilience value within the city. However, they solved problems intrinsic to their own area without defining techniques or methodology that would coordinate their solutions with those of other areas and create an integrated and inter-dependent system.
Plans, projects and initiatives aimed at reducing vulnerability and tackling critical situations were implemented in the city, gradually becoming more consistent in their approach. Some of the most important of these are noted below:
• Barcelona has had a sewerage plan since 1997 to minimise critical situations caused
by floods and discharges of rainwater and sewage into the sea during the episodes of torrential rain typical of our climate and as a result of the city’s layout. Such critical episodes had been common before the plan was implemented. The problem was solved by the creation of a network of thirteen underground lamination tanks to retain the excess water and subsequently pump it out to two remote-controlled water-treatment plants, managed according to the weather and the network’s actual condition. Apart from minimising any damage caused by floods, this ensured an exceptional quality of water along the coast.
• Municipal emergency plans have been established which lay down a protocol to regulate the city’s response to specific risk factors, both recurrent and exceptional. Barcelona currently has a Municipal Civil Protection Plan in place, which includes dedicated action plans for heatwaves, strong winds and rough sea conditions, plus as many as twelve Municipal Emergency Action Plans (PAEM) and Specific Municipal Emergency Plans (PEEM) to deal with particular shocks, such as floods, forest fires and failures in electricity, water or gas supplies, among other things.
• Another project was the launch of the Joint Command Room, which has been coordinating every type of reactive intervention by the city police (the Guardia Urbana or GUB), the Catalan regional police (the Mossos d’Esquadra) and the
Fire Brigade since 2005, as well as any occasions when regional police officers have been deployed in the Catalan capital. The Emergency Medical Service has now also joined this initiative. At the time of its creation, it was the only service of its kind in Europe and its interventions guarantee a highly effective response and appropriate targeted action. The service also provides a base for the Liaison and Coordination Centre (CECOR), where the various participants meet up during the activation of any such Municipal Emergency Action Plans.
Despite the real value generated by all these plans and projects, the early part of the past decade saw a series of situations arise, essentially in the area of infrastructure and services, which raised awareness in the city of the need for a change of paradigm to reduce vulnerabilities, ensure swift and effective responses to crisis situations, and strengthen the ability to recover the affected services as
quickly as possible. The most critical situations and their causes during that period are summarised below.
• In January 2005, the collapse of a shunting tunnel under construction to extend metro Line 5 to the El Carmel neighbourhood resulted in the evacuation of 54 buildings, with over a thousand people affected, and the demolition of four buildings. The incident led to a radical change in building methods and in the control and monitoring of tunnels constructed in the city from then on.
• June 2007 saw the collapse of a section of a retaining wall on land surrounding the area of the future underground car park for a building on the old Bayer factory site, at the junction of Calàbria Street and París Street. The collapse led to part of the road and bus lane caving in, bringing down a high-voltage electricity line and a gas pipe. Sparks then ignited the gas, resulting in a fire that lasted for several hours. The incident led to the development of the Municipal Sounding Protocol for controlling
The Carmel metro station, 2010 Credit: Bernat Borras
9
Ajuntament de Barcelona
and preventing situations of that type in work carried out in the subsoil, whether public or private.
• There was a severe drought from autumn 2006 to spring 2008, which had a serious effect on Barcelona and its metropolitan area. This opened the way for an intense debate on traditional water-transfer solutions, including those based on regulating demand, and the use of alternative and local resources. Having raised the awareness of city residents, consumption dropped to 104 litres a day per capita, very close to the 100-litre limit recommended by the World Health Organisation (WHO). Supplies were supplemented with emergency measures, such as a water tanker brought over to Barcelona; the activation of the second level of emergency; restrictions in certain uses; and greater exploitation of local resources for public uses. Shortly afterwards, the El Prat desalination plant and the El Ter and El Llobregat river basins’ connecting pipes were established and put into service.
• In July 2007, a high-voltage electricity cable fell onto the Collblanc distribution station, causing a short-circuit that affected the entire grid, even causing a fire in the Maragall substation which affected 323,337 users for 56 hours and 42 minutes. The critical nature of the electricity grid, especially in an urban environment, affected several electricity-dependent services, requiring the provisional use of electricity generators to temporarily cover the areas affected. This incident prompted the Catalan regional government to enact new legislation on electrical quality to regulate such situations, and even today high-voltage lines are still being put up through the city centre to interconnect substations which, while not a permanent solution to the situation, reduce the risk of other similar incidents.
• Finally, in October 2007 another crisis situation had a massive effect on access to Barcelona, when a rush to extend the AVE high-speed train line led to serious subsidence on the R2 and R10 local
Police officers in the port of Barcelona Credit: Mossos d’Esquadra
commuter train’s southern access lines and in the Llobregat-Anoia FGC railway line tunnel. Replacement bus services and metro interchanges were the temporary solution for the 160,000 people affected by the power cuts, until the local commuter and FGC train services were permanently replaced, after 40 days and four months respectively.
Uncertainly over the extent of real vulnerability of infrastructures, the risk of seeing another critical interruption of this scale in public services and the high probability of cascade effects on the other basic services put the municipal government on the alert over the need for a new paradigm. More specifically, the power cut affected a series of basic services that seriously harmed the living conditions of the citizens affected, while the proposed preventive solutions were neither immediate nor solely dependent on the municipal government. This is where the second stage of the resilience process
in Barcelona began. The focus at the time was on the critical situations that had occurred in the infrastructure and services. The key goal identified was to look at potential remedies from a holistic perspective by working with internal and external participants.
The main steps taken at this stage were as follows:
• A diagnosis of the situation, centred on identifying weak points and interdependencies as well as the essential operational procedures of the city’s basic services, was made in 2008 by a team from the Sarrià Institute of Chemistry, which applied the experience of detecting and reducing risks in the industrial sector to urban systems, under a project called Safety in the Provision (3S). Taking part in the process were the city’s main service providers and expert teams from the various related municipal areas. Although essential, this work was not enough on its own to add real value to the city’s resilience.
Fire at the electrical substation at Maragall, 2012 Credit: Elena Carreras
11
Ajuntament de Barcelona
• On the basis of the diagnosis and prioritised proposals for risk situations in the various areas, the next phase was to move to an practical stage, which would generate resilience for the city by implementing collaborative projects, involving all the relevant departments, focused on reducing or eliminating, wherever possible, the risks that had been identified. This was coordinated by what is now the Department of Urban Resilience at the Manager’s Office for Urban Ecology and the Fire Prevention, Extinction and Rescue Service Department (SPEIS), who set about creating infrastructure committees and urban services (under the Catalan acronym of TISU). These committees were established with eight working groups from the various areas. They created a structured methodology with its own inbuilt continuity as it incorporated a permanent process of reviewing and updating the risks that had been identified.
• In particular, a work platform called the Situation Room was set up under the projects implemented by this committee to enable a comprehensive analysis of how the city was run. The value of this was in significantly improving the ability to detect concentrations of incidents and weak points in individual departments or areas of the city. This made a valuable contribution to the decision-making process.
• The development of TISU committees into Barcelona’s existing urban resilience committees brought about a reorganisation of the working groups and a further improved methodology. Several existing groups were recast and others created, such as the People’s Assistance group and the Urban Planning group.
• One important element of this resilience work was an increased collaboration with other international bodies and institutions. Attracted by the coherent and pragmatic approach of Barcelona’s methodology,
Mercat de Santa Caterina Credit: l‘Ajuntament de Barcelona
they established a mutually beneficial relationship with the city. The closest relationship was with the UN-Habitat’s City Resilience Profiling Programme (CRPP), also based in Barcelona.
Recently, we identified a pressing need to boost and prioritise resilience projects aimed at helping the most vulnerable city groups and residents and at incorporating citizen participation into the projects, which have been enriched and improved through broader collaboration.
We are now at the third stage, which has just started, and we are continuing to implement projects across all areas. Projects rely on the integrated work procedures and systems established during the second stage, and the experience gained during their development. The strategic approach is solid and in line with the main international perspectives and requirements, bringing with it a guarantee of real value for the city.
This strongly cooperative approach underpins the new impetus of the third stage, which brings us closer to meeting our long-term goals for resilience and adapting to climate change.
Carrer de Sans
Credit: Vicente Zambrano González
13
Ajuntament de Barcelona
EPIDEMICS AND
DENSITYMORTALITY
RATIO
OPENING OF THE PRINCESA
FERRAN AXIS
CERDÀ PLAN. REFORM AND
EXTENSION PROJECT
SUBSOIL SANITATION PROJECT.
GARCIA FÀRIA
FLOODS
EL CARMEL CRISIS
POWER CUT
1ST HOLDING
TANKS
RESILIENCE
COMMITTEES
INFRASTRUCTURE
AND SERVICE
DIAGNOSTIC
1859
18201910
1859
1893
1999
2005
2007
1999
RESILIENCE
TIMELINE IN
BARCELONA
The progress of resilience in Barcelona
Figure 1: Resilience timeline in Barcelona.
DROUGHT
CLIMATE PLAN
HEAVY SNOWFALL
RESILIENCE
PROGRAMME
UNHABITAT CRPP
MAKING
CITIES RESILIENT
CAMPAIGN
CUESB
(SOCIAL
EMERGENCIES
CENTRE)
MG RESILIENCE
STRATEGY
DEPARTMENT RU
2006
2008
2018
2030
2010
2012
2013
2014
2016
2018...
2014
2017
TERRORIST ATTACK
ON THE RAMBLA
1.3
Process:
Institutionalising resilience
The Department of Urban Resilience was established in February 2014, within the area currently known as Urban Ecology, which comes under the Deputy Mayor’s Office for Ecology, Urban Planning and Mobility (see Figure 2, ‘The Department of Resilience within the municipal organisational chart’).
Presented at the Commission for Ecology, Urban Planning and Mobility on 17 February 2016, the urban-resilience government measure was approved with the consensus of all municipal political parties. The government measure incorporates the principles of the Barcelona resilience model and all the initiatives which, governed by their strategic goals, are being
Figure 2. The Department of Resilience within the municipal organisational chart
Barcelona Department of Urban
Resilience
Urban-resilience government
measure
implemented in this area. See the document here: https://www.slideshare.net/Barcelona_ cat/mesura-de-govern-resilincia-urbana
The Area of Ecology, Urban Planning and Mobility is responsible for providing the municipal services linked to public spaces and the services that make life easier for residents living and working in the city. Ecology has become a key factor that has pervaded all development and transformation policies: local urban planning, sustainable mobility, management and maintenance of urban services (water, greenery, waste, energy), and public highways.
The department is made up of three areas. The Deputy Manager’s Office for Environment and Urban Services manages the provision of urban services and maintenance of the environment
in accordance with the city's commitments to preserving and improving the quality and sustainability of the environment, fighting against climate change, and enabling an active, healthy and sustainable quality of life for the people.
The remit of the Deputy Manager’s Office for Urban Planning is to maintain and develop the harmonious organisation and planning of the city as an entity under constant change and expansion, guaranteeing development in line with the needs of the population and the city.
The Deputy Manager’s Office for Mobility and Infrastructures ensures the smooth running of the city and coordinated action in infrastructures and public spaces, as well as maintaining the impetus to develop a sustainable and active mobility.
17
Ajuntament de Barcelona
Urban greenery and biodiversity
Quality of life also means a greener city, where everyone can enjoy contact with the natural world
close to home. Urban green spaces bring ecological values that are essential for the city, such as
closeness to nature, biodiversity, complexity and connectivity. They also have socio-cultural values
by improving health and well-being, and promoting beauty, culture and social interaction. The most
important plans and projects include the Greenery and Biodiversity Plan, the Woodland Master Plan,
the Green-Infrastructure Impetus Plan, in addition to initiatives for living terrace roofs and green
roofs, and for animal well-being.
Environment and public space
The city is made up of a series of systems under a constant process of evolution and improvement
in order to adapt to the population’s changing needs. Urban improvement plans oversee the
provision of high-quality urban services and the regeneration of urban areas for the benefit of
those living and working there. Of note are the Air-Quality Improvement Plan, the Comprehensive
Lighting-Renovation Plan, the Noise-Pollution Reduction Plan, the Public-Space Redevelopment
Plan, the ‘Barcelona dona molt de joc’ programme, the Children’s Corner Plan and the decision to
eliminate aggressive pesticides for the sake of health and the environment.
It is through the Area of Urban Ecology that the City Council seeks to ensure the provision of high-quality public spaces and an active and sustainable mobility stimulated and sustained by the residents’ involvement and commitment. A series of strategic courses of action have been defined in order to achieve these goals.
Urban planning for neighbourhoods
The city has become a large metropolitan area with the same requirements of neighbourhood
cohesion and environmental sustainability as any other major European city. It is crucial that
development avoids creating rifts between neighbourhoods and ensures that everyone has the
same opportunities wherever they live in the city. This will be achieved through the generation
of environments including a network of local spaces that will prove indispensable for social
involvement to the benefit of the health and well-being of the local people. We have an ongoing
commitment to one of the city’s most treasured assets, public space, and have implemented a
series of plans, including the Empty Land Site Plan, the Superblocks project and the new view of
urban planning from a gender perspective. A number of iconic projects have been implemented,
such as reclaiming the Model prison, Plaça de les Glòries, St Antoni market and its surroundings,
Park Güell, Avenue Meridiana, the Pere IV hub, and the transformation of the Vallcarca and Marina
del Prat Vermell neighbourhoods.
Energy and climate change
A resilient city is one that is flexible and open to progress. It looks forward to a positive future
because it establishes the conditions and resources essential not just to maintain but to improve
its quality of life. The Climate Plan, the Alternative Water Resources Plan, the Energy-Transition
Strategy, the Municipal Waste-Prevention Plan, the More Sustainable Barcelona Network, facilities
such as La Fàbrica del Sol and the application of regulations such as environmental clauses for
public procurement are elements making a positive contribution to improving the city’s capacity
for tackling the challenges of the future in the uncertain scenario of ongoing climate change.
International projects
Together with other benchmark cities, enterprises and organisations in the respective activity sectors,
the City Council has been launching and taking part in projects relating to ecology, urban planning and
mobility. It is also involved with international bodies working to improve cities and their citizens' quality
of life, participates in international networks and establishes collaboration agreements for promoting
projects with benchmark cities and bodies. It takes part in projects with European (EU) funding – such
as EU Cities Adapt, Procura + (Sustainable Public Procurement) – and in international networks such
as ICLEI, European Sustainable Cities and Towns Campaign, Local Action for Biodiversity (LAB), World
Federation of Rose Societies, World Water Council, Association of Cities and Regions for Recycling and
Sustainable Resource Management (ACR+), C40 Cities Climate Leadership Group, Medcité, UN-Habitat
and 100 Resilient Cities.
Citizen compromise
Barcelona is an open and welcoming city and the City Council actively promotes initiatives and
opportunities that give a voice to the diversity of the communities living in it, so that the general
public, groups, organisations and individuals can all get involved in the city’s transformation and
development. The Citizen Commitment to Sustainability – More Sustainable Barcelona, the Citizen
Council for Sustainability, the Committee Against Air Pollution and the Mobility Pact have all helped to
bring about community involvement, participation and collaboration in municipal projects.
Despite its coming under the Fifth Deputy Mayor’s Office, the Department of Urban Resilience works at a cross-cutting level throughout the municipal organisation, and its collaborative work with the Areas of Security and Prevention and Social Rights is especially important.
Sustainable mobility
Quality of life also means returning the streets to the people. We are working towards a
traffic-calmed and well-connected Barcelona that fosters a pedestrian- and cyclist-friendly mobility
that is not just sustainable, safe and accessible to everyone but also capable of reaching
every corner efficiently and cleanly. We have implemented many notable projects and plans,
including the Urban Mobility Plan, the Bicycle Strategy Plan, the new bus network and the
Electric Vehicle Master Plan.
19
Ajuntament de Barcelona
1.4
Barcelona's resilience model
Our vision
We want to turn Barcelona into a resilient city in every area that affects the lives of its citizens. We will be capable of rising to the challenges of today and tomorrow, and of intervening to discard or extend any boundaries that constrain us from developing the city model we wish to build.
At the very heart of our resilience policies is the goal of facilitating the integration into society of the most vulnerable groups and individuals.
Our vision guarantees the safety and quality of life of both citizens and visitors, using experience as a foundation and proactively developing opportunites and incorporating new elements as a result of that experience.
Mission and goals
1. Contributing to boosting the municipal political leadership based on the culture of resilience, in both the city and metropolitan area and in relation to the other public authorities.
2. Working to improve the capacity of the city to minimise the impact of crisis situations. This is done by reducing the response time to acute circumstances, and improving the recovery time to the city's original state or
equivalent. Each crisis is viewed, as much as possible, as an opportunity to make improvements.
3. Reducing the city’s weak points by establishing creative, preventive initiatives that eliminate the original cause of the problem, or minimise the impact of the stress and disturbances it creates, strengthening the city's ability to resist similar events and ensuring that essential services are maintained to provide the fundamental facilities to the population during any untoward event.
4. Providing the city with the appropriate mechanisms for detecting and evaluating in advance the risks that it has to manage.
5. Providing useful information and tools for improving knowledge of the what is happening in the city to support the decision-taking processes on both operational and strategic levels.
6. Integrating the principles of resilience into each of the city’s transformation, management and maintenance projects and processes, empowering expert teams to put resilience at the heart of their decision-making, and committing all external participants to acting in the same way.
Ongoing improvement
The urban resilience model rests on three cornerstones that correspond to the three stages making up the ongoing-improvement cycle for creating resilience: managing risks, through the Urban Space’s Operational Centre and coordination with the city’s other control centres; risk analysis, through the resilience information and analysis management platform, and risk reduction, through resilience committees.
According to this system, the process starts through a coordinated management of emergency incidents and situations made by the various municipal centres.
The second stage concentrates on analysing and managing the information collected and using the conclusions drawn to define the city's problems.
Finally, the projects implemented in the third stage consist of initiatives to eliminate, where possible, any weaknesses discovered in the systems or procedures, or to introduce improvements that reduce the seriousness
of their impact and prevent the same thing happening again. This strengthens the city's capacity to respond in the event of exceptional or emergency situations.
At the same time, work is being carried out on the city's resilience strategy to provide a coherent framework for the individual projects. This involves establishing common work and resource methodologies that conform to the resilience model, and designing the plans for moving forward in the medium and long term.
On a broader scale, several key collaborations have been established with multi-lateral bodies and city networks that are leading benchmark initiatives in this area. Liaisons with these cities and institutions fosters positive exchange of experience, knowledge and good practices. Collaborators include: the UN-Habitat Office of Resilience with its headquarters in Barcelona, through the CRPP; UNISDR, as a member of the Developing Resilient Cities campaign, which recognised the city as a Role Model City for Infrastructures and Urban Services in 2013; the 100 Resilient Cities programme; and the C40.
Figure 3.
The urban resilience
model as an
ongoing-improvement process
1. Risk management
Control centre
Managing the city’s incidents and municipal emergency plans
Strategic planning for increasing
the Barcelona resilience framework based on implemented tools and experi-ence gained
International collaboration for
sharing experiences and knowledge with other cities and for cooperating with international organisations
2. Risk analysis
Resilience platform
Digital platform for supporting decision-taking and improving emergency procedures and the management of critical situations
3. Risk reduction
Resilience Committees
Implementing projects to reduce or eliminate detected vulnerabilities
+
Ongoing improvement towards urban resilience PR CC MR CC 21Ajuntament de Barcelona
Services of the Department of Resilience
1.
Resilience committees offer a technical
secretariat service for implementing
cross-cutting, risk-reduction projects.
Resilience committees have built up a network of contacts over the years with the main
internal and external players responsible for planning and operating urban services,
for the purposes of implementing projects that help to reduce or eliminate detected risks. Notable examples of such projects include the protocols with service-provider companies for communicating critical failures in the supply of water, electricity or
gas, and the classification and mapping of the city’s sensitive facilities in the event of
an emergency.
2.
Access to tools and information for
improving the efficiency and quality of urban
services through the DIVE-Situation Room
platform.
The DIVE-Situation Room platform is designed to improve our knowledge of services
and our capacity to analyse a situation before taking a decision, whether strategic
or operational, which improves the city’s efficiency and supports, through reasoned argument, the decision-taking processes for urban planning, transformation and management.
3.
Possibility of conducting studies or
analyses geared to strategic planning.
We at the Department of Resilience are promoting and conducting studies that enable
us to evaluate and take a deep look at the city’s problems or concerns, as well as to explore the risks that we predict could affect us in the future, so that we can prepare and adapt the city to mitigate their impact.
In other words, we need to collate all the available information in order to improve our
planning and decision-making. We we are putting our methodologies and resources at the disposal of the City Council, so it can continue exploring deeply into new areas of interest.
The Impact Study on Climate Change in Barcelona, conducted in collaboration with
Barcelona Regional, the Catalan Meteorological Service and the Public Health Agency,
among other bodies, and in collaboration with the UN-Habitat’s City Resilience Profiling
Programme for developing Barcelona’s resilience profile, are good examples.
4.
Sharing of knowledge generated by the
studies.
We are helping to disseminate and make accessible any new information that municipal experts consider of interest.
The Resilience Atlas aims to bring together and distribute information on various
aspects of the different areas of the city which are considered to be of general
interest. By publishing different kinds of maps (the results of vulnerability studies or
analyses, such as the Impact Study on Climate Change), the aim is to disseminate and
help to improve the knowledge we have on our city, to support the decision-making
processes and establish an information base for future studies.
5.
Network of contacts with other benchmark
cities and institutions for sharing knowledge,
good practices and expert advice.
Embracing the need to learn, we at the Department of Resilience have collaborated
with other cities that are taking on similar challenges. Together we have invested
efforts into finding more effective solutions to common problems. The exchanges
made with cities from the 100 Resilient Cities network, through UN-Habitat, and C40
working groups have been used to inspire and share challenges and solutions to
urban problems, such as climate change and effective city management.
Credit icons: romzicon, joeartcon, Gregor Cresnar, Ralf Schmitzer, Josh Sorosky of the Plataforma Noun Project
23
Ajuntament de Barcelona
1.5
Barcelona’s resilience strategy
Barcelona's resilience strategy must relate to all the various sectors of involvement, and encompass every initiative and measure promoted by the City Council, integrating them so they complement each other. It can do this because resilience offers a comprehensive and holistic perspective.
A clear example of this is the Climate Plan, which in itself is already an umbrella plan for all the initiatives that the city is fostering on mitigation, adaptation and promotion of social equality in the face of climate-change risks.
Figure 4. The resilience strategy and Climate Plan
25
Ajuntament de Barcelona
2.
Credit: Ajuntament de Barcleona, Paolo de Grenet
A city between sea and mountain, Barcelona is wedged between the Catalan coastal range, the Mediterranean sea, the river Besòs and Montjuïc mountain.
A compact city, one of the densest in Europe, it has 1.6 million residents in an area of 101.3 km2 and with a metropolitan area housing over 3.2 million residents.
Mediterranean city, both for its benign climate and for its location on the Mediterranean sea, with one of the most important ports in Europe and the world in terms of numbers of passengers.
City of services that, within a century, has grown from an industrial base to a tertiary, highly specialised foundation in tourism, and which has doubled its number of visitors in the last decade alone.
2.1 Barcelona
now
Socio-economic and environmental indicators
City and economic centre with an area of influence that goes beyond the city's metropolitan area, extending to the whole of Catalonia.
Distribution of wealth
Disposable household income (DHI) measures the income of households for use to spend or to save. Barcelona’s annual average per capita DHI is 20,800 euros (datum from 2016). As for districts, Sarrià-St Gervasi has the highest DHI index (182.4 euros) and Nou Barris has the lowest (55 euros). As for the entire city, 16.7% of the population has an income in the highest bands (over 126% of Barcelona’s DHI); 47.9% in the middle bands (between 79% and 126% of Barcelona’s DHI), and 35.5% in the lowest bands (below 79% of Barcelona’s DHI).
Barcelona has amassed a considerable volume of information on a broad spectrum of topics to help to define its current social, demographic and environmental situation.
Several studies have also been conducted to analyse its level of vulnerability in the face of various types of acute shock or chronic stress the city either has been experiencing or which
could occur in the future. The most important of these for the Resilience Strategy’s development process are summarised below.
The second stage is expected to include a more in-depth examination of any topics we feel have not been researched sufficiently to ensure that we have all the necessary information in our possession.
157.47
people/ha28.32
km2 of greenery4,703
m of beaches10.216
haTerritory
Climate
20.8
ºC
maxiumum average temp
14.3
ºC
mimumum average temp2.867
sunshine hours/year (2015)70 %
relative humidity (2015)587
mm annual average precipitationSocial and
economic
indicators
Population
9,065,650
tourists1,608,746
inhabitants83.9
years life expectancy (2014)22.47 %
% foreign-national population19,162,580
overnight stays +8 64 5 14 Population pyramid 21 % 65.7 % 12.6 %€77,605
million total GDP (2015)74.4 %
employment rate11.6 %
unemployment rate3 %
Construction7.2 %
Industry89.7 %
Services€19,335
disposable household income per capita (2015)19.2 %
risk-of-poverty rate (2015) 37.8 % University 18.0 % Secondary professional 19.3 % Secondary general 20.9 %Compulsory Completed compulsory
3.8 %
Level of studies
71.2 %
17.6
ºC
annual average temp
attended to by free public health services
29
Ajuntament de Barcelona
Life expectancy
The average life expectancy in Barcelona, according to data from 2015, is 83.9 years. There is a direct relationship between this figure and health, social and economic levels. A comparison between the districts reveals a difference of 4.3 years between the life expectancy of the district with the lowest value (Ciutat Vella, 81.4 years) and that of the district with the highest value (Les Corts, 85.7 years).
Access to water and energy
Nou Barris and St Andreu are the city’s districts with a lower DHI, and it is in these areas that the local people who use the social service centres (SSCs) suffer higher levels of energy poverty (66.2% and 65.1%, respectively). SSC users in the districts with a higher DHI, such as Sarrià-St Gervasi and Les Corts, boast less energy poverty (35.05% and 39.10%, respectively). On the other hand, according to the 2016 Barcelona Health Survey from the Barcelona Public Health Agency (BPHA), the district with the highest energy poverty is Ciutat Vella and the district with the lowest is Les Corts. These two
sources of information suggest that there is a big difference in the income of the residents of various districts in Barcelona, and that this has consequences on access to water and energy.
Note too that the trend in distribution of income over the last few years has accentuated the inequality, revealing a polarisation of the population at the extreme ends of the very low and very high income bands.
Poverty
The last few years have seen a series of significant social and economic changes that have transformed patterns of poverty. One of the consequences of the crisis has been an increase in the population falling below the poverty threshold. In Barcelona’s case, according to the Health in Barcelona (2016) report prepared by the Public Health Agency, 9% of households live in severe material poverty and 10.6% suffer energy poverty.
Environmental
2.08
t CO2-e
emitted/inhab. (2014)
17.59
m2of greenery/inhab.
9.75
MWhof energy
consumption/inhab. (2014)
107.5 l
(2014)
1.3
kgof waste (inhab./day)
162.5 l
of water (inhab./day)
8.04
millionjourneys/day
Internal journeys (2015)
Connecting journeys (2015)
Annual averages
NO
2: 39
μg/m3PM
10: 24
μg/m3PM
2.5: 13,8
μg/m3Source: Data from Barcelona City Council. Where the date is not stated, the figures correspond to 2016.
of water/inhab. in domestic sector
31
Ajuntament de Barcelona
Homeless population and
temporary accommodation
Increases in the homeless populations and residential exclusions are an alarming reality all over Europe, and Barcelona is no exception. This increase is having an impact in particular on certain social groups facing specific difficulties when it comes to guaranteeing their right to housing: single-parent families, immigrants, young people, and individuals and groups who, before the crisis, were already finding themselves in a highly vulnerable situation.
According to data from the annual report entitled Diagnosis 2017. The situation of homelessness in Barcelona. Development and access to housing, there are over 3,400 homeless people in Barcelona. The Homeless Persons Assistance Network states that 962 sleep directly in the street, 444 in temporary accommodation (such as squats) and 2,006 depend on existing public and private resources for having somewhere to spend the night.
The profiles of Barcelona’s homeless are as follows:
• 90% are men and 10% women
• 54% are Spanish
• the average age is 42.7 and the life expectancy is 58
58.5% have children
• 44.5% have been homeless for over three years
• 50% of them are looking for work; 60% studied to secondary-education level and 12% to a higher level
• 20% have no health card; 79.2% suffer from physical or mental disorders
• 50% have been victims of a crime or assault
As regards irregular settlements in Barcelona (2017 Report on Settlements, Department of Social Intervention in Public Spaces (DSIPS)-Manager’s Office for Social Rights), the growing trend over the last few years has resulted in 444 people living in 68 settlements. As for origins, only 4% are of Spanish nationality, whereas the Roma community from the east of Europe and the Galician-Portuguese Roma community represent 43% and 26%, respectively, of the total, followed by groups such as North Africans and individuals from Sub-Saharan Africa, 6% and 7%, respectively, whose numbers have seen a considerable drop over the last few years. The high level of social vulnerability and difficulties in accessing housing that these groups face make it enormously difficult for them to start the process of changing and improving their situation. In the case of Roma groups, there is the additional factor of their nomadic lifestyle, which makes it hard for them to put down roots in an area. Also relevant is the fact that they are establishing themselves in areas where they can make a living through subsistence activities, such as scrap-metal or cardboard collecting. Irregular work tends to result in them occupying sub-standard housing, such as abandoned buildings and other spaces, and even out in public streets, which often involves health and safety risks for the occupiers themselves. By district, St Martí plays host to 60% of the city’s temporary settlements, followed by Gràcia (11%) and St Andreu (10%).
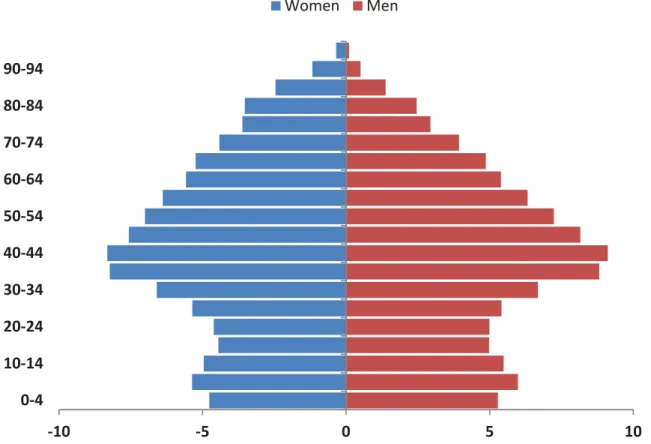
Population ageing
As can be seen from the following figures, the the overall population is ageing and the growing number of elderly people is becoming increasingly relevant in the city and a factor to be taken into account over the coming years.
Figure 5. Barcelona’s population pyramid (2015). Source: IDESCAT
0 2 4 6 8 10 12 14 16 18 20
1975 1980 1985 1990 1995 2000 2005 2010 2015 2020
Figure 6. Development of percentage of people > 64 years in Barcelona (2015). Source: Barcelona health in the neighbourhoods presentation. Interventions with elderly people, Barcelona Public Health Agency
-10 -5 0 5 10
0-4 10-14 20-24 30-34 40-44 50-54 60-64 70-74 80-84 90-94
Women Men
33
Ajuntament de Barcelona
Figure 7. Percentage of people > 74 years living alone. Source: Barcelona health in the neighbourhoods presentation. Interventions with elderly people, Barcelona Public Health Agency
Low
quality
of life
Morbidity
Emotional distress
Low social
participation Isolation and
loneliness
Figure 8. Possible consequences of an increasing percentage of the ageing population living alone. Source: Barcelona health in the neighbourhoods presentation. Interventions with elderly people, Barcelona Public Health Agency
This is why assistance will have to be given to this group of people, taking other relevant factors into account, such as their state of health, level of independence, the number of
people in this age bracket living alone, and so on, as well as aspects relating to living in the city, which may result in this population’s social isolation and loss of quality of life.
Figure 9. Tourism in Barcelona
Tourism
Tourism is one of Barcelona’s most important commercial activities. It is a priority for the municipal government, not just for the contribution it represents to the city’s economy, around 12% of its GNP and 14% of its jobs (Impacto económico del turismo en Barcelona, University of Girona, 2013), but also for the various effects that it has on the urban dynamic. These factors include localised overcrowding in areas that are highly popular with tourists; changes in residential and commercial dynamics in tourist neighbourhoods; job insecurity in the labour market due to the high dependence on the sector; increasing use of infrastructures and services; and coexistence problems between residents and tourists.
Barcelona has grown as an international tourist destination: 30 million annual visitors,
more than 19 million overnight stays per year, close to 40 million passengers travelling through El Prat airport, 120,000 regulated tourist-accommodation places (2016 Diagnosis for the 2020 Barcelona Strategic Tourism Plan). These statistics prove that Barcelona occupies a notable place in Europe’s various city classifications (it comes fifth in number of overnight stays, according to the 2016 ECM Benchmarking Report) and forecasts suggest it will continue to do so over the coming years. Barcelona is and will continue to be a tourist city.
Tourist activities in the city have multiplied over the last few years, proving to be a key factor in the city’s successive transformations. This has prompted a lively debate among the population over the sustainability of tourist development. MORE THAN
30 MILLION
VISITORS/YEAR 123,000 REGULATED ACCOMMODATION PLACES 8.7
IS THE SCORE THAT TOURISTS GIVE BARCELONA
37%
OF TOURISTS USE PUBLIC TRANSPORT
92.3%
OF THE VISITORS’ CARBON FOOTPRINT IS GENERATED IN
AEROPLANE JOURNEYS 46% OF TOURISTS GET ABOUT ON FOOT
17%
DROP IN TOURIST DEMAND (LAST 5 YEARS)
35
Ajuntament de Barcelona
Figure 11. Evolution of Barcelona’s energy consumption and GHG emissions.
Source: 2014 Barcelona Energy Assessment. Barcelona Energy Agency (Barcelona City Council)
Figure 10. Evolution of Barcelona’s energy consumption and GHG emissions.
Source: 2014 Barcelona Energy Assessment. Barcelona Energy Agency (Barcelona City Council)
Energy model and generation of emissions
Barcelona’s energy consumption and GHG emis-sions dropped by 2% and 31%, respectively, be-tween 1999 and 2014, and markedly from 2005, when they reached their maximum level. The con-text of the economic crisis and increase in energy prices contributed to a large extent to the imple-mentation of savings initiatives and good practices that had not been provided for until then. This con-firms that there is a correlation between energy consumption and the socio-economic context.
Barcelona’s energy intensity (which enables the increased GDP to be linked to the increased energy consumption) dropped from 261.64 Wh/euro in 1999 to 215.51 Wh/euro in 2014. This means that
the city was capable of consuming less energy per euro generated.
But what will happen when the economy recovers? According to the latest available data, energy consumption and emission generation rose again between 2015 and 2016. In 2015, energy consumption and emissions were recorded as 15,865 GWh and 3,433,000 tonnes of GHG, respectively, and in 2016, a final energy consumption of 15,633 GWh and 3,443,000 tonnes of GHG, respectively, suggesting an upward trend for the coming years. So a new energy culture must be promoted which disconnects economic growth from energy consumption.
Figure 13. Efficiency of the energy generation and transport system. Source: 2014 Barcelona Energy Assessment. Barcelona Energy Agency (Barcelona City Council).
Figure 14. Primary energy source according to Catalan mix. Source: 2014 Barcelona Energy Assessment. Barcelona Energy Agency (Barcelona City Council)
Figure 12. CO2-e emissions per sector. Source: 2014 Barcelona Energy Assessment. Barcelona Energy Agency (Barcelona City Council).
37
Ajuntament de Barcelona
2.2
Barcelona's
resilience
profile
V1. Preliminary April 2017 profile
V2. June 2018 profile
The UN-Habitat agenda, under the United Nations programme for the development of human settlements, includes the goal of reducing risks and developing urban resilience. To work towards that goal required a coherent, holistic system of assessment and measurement that could define the capabilities of individual areas of activity. The CRPP developed this multi-risk and multi-participant approach, allowing for an evaluation not just of the capacities within each sector, but also of any overall processes that could potentially be liable to chronic stress or actute shocks.
Barcelona took part in a pilot test to define and then adapt practical aspects of development and urban management, based on the knowledge of the existing capability and how much it could be improved.
The available data was collated, merged and adapted to be output in formats that made it easier to extrapolate the information required. This supported our goal of developing a comprehensive vision to plan for, prevent and effectively manage untoward situations.
Following consultations between UN-Habitat and the Department of Urban Resilience (March 2018), the implementation of the CRPT version 2.0 in Barcelona was focused on a series of specific areas of concern for the municipality, and the aim was to avoid duplication by integrating the extensive work previously carried out by the city in the field of resilience.
Four main subjects of interest were therefore chosen:
1. accessibility of the basic services;
2. affordability of the housing;
3. gender equality;
4. poverty.
In each case, the CRPT used its urban-system model to compare, re-organise and diagnose the locally available data and this fed into the long-term development of a Resilience Strategy for the entire city. This stategy is due to be launched in 2019.
This reflects the municipality’s awareness that the socio-economic stress experienced by the city over the last decade had intensified, as well as the local authorities’ commitment to putting greater effort and resources into tackling social exclusion and vulnerability from the perspective of urban resilience.
Table 1 lists the components of the CRPT that were regarded as essential to ensure a comprehensive consideration of these topics.
The ‘built environment’ element of the CRPT has been fully implemented in the city and, as previously, serves as a parallel test on the data, comparing it with that collected by UN-Habitat. By acting as a pilot test, the exercise established
Table 1. Identification of the CRPT’s components relating to the priority areas to be analysed in Barcelona. Source: CRPP, UN-Habitat
the bases for a second analysis stage starting in July 2018.
It is in this context that the following section aims to provide a preliminary examination of the data-collection work carried out by UN-Habitat between March 2018 and June 2018, on each of the above-mentioned issues.
CODE CRPT COMPONENT ACCESS TO
SERVICES
POVERTY and
ECONOMIC EXCLUSION GENDER
HOUSING AFFORDABILITY
1.2 Ownership of the land
1.3 Housing
3.1.1.1 Access to electric supply
3.1.1.2 Electric supply service coverage
3.2.1.1 Access to drinking water
3.2.1.2 Water-supply grid coverage
3.2.21 ĐĐĞƐƐƚŽƐĂŶŝƚĂƟŽŶ
3.2.2.1 ^ĂŶŝƚĂƟŽŶŶĞƚǁŽƌŬĐŽǀĞƌĂŐĞ
3.3.1.1 ^ŽůŝĚǁĂƐƚĞĐŽůůĞĐƟŽŶĐŽǀĞƌĂŐĞ
3.3.2 ĐĐĞƐƐƚŽĐŽůůĞĐƟŽŶƐĞƌǀŝĐĞ
4.1.1 Diversity of modes of transport
4.1.2 Urban mobility coverage
4.1.3 Access to urban mobility system
6.2 DŝŶŝŵƵŵƐŽĐŝĂůƉƌŽƚĞĐƟŽŶůĞǀĞů
6.3 Access to basic social services
7.1 Local economic structure
1. Built environment 89%
3. Basic infrastructure 75%
4. Mobility 96%
ϲ͘^ŽĐŝĂůŝŶĐůƵƐŝŽŶĂŶĚƉƌŽƚĞĐƟŽŶ 30% 7. Economy 86%
39
Ajuntament de Barcelona
Accessibility of the basic services
Housing affordability
Acting in line with the UN-Habitat’s CRPP for basic services and infrastructure analysis, the issue of the accessibility of basic services was tackled by collecting quantitative and qualitative information on the guaranteed coverage for each network and the people’s capacity to afford each service and access it safely.
Urban mobility, solid waste collection, energy supplies, water supplies and waste water were examined from this perspective, combining spatial, demographic and socio-economic figures. Almost all the data requested by each of these services were available to the public, whether through municipal or metropolitan datasets, depending on the jurisdiction.
An initial review of the data at a general level revealed that the problems of accessibility and affordability in Barcelona particularly affected the lower quintile of the population in housing-related public services. In fact, as already pointed out from the sectoral diagnoses of the city’s Climate Plan, energy poverty has rapidly become a subject of concern over the last few years. Local authorities are being pressured into providing financial support for households unable to pay their monthly utility bills to prevent operators from cutting off their energy and/ or water supplies. Although network coverage and the population’s access are 100%, the latest data show several socio-economic barriers to access that require additional breakdown and research.
By contrast, urban public transport appears to be affordable. Area coverage is almost 100% for all the services analysed, while fares do not exceed the affordability threshold for the lower quintile of the population living within the first metropolitan ring.
Housing-related data were collected through the CRPT’s land and housing department and were compared with general demographic and socio-economic information available from the Municipal Department of Statistics.
Here not just the data reported in the diagnostics of the Right to Housing Plan for 2016–2025 but also the indicators collected by the Metropolitan Housing Observatory were of vital importance in gathering information on housing and housing problems in the city. However, we need to take account of the fact that this assessment was based largely on a relatively antiquated housing census (National Institute of Statistics, 2011), and that market prices both for owning and for renting are on the increase.
In fact, all the datasets point to the fact that housing-related expenses represent a large proportion of total household expenditure, exceeding the 30% per annum affordability threshold. This was defined by the Municipal Department of Statistics (2016) as the proportion of average expenditure on housing by household in relation to the total average family income per year. A rapid annual increase in property prices was not matched by a similar increase in household incomes. Therefore the proportion of households in which expenditure on housing was defined as affordable remains slim, despite the 2007 commitment to raise it by 15% for 2025.
Although the estimates vary depending on the criteria used for the analysis, the CRPT data show that the number of affordable dwellings in the city is slightly over 20,000 properties (2.7% of the total), of which 10,522 are for social rent, 10,318 receive public subsidies for renting and almost 2,000 private properties are run by the City Council and allocated as social rented properties. In addition, although some of the figures also include properties which were acquired as subsidised dwellings, or ones that still have official protection, and properties under old lease contracts (approximately 30,000 units), such categories are scheduled to be gradually reduced over the coming years and possibly reabsorbed into the mainstream property market, as also recognised under the Right to Housing Plan for 2016–2025.
Given the socio-economic and rapidly changing housing panorama in the city, and the previously mentioned partial dependency on obsolete census data, there is a need to carry out more research on the composition of the housing market. This would benefit from using the latest and most in-depth data, with the goal of continuing to develop new perspectives on housing and residential exclusion.
Credit: Christophe Faugere
41
Ajuntament de Barcelona
Poverty and social exclusion
Gender equality
The issue of poverty relates to every one ofthe topics analysed throughout the resilience-building process. It is especially important in analysing the point at which economic hardship can prevent certain groups of the population – with special emphasis on the most vulnerable – from satisfying their basic needs.
While the preceding paragraphs provide a few ideas on social exclusion and residential patterns in the city, a comprehensive evaluation of urban poverty through the CRPT’s urban system model is based on information from several parts of the section on social inclusion and protection.
Researchers examined access to and coverage of the existing public social services, but refined the data to show how these impacted on various groups: for example, poverty by age group, persons with health-care needs and the unemployed. They also looked at the benefits and means of protection provided by the local authorities. Even though the overall figures on vulnerable groups were generally accessible, thanks to the support provided by the Municipal Social Emergencies Centre (CUESB), important data were introduced that made it easier to subdivide the data to provide more useful information.
At a general level, the data collected show a greater exposure and vulnerability among older people than in younger groups. According to the figures from 2016, 19% of the elderly population are at risk of poverty, compared to 14.7% of children and 18% of the total population (17% in men and 19% in women). This situation was also made worse because although the coverage of
public pensions in Catalonia is 59% (79% in men and 44% in women), 40% of these pensions are actually below the adequate minimum salary level. This therefore represents an additional factor of exposure to poverty.
We concluded that a general evaluation of social exclusion and vulnerability in the city requires additional research to discover the impact and coverage of the various means of protection already established. We would also need to evaluate whether additional disaggregated statistics are available and accessible.
A comprehensive evaluation was carried out using the Gender Equality Enhancer (a UN-Habitat tool for improving gender equality). In this process, a list of indicators and questions was selected from the eight components of the CRPT’s urban system, all with a gender perspective. They were applied in order to evaluate the available statistics and provide a snapshot of the state of gender equality in the city.
A preliminary display of these figures in this context requires two types of consideration:
• Information was available for almost every one of the nineteen specific gender questions researched. At a general level, the local government’s commitment to improve gender equality and promote the inclusion of women, in particular those in vulnerable situations, reflects well in a series of protection and prevention measures.
Less encouraging is the trend highlighted on the gender gap in incomes and pensions, registered at 78% and 76.3%, respectively (women’s income/ pensions as a percentage of men's income / pensions, 2016). This figure, however, is lower than the national rate for the gender salary gap, which is 86%.
• On the other hand, the process revealed considerably less availability of data disaggregated by sex in almost every one of the CRPT’s components analysed; especially with regard to inclusion and social protection.
In other words, even though the basic demographic information was generally accessible for both sexes, it proved challenging to obtain disaggregated figures for age groups and vulnerable groups of the population differentiated by age.
Pride Barcelona 2018 Credit: l‘Ajuntament de Barcelona
43
Ajuntament de Barcelona
Availability of data and future
steps
The information discussed so far captures the state of progress of the data-gathering process from June 2018 onwards. It illustrates the obstacles encountered during the process and outlines the main conclusions on the basis of a preliminary examination of the information.
The advances were presented by UN-Habitat at a workshop (2–3 July 2018), which brought together representatives from Barcelona City Council, Barcelona Regional and 100RC, with the aim of combining municipal and extra-municipal workflows in a coherent resilience strategy for the city.
In some cases – for example, basic service coverage – the responses were so close to 100% that it was reasonable to apply the same value to the male and female population, creating an estimate for the disaggregation. In other situations – mainly in inclusion and social protection, though not exclusively so – this interpolation would be inaccurate and therefore specific research would be required on the nature and proportion of the data series.
Table 2. State of completion of the data by component, with regard to cross-cutting types of stress. Source: CRPP, UN-Habitat
95% 60%
100% 84% 100%
0% 0% 0%* 0%
0% 0% 0%*
100% 100% 100%* 100%
100% 100% 100%*
100% 100% 100%* 100%
100% 100% 100%*
100% 100% 100%*
100% 100% 100%*
100% 0%*
100%
87% 100% 100%*
30% 86% 86%*
5% 5%
84% 84% 70% 80%
1.2 1.3 3.1.1.1 3.1.1.2 3.2.1.1 3.2.1.2 3.2.21 3.2.2.1 3.3.1.1 3.3.2 4.1.1 4.1.2 4.1.3 6.2 6.3 7.1
1. Built environment 89%
3. Basic infrastructure 75%
4. Mobility 96%
ϲ͘^ŽĐŝĂůŝŶĐůƵƐŝŽŶĂŶĚƉƌŽƚĞĐƟŽŶ 30% 7. Economy 86%
Ownership of the land Housing
Access to electric supply Electric supply service coverage Access to drinking water Water-supply grid coverage
ĐĐĞƐƐƚŽƐĂŶŝƚĂƟŽŶ ^ĂŶŝƚĂƟŽŶŶĞƚǁŽƌŬĐŽǀĞƌĂŐĞ ^ŽůŝĚǁĂƐƚĞĐŽůůĞĐƟŽŶĐŽǀĞƌĂŐĞ ĐĐĞƐƐƚŽĐŽůůĞĐƟŽŶƐĞƌǀŝĐĞ
Diversity of modes of transport Urban mobility coverage Access to urban mobility system
DŝŶŝŵƵŵƐŽĐŝĂůƉƌŽƚĞĐƟŽŶůĞǀĞů
Access to basic social services
Local economic structure
CODE CRPT COMPONENT ACCESS TO
SERVICES
POVERTY and
ECONOMIC EXCLUSION GENDER
HOUSING AFFORDABILITY
The workshop concluded with the identification of a series of key areas for further development and research, including, though not limited to, the four types of urban stresses tackled by UN-Habitat, and resulted in a roadmap for developing the second stage of the agreed strategy, put into practice from 2018.
Here the two tables show the completed state of the collected data presented during the workshop, on which basis we will move forward.
Line L5 on the Metro Credit: TMB
21
27
23
6
77
94
73
79
Access to
services
Poverty and
social exclusion
Gender
Affordable
housing
Available data
Unavailable data
Table 3. Completion state of data availability by sector Source: CRPP, UN-Habitat
45
Ajuntament de Barcelona