Journal of
Hydrology
ELSEVIER Journal of Hydrology 167 (1995) 307-326[1]
An integrated software environment for real-time use o f a
distributed hydrologic model
Luis Garrote, Rafael L. Bras*
Ralph M. Parsons Laboratory, Department of Civil and Environmental Engineering, Room 1-290, Massachusetts Institute of Technology, Cambridge, MA 02139, USA
Received 28 May 1993; revision accepted 25 July 1994
Abstract
The software environment developed to use a distributed rainfall-runoff model in real time is described. The package, called Real-time Interactive Basin Simulator (RIBS), manages the real- time operation of the simulation model, providing several modes of user access to data, results and intermediate states. The user interface can generate hydrographs at any point within the basin, display the time evolution of model variables for any grid element, or represent the spatial distribution of basic or derived variables.
I. Introduction
This paper focuses on the software environment required for the integration o f distributed rainfall-runoff models in decision-support systems for flood forecasting. A real-time flood forecasting system must combine a data acquisition system and state-of-the-art hydrologic modeling to provide the decision maker with the best information possible. Since the decision-making process must be carried out in real time, the availability o f an adequate software environment is very important to facilitate the task o f model users, especially if the operation involves the use of complex and data-intensive distributed models (Loucks et al., 1985).
The objective of the work presented in this paper is the implementation of a distributed model in a flood forecasting system for midsize or large basins. Physically based distributed models are complex modeling tools (Goodrich and Woolhiser, 1991). Their inclusion in real-time decision support systems is a challenging task because their results are uncertain. Strong assumptions and great simplifications
* Corresponding author.
0022-1694/95/$09.50 © 1995 - Elsevier Science B.V. All rights reserved
308 L. Garrote, R.L. Bras / Journal of Hydrology 167 (1995) 30~326
are required to formulate the r a i n f a l l - r u n o f f modeling problem in terms that can be represented in a computer. Insufficient knowledge o f the physical processes, simplify- ing assumptions and lack o f adequate calibration data introduce errors in the model- ing process which lead to uncertainties about model predictions (Beven, 1989). Despite their uncertainty, model results are still used by decision makers because they codify our best knowledge and represent the best way to interpret the available data. However, in order to make the model useful as a decision-support tool, its real- time implementation must allow the user not only to access model results but also to trace and understand how those results were produced. This goal requires that we rethink the way hydrologic models are included in real-time computer environments, focusing on the issues o f m o d e l - u s e r interaction.
Progress in software engineering during the last two decades has produced methodologies that can greatly improve the way in which distributed models are designed and implemented (Brown and Chandrasekaran, 1989; Widman et al., 1989; Wilhelmij, 1991). Following those guidelines, this paper presents a software architecture for real-time distributed modeling. A prototype system, called Real-time Interactive Basin Simulator (RIBS) is presented. The system manages the real-time use o f a distributed rainfall-runoff model, the Distributed Basin Simulator (DBSIM), presented in a companion paper (Garrote and Bras, this issue). The objective o f RIBS is to provide a flexible and versatile computer environment in which D B S I M can be used under a wide variety o f conditions and in which the user can have access to all the details of the modeling process in real time.
2. Design objectives and system overview
A description of the functional organization o f RIBS and a discussion of its high- level operation is presented first. The RIBS software package operates the D B S I M in real time, addressing the issues o f time coordination and easy user access to model results.
F r o m the point o f view o f hydrologic modeling, the design objective o f RIBS is to use D B S I M to obtain independent estimates o f basin response to observed and forecasted rainfall. Given the state-space formulation o f DBSIM, RIBS simulation with observed rainfall can advance in parallel with the storm, obtaining a new incremental basin response every time new rainfall observations are available. The computation o f basin response to forecasted rainfall in RIBS is optional, and several rainfall forecasts o f different duration can be included. Several possible scenarios can be analyzed by combining different future rainfall alternatives associated with different probability levels.
L. Garrote, R.L. Bras / Journal o f Hydrology 167 (1995) 307-326 309
obtaining hydrographs at selected locations or generating local reports o f model variables.
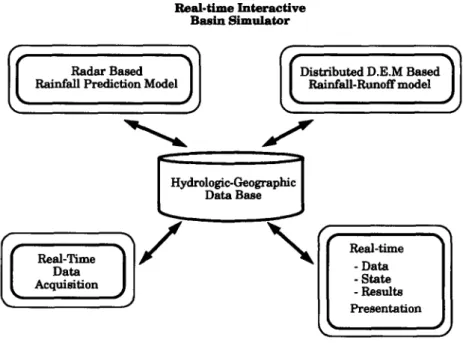
With the aforementioned goals in mind, the implementation o f RIBS was based on a modular architecture. Monitoring the time evolution o f a flood is essentially a cyclic task, in which the same activities are repeated as new data become available or as new forecasts are required. Best use o f computer resources is achieved if system inference is split in several modules which are run in parallel in a multiuser environment. The architecture o f RIBS is based on the cooperation o f four kinds o f system modules acting on a c o m m o n database, as represented in Fig. 1. The core o f RIBS is composed o f the three tasks necessary in a real-time flood forecasting system: data acquisition, rainfall prediction and r a i n f a l l - r u n o f f modeling. Since these tasks share and transfer information, a c o m m o n data storage is also required. Furthermore, the user must gain access to the system through an adequate interface, which introduces an additional task: u s e r - m o d e l interaction.
These modules are independent and can be combined in different ways, in order to gain maximum flexibility. On top o f them, a supervisor module, the general manager, controls high-level model inference. The general manager organizes and coordinates the performance o f individual modules to achieve specific goals. Functional require- ments for each type of module are described below. The role o f the supervisor module is discussed in detail later.
Rainfall acquisition modules (RAM) - - these scan the real-time data acquisition network and extract rainfall information. The goal is to generate periodically a distributed description of measured rainfall. Rainfall information may come from a
R e a l - t i m e I n t e r a c t i v e B a s i n S i m u l a t o r
Rainfall Prediction Model ~ Rainfall-Runoff model
Real-Time D a t a Acquisition
7
Data
Base ~ J
R e a l - t i m e - D a t a - S t a t e - R e s u l t s
P r e s e n t a t i o n
1
310 L. Garrote, R.L. Bras / Journal of Hydrology 167 (1995) 307-326
raingauge network, radar images or both. The R A M analyze raw information and make it available to the rest of the system in a format understood by all other modules. The R A M also take care of data verification, checking input information for consistency and filling in the errors or blanks in the data received.
Rainfall forecasting modules ( R F M ) - - these analyze measured rainfall and generate rainfall forecasts. They take as input the rainfall description generated by the R A M and, possibly, other meteorological information. The output is expected future rainfall, with additional attributes, such as time of validity or probability o f occurrence. The R F M may include one or several forecasting procedures, and they do not have to be limited to generating just one set o f results. In fact, user-defined future rainfall alternatives may be included through an interface module.
R a i n f a l l - r u n o f f transformation modules ( R R T M ) - - these transform rainfall information into streamflow predictions at one or several points within the river basin. R R T M are used as a decision making tools and their operation is conditioned by the state of the situation. R R T M must have flexibility to offer detailed information at different points in the basin at the user's request, reacting to the evolution o f the storm.
User interface modules - - while the other modules are running, driven by the availability o f new rainfall information, the user must also have access to intermediate model results, and be able to obtain reports about different variables regarding basin state. The user interface modules (UIM) extract high-level descriptions o f basin state from the database. The interface modules contemplate two types of users: software clients and h u m a n users. Both use the functions provided by the U I M to access model results. An adequate user interface design enhances the possibilities o f communication between different software applications and facilitates the processes o f model development and calibration.
RIBS modules can be combined in various ways to build decision support systems o f different levels o f complexity. F o u r basic scenarios are contemplated:
(1) calibration mode, in which the model is used to perform several simulations with the same storm data and different model parameters;
(2) simulation on line mode, in which the model in simulation mode is connected to the real-time data acquisition module to present results in real time;
(3) forecasting on line mode, in which the model also obtains and presents results using forecasted rainfall;
(4) forecasting off line mode, in which the model is run in forecasting mode, but with a pre-existing rainfall information.
L. Garrote, R.L. Bras / Journal o f Hydrology 167 (1995) 307-326
3. Software architecture
311
Software design for RIBS was conceived for a workstation environment running the UNIX operating system as the target platform. The UNIX operating system was selected for its facilities for multitasking and interprocess communication. The code was written in C language, following an object-oriented design methodology (Cox, 1986; Stefik and Bobrow, 1986). Software development for RIBS was based on the concepts of procedural and data abstraction (Abelson and Sussman, 1985). Data abstraction refers to the process of grouping individual pieces of data into self- contained units of distinct meaning. This collection of information configures an object which is manipulated symbolically by programs dealing with it. Procedural abstraction refers to the process of decomposing a complex problem into characteristic tasks which are handled symbolically by the system.
An overview of the design framework is given first. Then, the process organization is presented and the role of the general manager is discussed. Finally, the mapping of hydrologic concepts into software entities is briefly described.
3.1. The hierarchical design
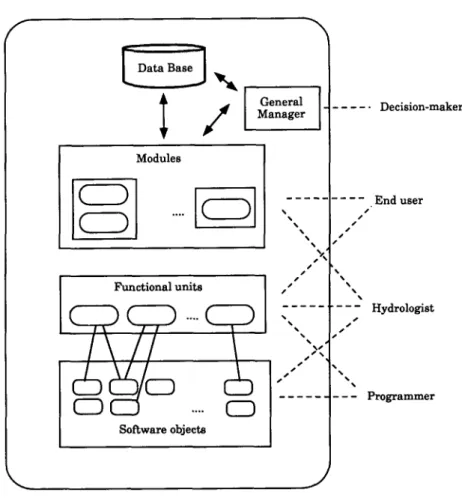
RIBS architecture follows a hierarchical design, as shown in Fig. 2. System design can be analyzed at three levels: modules, simulation tools and software objects. The modules match the user's perception of the system, the simulation tools correspond to the hydrologist's analysis and the software objects are the programmer's building blocks.
RIBS modules are a family of executable programs that operate jointly in the same environment, sharing a database and controlled by a general manager. A module is an operational unit on its own that accomplishes one of the basic tasks described in the previous section. The group of modules is a loosely coupled collection of elements, in the sense that each module is self-contained and module interface is kept as minimum as possible, in the form of a message protocol.
The modules utilize simulation tools to perform their tasks. Simulation tools are abstractions of hydrologic processes that are directly mapped into software functions. The main difference between modules and simulation tools is that simulation tools do not produce results by themselves and are closely interrelated, whereas modules are entirely self-contained. Simulation tools are tightly coupled, in the sense that there are strong interactions among them involving intensive data transfer or sharing.
312 L. Garrote, R.L. Bras / Journal of Hydrology 167 (1995) 307-326
f
I/[
GeneralM a n a g e r
Modules
%% %
. . . Decision-maker
. . . . E n d user
g g
Functional units ," .... ...
. . . . % s
%%% s S
s ` % ' s S s S %%
.. . .. .. . -
. . . . Software objects
J
Hydrologist
Programmer
Fig. 2. Schematic representation of the architecture of RIBS.
used in the modeling modules and in the user interface modules, and the user is given interactive access to exactly the same operations on the data as the physical model.
3.2. Process and data organization
Management of process parallelism in RIBS is based on the possibility of communication among the modules. RIBS modules are built under the object- oriented concept, although at a higher level of abstraction than the programming objects. Modules can perform different functions which are triggered by control messages sent by a supervisor or by another module. They are naturally in a dormant state, waiting for instructions, and get reactivated when they receive the proper message. To allow for module interaction, adequate channels of communication are open to share data and transfer commands.
L. Garrote, R.L. Bras / Journal of Hydrology 167 (1995) 307-326 313
data, and the modules interact with it to generate more elaborate versions of the original data. They read information from the database, operate on it, write results back in the database and notify the manager when finished. In order to facilitate interaction o f multiple processes with a unique database, RIBS modules share a c o m m o n language for data description through the process o f data abstraction. This design allows for data sharing among several independent processes, as long as concurrent access to the database is prevented.
3.3. General m a n a g e m e n t
The general manager contains the knowledge and methodology to operate the modules, according to the contents o f the database, in order to satisfy the general goals. Rather than performing a prespecified sequence o f operations, the manager can schedule the tasks that it considers pertinent given the time available for operation and the current storm situation. Task scheduling through a manager also facilitates the possibility o f responding to user's request about the global system performance, since the role o f the manager can be easily transferred to the user through an adequate interface.
Two aspects of the operation o f the general manager are o f interest: module coordination and time control.
Module coordination - - two options are available to control module coordination in RIBS: centralized management and hierarchical management. In the centralized- management architecture, all modules are triggered by a process, the supervisor. Modules also communicate the completion o f their tasks to the supervisor. The supervisor in turn knows which other modules should be notified o f the event, and sends messages to them. In the hierarchical-management architecture, modules control one another. Instead o f a unique parent process and a group o f child processes, a tree o f interrelated processes is formed, in which any process can trigger child processes and keep control o f them. In this case, the role o f the general manager is distributed among the modules involved. The individual processes contain knowledge about which modules are affected by their behavior, and propagate event messages accordingly.
RIBS modules have predefined protocols of communication and can be activated under either management scheme. The use of one or other type o f management depends on the complexity of the problem and on the nature o f the relationship between modules. The centralized architecture provides a better control o f process evolution, but it requires more efficient communication among the processes. Hierarchical management is simpler, but it does not allow for closed loops in process dependencies. In particular, it is difficult to include user decisions about process evolution in real time.
314 L. Garrote, R.L. Bras / Journal of Hydrology 167 (1995) 307-326
Time organization - - the control of time is an important aspect o f general management. In addition to triggering or reactivating the adequate processes as a reaction to the occurrence of events, the manager must also keep track of time evolution. Since the system is advancing in real time, the time reference is dynamically changing as the storm progresses. In order to allow for process inter- action, a unified time reference is shared by all modules. Moreover, the system can also backtrack in time and offer images o f past situations and forecasts to compare with the actual storm evolution. If unacceptable model performance is detected, the manager may decide to change some model parameters, return to some previous state and continue model evolution from there. Time organization is contemplated not only as a centralized control o f linear time evolution, but as a branched process in which model evolution can be interrupted at some point and resumed from a previous time with different model settings.
3.4. The simulation tool kit
The simulation tools are procedural abstractions which represent the external behavior of programming objects. They are high-level computation concepts which are used by different modules of the environment, and are independent from specific implementations. Alternate representations o f the same hydrologic process can be interchanged without affecting the rest o f the application because simulation tools are handled symbolically. The final result is not a single computer program, but a collection o f simulation tools for distributed hydrology which can be used differently in various modeling contexts.
The simulation tools reproduce the behavior of the physical system represented in the rainfall-runoff simulation model. Model conceptualization o f D B S I M is the result of a feedback process between hydrologic modeling and software design. Both evolved in parallel, introducing incremental changes on previously developed concepts. As a result, there is a one-to-one correspondence between simulation tools and the basic processes identified in the hydrologic analysis of the problem.
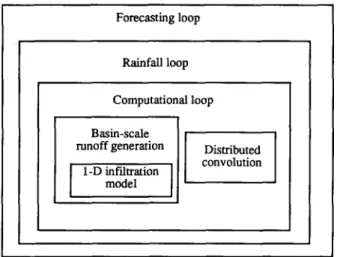
The main r a i n f a l l - r u n o f f simulation tools defined in RIBS are shown schematically in Fig. 3. They correspond to the individual blocks of DBSIM and to the three nested loops of the operational scheme. The infiltration model is the basic building block o f the basin-scale runoff generation process, which, together with the routing scheme, represent physical simulation capabilities (see Garrote and Bras, this issue, for details about model formulation). These capabilities are used to evaluate basin state evolution and incremental basin response every time step. This process is called the 'computation loop'. On a larger time scale, the computation loop is repeated to evaluate basin response during a period o f uniform rainfall, in what is designated as the 'rainfall loop'. Another external loop (the 'forecasting loop') is also defined to evaluate basin response to several alternatives o f forecasted rainfall. A brief overview of these simulation tools is presented next.
L. Garrote, R.L. Bras / Journal of Hydrology 167 (1995) 307-326 315
Forecasting loop
Rainfall loop
Computational loop
Basin-scale runoff generation
1-D infiltration model
Distributed convolution
Fig. 3. Hierarchical organization of the hydrologic simulation tools.
The basin-scale runoff generation reproduces the process o f runoff generation at the basin scale. It involves the m a n a g e m e n t o f subsurface flow transfer a m o n g cells and the use of the previous simulation tool to evaluate local runoff generation at every grid point. Given the rainfall rate and the values of the state variables in the basin, basin runoff is evaluated using a recursive procedure, in which the u p s t r e a m cells are evaluated first. The final output is the distribution o f runoff in the basin, Rf(x, y).
The distributed convolution represents the process of water transport from the hill- slope to the basin outlet. This simulation tool takes the distribution of runoff generation as an input and applies the routing process to obtain discharges at a point. The output is the incremental basin response corresponding to the time step, qzxt(t).
The c o m p u t a t i o n loop carries out the operations necessary to obtain the evolution o f the basin corresponding to a period At. It has two phases: - - evaluation of runoff in the basin Rf(x, y); evaluation of the incremental response qAt(t) for every location o f interest. The result o f the c o m p u t a t i o n loop is the incremental h y d r o g r a p h in points of interest plus the evolution of basin state during the time step.
The rainfall loop represents the operation o f the model for a period o f constant rainfall intensity. The rainfall loop is invoked every time new rainfall information becomes available. It takes a rainfall m a p as an input, simulates basin evolution repeating the c o m p u t a t i o n loop and obtains the incremental response for the period. The forecasting loop obtains basin evolution and incremental response for future rainfall. A rainfall forecast is c o m p o s e d o f an ordered sequence of one or m o r e rainfall values over time. The forecasting loop is an outer loop that repeats a rainfall loop for every future rainfall alternative in time.
4. System-user interaction
316 L. Garrote, R.L. Bras / Journal of Hydrology 167 (1995) 307-326
model. By the term 'user interface' we mean the different ways in which the user can gain access to model data, results and intermediate basin states. The final goal is providing the user with enough tools to understand and evaluate model behavior. Following the general design guidelines o f procedural and data abstraction, the emphasis is placed on making any individual piece of data or procedure used by the system available to the user in real time. Thus, user interface capabilities are a consequence o f the possibilities offered by the software development methodology.
4.1. Design objectives
Two features o f the D B S I M characterize the design of the user interface in RIBS: the abundance and diversity o f the data involved and the need for real time operation. Both features have interconnected effects. D B S I M runs in real time, producing a dynamically changing image o f basin state. Since model results are so abundant, all of them cannot be presented simultaneously to the user. On the other hand, the model evolves slowly, and the presentation of final output alone (model hydrographs exclusively) may be too naive.
The typical time scale of changes in basin situation is o f the order o f hours. There is enough time for the user to assimilate and understand a sizable portion of the results obtained by the model as it advances in real time. There is also time to question certain aspects o f model behavior or to make on-line sensitivity analyses. The con- sequence is that a large volume o f results are produced by DBSIM and the user is potentially interested in all o f them, but only a fraction will actually be analyzed in real time. The criteria to select relevant results may change over time, as the model helps the user understand the complex situation in the basin. Different areas o f the basin and different variables may be o f interest, according to the situation. The user interface should offer mechanisms to gain access interactively to very detailed representations o f model results.
The strategy adopted to deal with abundant information is to let the user decide which pieces o f information should be displayed at any given time, taking advantage o f the graphic capabilities offered by the X Window system (Scheifer and Gettys, 1991). The RIBS user interface distributes the presentation o f results in several independent windows which are interactively managed by the user. On an X Window system workstation, the windows can be regarded as overlapping sheets o f paper stacked on the screen. The window manager allows the user to manipulate each window individually, changing its stacking order, resizing it or iconifying it (Jones, 1990). The window manager also lets the user move windows around the screen. As far as the user is concerned, the computer screen is just like his or her working desk top. Each window is like a sheet of paper that can be moved, stacked, put away and recovered. The RIBS console can be used as a working desktop by the user, organizing its contents dynamically according to their relevance at that time.
L. Garrote, R.L. Bras / Journal of Hydrology 167 (1995) 307-326 317
different parallel modules. Parallelism requires the definition o f isolated modules for result presentation and channels o f communication between the simulation modules and the interface modules to guarantee p r o m p t update o f model results. The operating system takes care o f the distribution o f computational resources among all running modules and the window manager lets the user configure the global appearance o f the screen.
4.2. User interface modes in R I B S
Two modes o f u s e r - c o m p u t e r interaction are included in RIBS: a model-driven interface and a user-driven interface. The model-driven interface is basically model- controlled, but it lets the user interact with the computer to specify the format o f the presentation. The user-driven interface is basically user-controlled and is intended for off-line result analysis, but is has an open channel o f communication with the model and can also be used in real time.
Model-driven interface - - this interface presents results on-line, as they are being generated by the numerical processes. Two types o f information are presented in the interface: rainfall information and basin state information. The rainfall information includes distributed displays o f measured and forecasted rainfall and a display o f hyetographs at selected locations in the basin. The basin state information includes distributed displays o f the three basin state variables: location o f the top o f saturated region (top front), location o f the bottom o f saturated region (wetting front) and moisture content (see G a r r o t e and Bras, this issue). Also displayed are runoff generation and hydrographs at points o f interest in the basin.
The user can customize the access to model results, choosing the variables that should be included in the presentation for every run and selecting which variables should be displayed on the screen at any given time. F o r each type o f result, a graphic object appears as an independent window with an identifying name. Once the model is running, windows with different variables are automatically updated as the model advances. The user can resize, iconify or magnify windows according to the situation. Zooming capabilities let the user focus on specific areas o f the basin or analyze portions o f the hydrographs with greater detail.
User-driven interface - - the idea o f this interface is derived from the concept o f object-oriented design. RIBS is basically an object-oriented modeling environment that obtains the state o f physical objects as they evolve in time. Since the full time evolution o f model objects cannot be maintained in memory, objects defining the state o f the system are stored in the database. The user-driven interface can (1) retrieve those objects from the database and (2) apply the modeling capabilities o f the object- oriented environment to them. It provides access not only to model data stored in the database, but also to model procedures. Furthermore, it also offers graphic inter- active facilities to communicate with the user.
318 L. Garrote, R.L. Bras / Journal of Hydrology 167 (1995) 307-326
organized in the database and guides the user during the consultation. The user- driven interface knows about the time organization o f RIBS, and can interpret the semantic content of the different data files. It knows which variables represent rainfall, runoff, front positions, etc., and can apply different scales or color codes to the different types o f variables.
The second objective o f the user-driven interface is to provide additional modeling capabilities for the RIBS environment. The distributed basin simulator has a modular structure, where the evaluation o f basin evolution and the generation o f basin response constitute independent processes. Once basin states have been obtained for a particular storm, the modeling environment offers a large number of possibilities with little additional effort. However, the automatic evaluation o f all the variables and results that can be of potential interest to the user is neither essential nor efficient for a process intended to work in real time. Therefore, the on-line version o f DBSIM focuses in basin evolution and in obtaining a reduced number o f basin hydrographs, leaving additional modeling capabilities for a com- plementary process, This second process, the user-driven interface, is directly controlled by the user, and only performs the computations that are considered relevant by the decision maker.
The user-driven interface therefore works asynchronously with respect to the model. It is guided by the user, not by model evolution. It provides an interactive environment where the user decides which previous basin state should be retrieved and what operations should be performed on it. The features available in the user- driven interface include the following: presentation of spatial distribution of basic or derived variables; generation o f hydrographs at any point within the basin; presentation o f the time evolution of model variables for any grid element; display of the moisture profile for any cell.
5. A case study
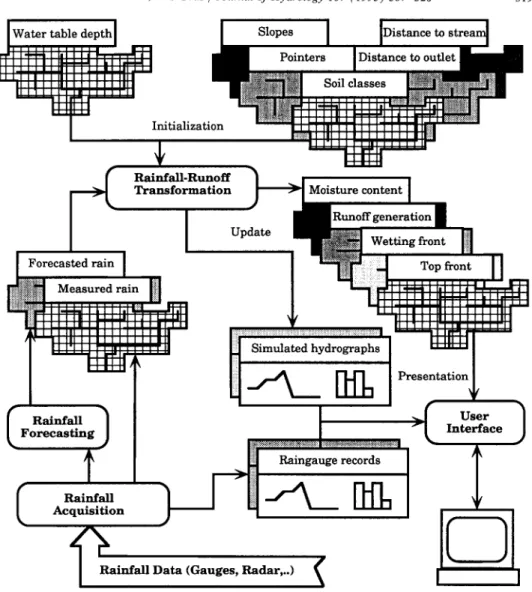
A sample implementation o f RIBS is presented to illustrate system capabilities. RIBS is run in the forecast on-line mode. In this environment, the package is used to analyze input information, generate rainfall forecasts and evaluate basin response to measured and forecasted rainfall. The general pattern o f data flow during the real- time operation of RIBS is presented in Fig. 4.
5.1. M o d e l operation
L. Garrote, R.L. Bras / Journal o f Hydrology 167 (1995) 307 326 319
[nitializati~
Rainfail-Runoff
T r a n s f o r m a t i o n Moisture content
Rainfall
F o r e c a s t i n g
(
Update
Runoff generation L
Simulated hydrographs
rtn,
Presentation Interface UserT
records 1
A c q u i s i t i o n
•
I
~ R a i n f a l l Data (Gauges, Radar,..)
Fig. 4. Data flow in the forecasting on-line mode of operation of RIBS.
Rainfall measurements from different sources, mainly teleconnected raingauge networks and meteorological radar, are acquired and preprocessed in real time by the rainfall acquisition module. The measured rainfall data is also processed by a rainfall prediction module, which stores maps o f forecasted rainfall in the database. Point rainfall series at selected locations are also stored in the hydrologic database for further reference.
320 L. Garrote, R.L. Bras / Journal of Hydrology 167 (1995) 307-326
(1) State variables of the infiltration model in all the nodes of the grid. The state variables are necessary to compute the future evolution of the fronts and obtain the runoff generation capabilities at any point: position of the wetting front in the basin
Nf(x,
y); position o f the top front in the basinNt(x,y)
and moisture content in the basinMr(x, y).
(2) Previous hydrograph due to antecedent rainfall: the expected contribution to the global hydrograph as a consequence of the runoff generated by rainfall in the previous hours: distributed runoff generation
Rf(x, y)
and previous basin response Qp(t).The r a i n f a l l - r u n o f f transformation module advances in parallel with storm development, following a cyclic operational loop. Whenever new rainfall informa- tion becomes available from the real-time data acquisition network, basin evolution corresponding to that rainfall is computed and results are stored in the database. Then, basin evolution corresponding to the future rainfall forecast is computed, and results are presented to the user. The rainfall-runoff module then enters in a d o r m a n t state, waiting for new rainfall information to arrive. At the beginning o f the next time step, the state o f the basin at the end of the previous simulation with observed rainfall is recovered to continue the evolution with new rainfall.
5.2. Model results
Model results shown here correspond to the river Sieve, a tributary of the Arno river in Italy. The size o f the basin is 840 km 2, and spatial resolution o f the D E M is 400 x 400 m 2. The basin discretization consists o f a total of 5252 elements. Data from a raingauge network corresponding to a storm during November 1991 were used to simulate the arrival of rainfall information and generate model results in real time.
RIBS was run on a DECStation 3100 and results were presented through a computer network on another identical workstation. Computer resources were shared between the numerical model and the graphical display processes. A total o f 12 different processes were simultaneously active on the remote host. Rainfall data for the N o v e m b e r 1991 storm had a temporal resolution o f 30 min. The model was run with computation time steps of 10 min in forecasting mode. Under these conditions, the model updated results for a full forecasting cycle in less than 2 min, with acceptable performance in graphic operations.
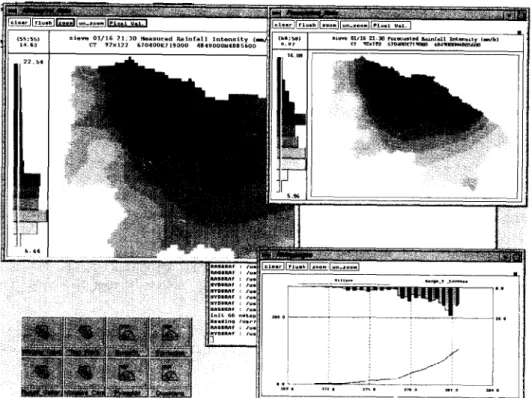
The rainfall information offered by the model-driven interface o f RIBS is presented in Fig. 5. Rainfall distribution in the basin is shown in two windows. The window on the upper left corner presents measured rainfall and the window on the upper right corner presents forecasted rainfall. The window on the lower right corner presents hyetographs o f two raingauges in the basin: Villore and Borgo San Lorenzo. The upper plot in this window presents rainfall intensity and the lower plot presents cumulative rainfall. The lower left corner shows the icon box where other RIBS windows can be accessed.
L. Garrote, R.L. Bras / Journal of Hydrology 167 (1995) 307-326 321
t e e m r n e m r t ~ e e m ~ . m ~
s i e ~ 0 1 / 1 6 ~ 1 : ] 0 i, le a s u ~ e d R a i n f a l l CT 9 2 x 1 2 2 6 7 0 4 0 0 ~ 7 1 9 0 0 0 4 8 4 '
s ~ 01/16 21:30 p o z ~ t ~ l IkLU~eLI.I ~ t e ~ m i l y ( ~ / h )
CT ~ x l ~ ~ 7 ~ 1 ~ 4 8 4 ~ 8 8 ~
i !ii ii I
lol°°rll'lu,hl+ol~+"~l ... I
I 0 ....
i f
z
/ S
~ 7 - - - - +
-If°
Fig. 5. I n f o r m a t i o n p r o v i d e d by the m o d e l - d r i v e n interface.
and the hyetograph window remain on the background. These and all other windows managed by the model-driven interface are automatically updated every time the model generates new results. The user can rearrange window positions and con- figurations, but window contents at any time are controlled by RIBS.
The streamflow information is presented in hydrograph viewers, which are windows similar to the hyetograph viewer in Fig. 5. Since RIBS is running in forecasting mode, each hydrograph viewer presents three time series of rainfall and streamflow: (1) model predictions in the last time step; (2) model predictions con- sidering only measured rainfall; (3) model predictions considering measured and forecasted rainfall. This three hydrographs offer a dynamic picture of the situation at that location. Recent and future changes can be analyzed comparing model results for the previous, current and future time steps. Local information at any point can be compared with information obtained at other locations in the basin, to analyze the spatially varying effects of rainfall.
The basin state information offered by RIBS is presented in spatial viewers similar to those representing distributed rainfall in Fig. 5. The user can display the spatial distribution of wetting front depths, top front depths, moisture content, or runoff generation in the basin.
322 L. Garrote, R.L. Bras / Journal of Hydrology 167 (1995) 307-326
any way. Icons o f all windows with their corresponding names are located in the icon box. Icons o f magnified windows a p p e a r highlighted, while icons of non-active windows a p p e a r dimmed. The user can magnify any window by selecting its icon in the icon box. Z o o m i n g and resizing capabilities are simultaneously active for all processes. The basic idea of this interface style is to offer large a m o u n t s o f information to the user in a flexible way, so that he or she can dynamically select which aspects to consult according to the changing situation.
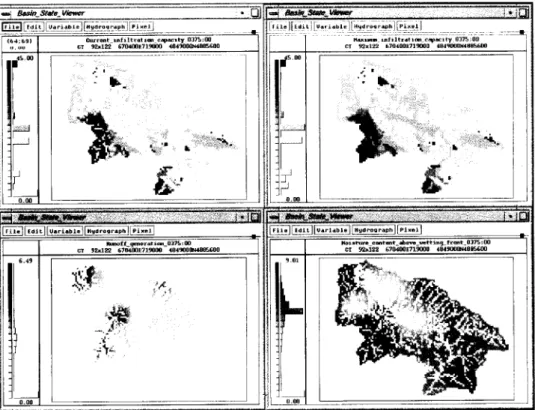
Fig. 6 corresponds to the user-driven interface, which can be used to access the results and states stored in the database. The user can simultaneously run several instances o f the interface to consult different aspects o f model evolution. In this example, four different windows present four variables at the same stage of model evolution. The window on the upper left corner presents the current infiltration capacity, showing the extent of saturated areas. The window on the u p p e r right corner presents the m a x i m u m possible infiltration capacity for comparison. Model state variables, such as moisture content (lower right) or results, such as runoff generation (lower left) are also available in the interface. Unlike the processes o f the model-driven interface, the user-driven interface allows the user to set the time at which results are to be consulted.
4;b91 ~ r ~ t m ~ z l t r n t l m c a p . l i T 1037b;00 . . o Cr 92~1~2 GTO40OE71900(I 4 8 4 9 0 0 0 ~ 4 ~ 0 0 ]
I~S.oo
|
__J
Y
O.OO
] I , ~ x ~ m f i l t r a t l m c ~ ] t y 037S;00 , CT 921122 #a7fl4OOE71~O 484q~ON488~6~ll I
• m ¸ !
m m o ~ f _ 9 ~ n e r a t i r a _ 0375: O0 CT 9 ~ 1 2 2 6704flOETlS~O0 4 8 4 9 ~ 0 ~ G 0 0 6 . 4 9
I
-,.~. .0~
• ?
..d,
Edit, V a r i a b l e H~idrog Paph
I ( o t ~ a l r a e m t m t _ a ~ b m _ ~ t t ~ g L f ~ t 0375: O0 ¢1~ 5~2~122 6704~E719000 4849000N4flB~O0
L. Garrote, R.L. Bras / Journal of Hydrology 167 (1995) 307-326 323
The user-driven interface can be used to obtain hydrographs at any point in the basin. The points can be interactively selected by the user, by clicking on the mouse at the desired location. RIBS responds creating a new window which presents the requested hydrograph and can be directly managed by the user.
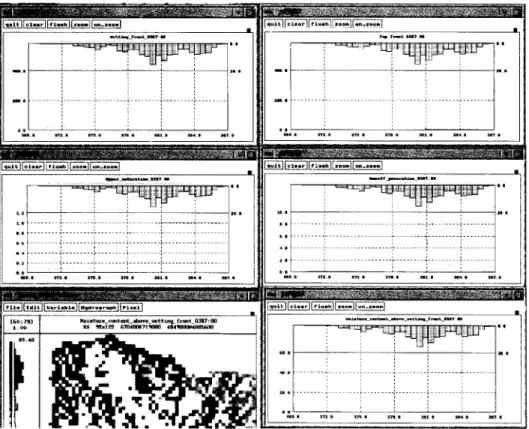
Reports of the time evolution of derived variables for an individual grid element can be generated, as shown in Fig. 7. The time evolution of the wetting and top front depths, moisture content, local runoff generation and degree of saturation above the wetting front for the cell located at row 60, column 79. The example illustrates the effect of perched saturation. The cell generates most runoff when it is in the surface- saturated state, which can be identified because the top front is at the surface and because the degree of saturation is equal to unity. Comparative analysis of different variables helps the user understand model evolution and identify possible errors.
The option to display a cell state is used in Fig. 8 to explain the behavior of cell (78, 54). Cell state has been generated for seven different times. The cell is unsaturated in the upper left window (3 h into the storm). It reaches the perched-saturated state at time 5 h (second from upper left), and at time 6 h (upper right) the top front reaches the surface and the cell becomes surface-saturated. Penetration of the wetting front
~ t t ~ q _ f m t m ~ . u
i "
ill ~-~-~-~-~- i i ... :~ 1 "• "
" u • . • a l l • m . * m i a s x m N 4 • . T I
T ~ r ~ t ~ 7 , N
i
I"
( 6 o ; r 9 )
324 L. Garrote, R.L. Bras / Journal of Hydrology 167 (1995) 307-326
. t r e t ~ l l ~ o ~ I • ~ t r e i m l l n e l l n e t u d e . . t • °%re~mliae~ l n e t u d e . . t o t ~ a m l l n e ~ i n c l o d e . . t
112
... i!!i 1
q u i t c l e a r ¢ x u * h z o * a ° . . l o a m u a a t © . * e r r . . . * o . * t r e a m l i n e * l n ¢ l u d l _ w & i u n ' i ° ° M I t r e . ' l l n l ~ l ~ i n e l u d e - - u ~
X n I S ¢ 0 l ~ l : m i~1s4_o~414 m
, f r o * a * 4 , ~ , ~ * e z * 4 * , f . ~ r ~ t * I N N
n l 8 J?l 0 ~ 0 171 ! 311 0 104 Q ~17 0 ~ 0
m ~ e e.2 . 4 * ~
. , - - - i ... i- i
o . o o
~ b o v e _ ~ t t ~KJ_ ~ r ~ t _ 0390 : O
~OE719ling 4 8 4 9 0 ~ 1 ~ 4 N ~ S ~
Fig. 8. Cell state at different stages o f the storm.
can be observed in the three middle windows (at 9, 12, and 18 h). The image at 18 h shows how the cell becomes perched-saturated again when rainfall stops.
6. Summary and conclusions
This paper presents a prototype computer implementation of a flood forecasting system called Real-time Interactive Basin Simulator. The system integrates a distributed rainfall-runoff model and a hydrologic database within a graphic computer environment which allows for real-time operational use. Although the RIBS system has a wider scope, the presentation concentrates on the distributed basin simulator and on the user interface.
L. Garrote, R.L. Bras / Journal of Hydrology 167 (1995) 307-326 325
The simulation modules were implemented using object-oriented design techniques. Rather than a single computer program, the product o f the software development process is a library o f simulation tools for distributed hydrology which can be used for a variety o f purposes. The code implements a local infiltration model, basin processes o f subsurface flow transfer, runoff generation and flow routing, real-time simulation management and interaction with the hydrological database.
Model capabilities are accessed through a versatile user interface. Interface functions are used to present model results in real time and to access previous basin states stored in the database. The interface consists of interactive graphic programs working on a window environment, but interface functions are wider in scope, since they can be used by other applications to extract model results from the database.
The case study presented illustrates how RIBS meets its design objectives. The innovative software architecture allows the combination o f traditional on-line flood forecasting techniques with advanced interactive graphic interfaces that provide a detailed description o f model behavior. The time evolution o f any model variable for any cell can be accessed in real time, thus helping the user in assessing model performance and evaluating model results as a basis for decision making.
The work presented here integrates a number o f previously separate techniques. The tools described are the foundation layer for possible future systems, following the concept o f multilevel architectures proposed for second generation expert systems. Increasing data availability and computational power will probably lead to widespread use o f distributed models in hydrology. The combination o f hydrologic modeling techniques and software development methods as presented here seems to be a promising alternative to applying physically based concepts to flood forecasting.
Acknowledgments
The following organizations provided support for this research: the US Army Research Office (Grant DAALO-3-89-K-0151), the Arno Project o f the National Research Council o f Italy, the National Weather Service (cooperative agreement NA86AA-D-HY123) and the National Science F o u n d a t i o n (Grant CES-8815725). The first a u t h o r was sponsored by the Spanish Ministry of Education.
References
Abelson, H. and Sussmanm, G.J., 1985. Structure and Interpretation of Computer Programs. MIT, Cambridge, MA.
Beven, K., 1989. Changing ideas in hydrology - - the case of physically-based models. J. Hydrol., 105:157- 172.
326 L. Garrote, R.L. Bras / Journal of Hydrology 167 (1995) 307-326
Garrote, L. and Bras, R.L., 1995. A distributed model for real-time flood forecasting using digital elevation models. J. Hydrol., 167: 279-306.
Goodrich, D~C. and Woolhiser, D.A., 1991. Catchment hydrology. Rev. Geophys., Suppl. April 1991: 202- 209 (US National Rep. to International Union of Geodesy and Geophysics 1987-1990).
Jones, O., 1989. Introduction to the X Window System. Prentice-Hall, Englewood Cliffs, NJ.
Loucks, D.P., Kindler, J. and Fedra, K., 1985. Interactive water resources modeling and model use: An overview. Water Resour. Res., 21(2): 95-102.
Nii, H. P., 1986. Blackboard systems. Part I: The blackboard model of problem solving and the evolution of blackboard architectures. A.I. Magazine, 7(2): 38-53.
Rumbaugh, J., Blaha, M., Premerliani, W., Eddy, F. and Lorensen, W., 1990. Object-Oriented Modeling and Design. Prentice Hall, Englewood Cliffs, NJ.
Scheifer, R.W. and Gettys, J., 1991. The X Window system. In: A.R. Meyer, J.V. Guttag, R.L. Rivest and P. Szolovits (Editors), Research Directions in Computer Science. MIT, Cambridge, MA.
Stefik, M. and Bobrow, D.C., 1986. Object-oriented programming: Themes and variations. A.I. Magazine, 6(4): 40-62.
Widman, L.E., Loparo, K.A. and Nielsen, N.R. (Editors), 1989. Artificial Intelligence, Simulation and Modeling. John Wiley and Sons, New York.