A CO2-saving-based methodology to measure the impact of the
SUMP in European Cities: Application to the City of Burgos
Mr. José María Diez
PhD candidate, University of Burgos, Spain
Dr. Hernán Gonzalo
Ass. Prof., University of Burgos, Spain
Ms. Lara Velasco
PhD candidate, University of Burgos, Spain
Dr. María Eugenia López-Lambas
Ass. Prof., Polytechnic University of Madrid, Spain
ABSTRACT
Urban mobility in Europe is always a responsibility of the municipalities which propose measures to reduce CO2 emissions in terms of mobility aimed at reducing individual private transport (car).
The European Commission's Action Plan on Urban Mobility calls for an increase in the take-up of Sustainable Urban Mobility Plans in Europe. SUMPs aim to create a sustainable urban transport system.
Europe has got some long term initiatives and has been using some evaluation procedures, many of them through European projects. Nevertheless, the weak point with the SUMPs in Spain, has been the lack of concern about the evaluation and the effectiveness of the measures implemented in a SUMP. For this reason, it is difficult to know exactly whether or not the SUMPs have positively influenced in the modal split of the cities, and its contribution to reduce CO2 levels.
The case of the City of Burgos is a very illustrative example as it developed a CiViTAS project during the years 2005-2009, with a total investment of 6M€. The results have been considered as “very successful” even at European level. The modal split has changed considerably for better,
1. GENERAL FRAMEWORK
1.1 European Situation
Nearly 73 % of Europeans live and move every day in cities. Moreover, the percentage of pollution (emissions) produced by transport counts for the 25 % of the total. Therefore, reducing urban transport emissions will considerably reduce the total amount.
Since urban mobility in Europe is always a responsibility of the municipalities, cities have to carry out the arrangements for public transport, cycling, accessibility for mobility, walking, etc, which in many cases involve expensive infrastructure and therefore high investments. So, cities have proposed measures to reduce CO2 emissions in terms of mobility aimed at reducing individual private transport (car) offering a range of alternative possibilities (more examples in Decker, B. and Walek, H., 2012).
1.2 Sustainable Urban Mobility Plans in Europe
The Sustainable Urban Mobility Plans are not new at European level, as there are numerous precedents in France, UK or Germany, which have been developing since more than a decade and, hence, can be considered forerunners. Also the situation is favorable in Belgium, the Netherlands, Italy or Norway, which in general have issued proper laws to harmonize the SUMPs (based in Kepaptsogloua, K and Vleugelsg, I, 2011).
The European Commission's Action Plan on Urban Mobility calls for an increase in the take-up of Sustainable Urban Mobility Plans in Europe. SUMPs aim to create a sustainable urban transport system by addressing objectives such as ensuring that the transport system is accessible to all; improving safety and security; reducing air and noise pollution, greenhouse gas emissions and energy consumption; improving the efficiency and cost-effectiveness of the transportation of persons and goods; and contributing to enhancing the attractiveness and quality of the urban environment and urban design.
1.2.1 Situation in Spain
In Spain the situation is defined as “irregular”. The situation varies mainly because of the location (some legislation have been applied in the regions of Madrid, Catalonia and the Basque Country) and some other factors, as the implementation of the “Sustainable Development Law”(2011), which states that only the Cities with an implemented SUMP will be funded to maintain the Public Transport from year 2013.
(2007) or lately Santander (2010).
Nevertheless, the weak point –and main difference- with the SUMPs in Spain, has been the lack of concern about the evaluation and the effectiveness of the measures implemented in a SUMP. For this reason, it is difficult to know exactly whether or not the SUMPs have positively influenced in the modal split of the cities, and its contribution to reduce CO2 levels. Be that as it may, the cities with a SUMP at least have apparently developed in a harmonized way the measures for promoting the sustainable mobility, in a coordinated way.
Studying the situation in Europe and comparing the different modal split, the situation of the Spanish cities does not look so different than the rest of the European countries.
Moreover, having a look on the data base given in the European Platform for Mobility Management, the use of the private car in cities notorious for their commitment with sustainable mobility, reach the following scores: Antwerp 41%, Rotterdam 49%, Utrecht 49% or Groningen 44%, while some Spanish cities have achieved a much better figures in terms of use of private car such as Burgos 28%, Vitoria 30%, San Sebastian 29% or Barcelona 35%. Interestingly, those four cities have developed and implemented a Sustainable Urban Mobility Plan.
This basically means that in Spain, with some exceptions, lifestyle involves the use of Public Transport in medium and big sized cities, and walking in mid-sized cities (based on the European Platform for Mobility, more than 80% of the cities with a walking modal split of more than 40% while in big cities the whole of the cities with a percentage higher than 20% in the PT mode) , which makes the situation, at least in terms of modal split, just as the rest of the European cities, if not better in some cases. Some authors have explained this phenomenon as “Mediterranean mobility”. In general terms there is a tradition for walking in small and mid-sized cities, considered as well in many sectors of the population as very healthy.
2. EUROPEAN INITIATIVES
2.1European Evaluation Proposals
2.1.1 Max Sumo
This methodology is commonly considered the first one to measure and evaluate SUMPs and measures related. It was developed under the umbrella of the European Platform on Mobility Management and it ran from 2006 up to 2009 in the 6th Framework Program. It was developed by the EPPOM (European Platform on Mobility Management).
The methodology is based on a combination of measure cost-effectiveness actions but with a deep reflection about changes of behavior.
This is the first methodology in proposing quantitative and qualitative indicators, and giving proper responses to some of the problems arisen while the evaluation is implemented, as external factors. The external factors cover a range of circumstances such as political situation, the weather or changes in the prices of petrol.
The qualitative indicators are crucial to measure whether or not the citizens are perceiving the efforts from the City Council: if the marketing measures are clear and comprehensible along with the perception of the services provided. Sometimes the services and actions provided are not the best in the eyes of the citizens but they are useful, so the citizens have the perception that is the best possible service provided.
Max Sumo Methodology divided the new mobility option from the “ordinary” Mobility Management. To do so, the methodology proposed different levels of assessment of the options provided, including the acceptance, satisfaction or take up.
Max Sumo established as well what is called the Stages 1 to 4 in terms of different individuals and the attitude facing the new mobility options.
Stage 1: Pre-contemplation. Individuals in this stage are quite happy with their car use and at the moment have no wish, or desire to change to another mode. Some of them are people who would like to reduce their level of car use, but currently see no possibility to do so; these ‘captive car-users’ are pre-contemplative as well.
Stage 3: Preparation / Action. Individuals in this stage have decided which mode they intend to switch to for some or all of their trips, and may have already tried this new mode for some of their trips. They can be divided into the preparation /action stage.
Stage 4: Maintenance. Individuals in this stage have successfully replaced some or all of their trips to the ‘new’ mode and this new behavior (way of travelling) becomes the dominant mode they use for most of their trips (a new habit has been formed). Some of them – voluntarily or not – don’t own/have access to a car and therefore currently depend on other modes; they belong to the maintenance stage as well (‘captive non-car users’).
Max SUMO finally suggests the objective and measure the effectiveness in the factor of the CO2 tons reduced.
Max Sumo Methodology introduces some factors that they have been used in the evaluation of future projects and SUMPS. Some of them were very innovative such as the division of the citizens in relation with the mobility and their behavior; the subjective opinion regarding the options offered; their level of satisfaction concerning the measures, etc., but at the end, the final objective is the change in the travel mode and, consequently, the reduction of the use of the car and CO2 associated emissions.
2.1.2 Max Eva Methodology
The same developers of the Max Sumo methodology developed an on-line version. Several cities were contacted to include a serial of data in order to evaluate SUMPS and urban mobility measures following the Max Sumo principles. More than 170 European cities have tried the evaluation tool, but only one in Spain, the City-study of this paper: Burgos. Although the evaluation is not complete, the Max Eva explains the modal split change thanks to the measures developed.
2.1.3 Bypad, Champ and Mediate
Bypad and Mediate were two European Projects (Intelligent Energy Europe and 7th Framework Program calls, respectively).
existing gaps in cities in order to increase the number of cyclers, and consequently, the saving of the CO2 emissions.
Mediate takes a completely different perspective, as the main focus is on the elderly people and people with reduced mobility. So, the main objective is not the CO2 saving measures, but the universal accessibility in cities. They propose audits for the cities in terms of accessible walking, public transport or other services. In these audits the cost effectiveness is not the main important purpose.
2.1.4 Quest
QUEST is a Quality Management method to help small- and medium-sized cities to set up and further develop their sustainable mobility policies and actions. The methodology has its roots in Total Quality Management Methodology (TQM) and focuses on identifying promising development areas and supporting processes in the city to start improvements in these areas.
Quest is the last project regarding evaluation of SUMPs and mobility measures in terms of time, as it finished in the year 2013. It considers on this way, new domains as the green vehicles in the strategy of the cities. In general terms, it stresses the importance of the actions developed and how they can be improved following the overall strategy and with the involvement of the stakeholders and politicians.
Another new vision point was to link the audit reports about mobility with the ISO, EMAS and EFQM methodologies.
2.2CiViTAS Evaluation Framework
Europe has got some long term initiatives and has been using some evaluation procedures, many of them through European projects.
One of the most common is the CiViTAS initiative, which have been implementing since 2002, when the first CiViTAS I was implemented in the first twenty cities.
Up to 2014, more than 70 cities have been or are currently participating in the initiative, which provides the cities a budget to implement measures related their SUMPs.
One interesting thing is that this methodology has been implemented in more than 40 cities over the last decade. It was developed within the CiViTAS II projects life (2005-2009), and the results have been important as the European Commission, based on the results, has modify its Urban Mobility Policy, even in the launch of new calls.
Some of the results can be considered surprising, as some factor – as, for example, the stakeholders’ involvement or political support - arisen as very important rather than technology or problems within the implementation process.
It is also surprising that some of the measures that proved to be a success in the northern countries, failed in the southern ones, as the car pooling, maybe because of the informal relations between workers or colleagues, for example, who do not need any fixed structures to share the car.
Nevertheless, some indicators that CiViTAS proposed, , have been traditionally used in the Agenda 21 and are also inspired in the Max Sumo project.
3. THE STUDY CASE: THE CITY OF BURGOS
3.1 General Framework
The case of the City of Burgos is a very illustrative example. Burgos developed a CiViTAS (www.civitas.eu) project during the years 2005-2009, with a total cost of 6M€. Burgos officially presented its SUMP in the year 2005, and the project supported economically the actions, covering more than the 85% of the activities plan in its SUMP. Some of the implementations dealt with PT (new buses, optimized lines and frequencies and total accessibility), bicycle (new bike lanes, a bike loan system, training courses, facilities in bike parking), access restriction (more than 2 million pedestrian squared meters in the city centre restricted to the traffic, implementation of a bollard control system, new fright scheme), or were developed in the ITS area (real time electronic signals regarding availability of parking and traffic advice), apart from marketing and awareness in order to promote a more sustainable mobility in the city.
3.2 Results of the Evaluation
several cities, being possible comparing the results, and finally, to have a proper feed-back about the resources that the EC is giving to cities.
Burgos divided their measures regarding urban mobility into three areas and a transversal one: Public Transport, Bicycle and Mobility Management, including the pedestrianization process of the city Centre. The transversal one is the marketing and the dissemination of the measures in order to aware the population of the new options. This was in fact, a key factor of the success of the project. The measures were along implemented with the campaign and the opening of a mobility office (year 2009) a whole new concept to provide the citizens tailored information and personalized transport plans. This type of awareness was done in the past in the U.K. with a door-to-door service provided by the organization “Sustrans”, but few more actions can be described in Europe. Apart from that, the evaluation of the marketing actions have been traditionally out of the evaluation of the Sustainable Mobility Plans, and more concretely, the possible effect on the change of the modal split. A mobility office was opened for a limited period of time, while the development of the Mobility Plan of the Industrial Area.
In terms of mobility management, the surveys drown very good figures: to set an example, more than 90% of the citizens agreed with the access restriction in the center, This is a very risky action in political terms if the development is not viewed as satisfactory, but thanks to the support of stakeholders and politicians, the whole process was considered a role model (and in fact, the follower city of Krakow copied the process). The action, in terms of quantitative indicators, showed the reduction of the pollution (CO, NOx, PM) as well as a strong reduction of the traffic in the area.
Indicator Explanation Result
Level of Satisfaction (qualitative)
Level of satisfaction with the new scheme (2M m2 pedestrian)
88% of the citizens, 90% of the freight companies, 92% of the shop owners
Reduction of the traffic (quantitative)
Reduction of the traffic in the target area and surroundings
85% reduction
Satisfaction with the new measures related with the ITS regarding advice (qualitative)
Satisfaction with the new measures related with the ITS regarding advice about real time traffic
92% of the citizens
Reduction of congestion (quantitative)
Reduction of congestion after the implementation of the measures related to advise in real time
10%
Improvement of the traffic (qualitative)
Perception of the improvement of the traffic
83% of the citizens agreed that there was an improvement
Occupation of underground parking (quantitative)
Number of drivers using the underground parking
facilities Reduction of emissions
(quantitative)
Reduction of the CO, NOx and PM emissions
CO: From 7.00 ton/inhab per year to 6.9 ton/inhab NOx: From 89.25 αgr/m3 to 81.00 αgr/m3
PM: From 95.5 αgr/m3 to 51.75 αgr/m3
Table 1 – Evaluation figures regarding measures about the mobility management and the City center restriction. The resources are the evaluation of the CiViTAS Caravel project and the Mobility Observatory of the City of Burgos.
The evaluation regarding the bicycle also drown good results. The evaluation was performed under two point of views, quantitative and qualitative indicators, and it consults about the improvements in the facilities of the bike (new bike lanes, new bike parking racks, new services as maps and leaflets or guide books about advice regarding bicycle).
Indicator Explanation Result
Acceptance and use of the new facilities regarding bicycle (qualitative)
Acceptance and use the new bike lanes and bicycle parking racks
90% level of acceptance and use
Visual Accounting of number of bicycles (quantitative)
Number of bicycles per hour in different moment of the day and different periods
Increase from a range of 20-40 to 120-140.
Number of users of the bicycle loan system (quantitative)
The system was developed in the project lifetime
5,300 users
Acceptance and satisfaction with the new system (qualitative)
Vision of the citizens about the bicycle system
72% satisfaction
Table 2 – Evaluation figures regarding measures about the bicycle. The resources are the evaluation of the CiViTAS Caravel project and the Mobility Observatory of the City of Burgos.
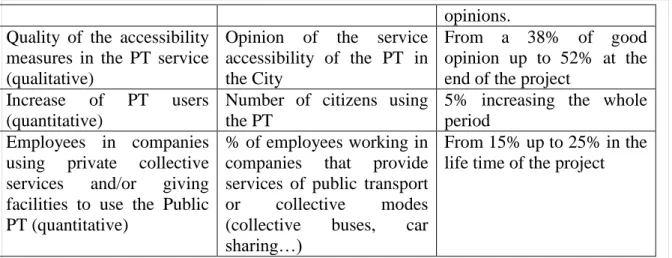
Regarding Public Transport the main questions were about the new facilities inside the buses, as new technologies and more accessibility. During the life time of the project, two of the lines were optimized and new fuels were introduced (bio diesel and Compressed Natural Gas). Also in the City is frequent to give as bonus facilities for using collective transport modes or the Public Transport, an areas that the project was working, in relation with other measures about the industrial areas.
Indicator Explanation Result
Quality of the PT service (qualitative)
Opinion of the service of the PT in the City
opinions. Quality of the accessibility
measures in the PT service (qualitative)
Opinion of the service accessibility of the PT in the City
From a 38% of good opinion up to 52% at the end of the project
Increase of PT users (quantitative)
Number of citizens using the PT
5% increasing the whole period
Employees in companies using private collective services and/or giving facilities to use the Public PT (quantitative)
% of employees working in companies that provide services of public transport or collective modes (collective buses, car sharing…)
From 15% up to 25% in the life time of the project
Table 3 – Evaluation figures regarding measures about the Public Transport. The resources are the evaluation of the CiViTAS Caravel project and the Mobility Observatory of the City of Burgos.
The aspects regarding marketing and awareness was one of the most interesting areas. In the indicators was also included the knowledge about the CiViTAS project, and more than the 50% of the citizens were aware of the European project being implemented in the city. That gave as well a picture to the European Commission in terms of development the mobility projects. The impact of these projects in mid-sized Cities is much bigger than the previous experiences before, developed in big cities such as Barcelona or Berlin, where these measures were unappreciated.
Indicator Explanation Result
Knowledge and awareness of marketing material in mobility (quantitative)
Knowledge about the mobility maps, and awareness of the material
93% acceptance and awareness
Quality of service provided regarding mobility information to tourists (qualitative)
Vision of the tourists visiting the city regarding the services provided regarding mobility
90% of good opinions
Improvement of the services offered by the Council (qualitative)
Vision of the citizens about the information offered and the degree of improvement
93% of the citizens agreed that the information improved
Number of consults in the Mobility Offices (quantitative)
Visits to the Mobility Offices. In the Mobility Office in the city center, other services were provided (PT and Bicycle cards)
81 consults in three months in the Mobility office in the industrial area and more than 2,300 in the mobility office
The results have been considered as “very successful” even at European level, but these good results provoked as well a big change in the City. The modal split changed considerably for better, taking into account that during those years the city moved from 174,000 inhabitants up to 178,000 due to immigration, with the inherent risk of urban sprawl and thus, necessities of wider mobility systems. The car used was reduced, and the use of the PT increased, as well as the 3.8% of the users of the bicycle, insignificant in the previous years (less than 0.03%).
Figure 1 – Modal Split in the City of Burgos in the period 2003-2009
3.3 A new Formula for the Evaluation
The formulation for the evaluation is based on the cost-effectiveness methodology. To do so, and as other methodologies do, it is important to focus on one year, and the effects and results on one period of time.
In the study, the period proposed is the year 2009. To have a clear picture, it is necessary to focus on that year, and to study the differences from the previous one. The period object of our study was controlled and checked thanks to the evaluation of the CiViTAS project, which provided resources to develop this evaluation.
Based on those figures, and generalizing for the whole population, we can figure out the percentage in terms of population, with 7,900 people leaving the car, and supposing that these people have started to walk, use the bicycle (in both cases zero emissions), take the bus (6,400 people) and use the motorbike (430 people). The remaining 1,070 people are citizens walking and cycling.
Figure 2 – Modal Split in the City of Burgos in the period 2008-2009
These figures are important as this methodology is normally based in vehicles-emissions, and in terms of changes of fuels, but not in terms of citizens. This is the reason why the modal split is the main objective of the SUMPs, and why is so important in order to calculate the CO2 emissions, also possible in terms of commuters.
Normally the methodologies explain the CO2 saving as:
2
*
2CO equiv
E
Fossf
CO
(1)Where links the CO2 equivalent with the difference of energy used by different fuels and the specific CO2 factor for each mode (based on the study by Ajanovic, A., 2011).
0 0
(
) *
Foss t t substituted
E
FI vkm
FI vkm
V
(2)So traditionally the proposed formula links the old FI (Fuel Intensity) and the km driven per car and year with the new ones multiplied by number of vehicles substituted.
0 0
(
) * P
Foss t t substituted
E
FI vkm
FI vkm
(3)Where the CO2 equivalent is linked with the difference of citizens moving from one mode to another.
Taking the 7,900 people leaving the car, we made our calculations on the following basis:
a)The average distance is 5 km per commute, four times per day. b)The average degree of occupancy of the private vehicle is 1.25.
c)The emissions of an average car running 5 km 3 times per day (only counting three times instead of four because of the 1.25 occupancy) is 2.8 kg per day, so 1,040 kg per year, which is 1 ton per year. 7,900 citizens have decided to leave the car so it means 7,900 ton saved per year.
d)Per year, and with the same calculations, the emissions of a motorbike are 430 kg per year (0.43 ton) and for the bus is 339 kg per year (0.339 ton). 430 citizens are using the motorbike, which means 282 ton, and 6,400 new users of the bus, which means 2,169 ton.
The figure of the bus’ user is understandable in terms of necessity of more buses and more frequency, being possible not taking it into account if we consider the same scenario in terms of Public Transport as the previous years. In our case, and due to the fact of the new lines and new frequencies implemented the year of the study, has been taken into account. Not taking this factor into account gives more effectiveness to the study thus.
With all these figures, the CO2 equivalents, saving 7,900 Ton thanks to all the people leaving the car, but minus the tons expulsing because of the Public Transport and motorbike (2,169 and 282.51 with a total of 2,451.51 ton) results in a figure of 5,448 ton saved thanks to the project (SUMP and CiViTAS) and its effect on the change in modal split.
Regarding costs, some important costs have been traditionally neglected, such as the administrative costs, included in some studies instead, but the marketing costs. The authors propose marketing costs as a very important key of the success of the project implementation. The costs are not higher than others, but because of the activities developed (mobility offices, marketing campaigns) there is a need to include this kind of costs.
* ( , IS) * ( , )
IS CV Adm Mark IS V v Adm Mark
y
C C C C C IC CRF r t IC CRF r t C C (4)
investments of the vehicles, the administrative costs and the marketing costs.
In the case of the City of Burgos, these figures are:
a)The investments in infrastructure were 1.5 M€, and the depreciation is about 20 years, so the costs for one year are account as 1.5 M€ * 0.05 in total, 75,000 € per one year.
b)The investments in vehicles were lesser, as the project only financially supported few for research (bio diesel tests). The total amount was 0.5 M€, and the depreciation is commonly considered 12 year, so the costs for one year account as 0.5 M€ * 0.083 in total, 41,500 € per one year.
c)Administrative costs were flat along the years, and it basically covered part time workers, 30,000 € per year.
d)Marketing costs covering the actions for one year as the total amount was 200,000 € is 50,000 € per year. It is important to include these costs as in total amount the quantity is bigger even that the investment in vehicles.
e)In total, the cost was 196,500 € per year.
Finally, the cost per CO2 ton is calculated as:
2
2
CO equiv Cy Cco
(5)
Where our costs are 196,500 € and the total CO2 saving tons are 5,448, so the cost per ton is 36 € in the City of Burgos for the implementation of its SUMP.
This is in line with other studies (Satish Rao, H. and Roldan, C., 2010) proposing 1 € / ton as 100% objective, 15 € the 75% and 30 €/ton as the 50% objective, being more than 1,000 €/ton the 0% objective.
In terms of mobility project, this is a good figure in terms of cost-effectiveness (based in Nickel, J. and Rhodes, D.H., 2009).
Regarding CO2 reduction, it is considered very successful if the measures implemented get a save of 10,000 ton per year, being 5,000 ton (our figure) the 50%. So, in terms of net CO2 saved, the project is also in line.
4. CONCLUSIONS
their projects have been a success and whether the actions and measures implemented have truly contributed or not in order to change modal split and to avoid CO2 emissions.
The city of Burgos firstly developed its mobility plan and was given the opportunity to implement a high percentage of the proposed activities, thanks to the CiViTAS project. The main activities were focused on three pillars: new traffic management, including a new calmer city Centre, a new PT service and the promotion of the bicycle as a daily mobility system, along with a fourth transversal pillar: marketing and awareness.
The activities developed under this umbrella were very innovative as well, with a totally new information system to the citizens, or the opening of a mobility office in the city Centre to provide tailored information.
The results were considered “very good”, absolutely in line (if not better) with other cities. The methodology used (CiViTAS) was as well used to evaluate the rest of the cities of the initiative, showing surprising results, such as the technology was not considered as the most important factor, being public participation, political support or stakeholders´ involvement the key factors.
The authors tried to provide a new and more innovative way to measure the cost effectiveness of a SUMP with regards the figures of the modal split and the changes that the implementation of the SUMP have brought about, taking into account new aspects traditionally not included, as the marketing costs, much more important nowadays than the high resources for acquiring more efficient or cleaner vehicles, as it is referred in the case of Burgos.
Results can be as well affected by other variables as the world economic and financial crisis, the price of the fuel or the employment rate. All of these factors should have to be taken into account, but for the case of Burgos and in the period covered (2005-2009), did not particularly affected; instead, other effects as the immigration phenomena were more important (together with the city sprawl, which made less people walking), although during the last year of the study, the increasing number of citizens using the bus was considered one of the first symptoms of the crisis.
REFERENCES
AJANOVIC, A. (2011). Promoting alternative automotive technologies in Urban Areas: lesson learnt from international cases, ASEAS Australian Engineering Congress, Kudring, Sarawak, Malasya.
COM (2007) 551 final, Green Paper. Towards a new culture for urban mobility, Brussels.
DECKER, B, HECIMOVIC, H. WALEK, H (2012). Sustainable Urban Mobility Planning in Central Eastern Europe: case examples from Poland and Croatia, Procedia Social and Behavioural Sciences, vol 48, pages 2748-2757.
European Conference of Ministers of Transports (2007) Cutting transport CO2 emissions, what progress?, ECMT, Brussels.
GOODWIN, GRAHAM et al. (2009). Ten years of Sustainable transport in the U.K., University of Bristol, The Policy Press, Bristol
IDAE, Spanish Ministry of Industry (2011). 2nd Spanish Energy Efficiency Action Plan (2011-2020), Madrid
KEPAPTSOGLOUA, K, MEERSCHAERT, V. NEEGAARDC, K., PAPADIMIRTRIOUD, S., RYE, T., SCHREMSERF, R., and VLEUGELSG, I. (2011). Quality Management in Mobility Management: A Scheme for Supporting Sustainable Transportation in Cities, International Journal of Sustainable Transportation, Volume 6, Issue 4.
NICKEL, J., ROSS, A.H., RHODES, D.H. (2009). Comparison of project evaluation suing cost-benefit analysis and multi attribute tradespace, Second International Symposium on Engineering Systems, MIT, Cambridge, Massachusetts,