1
BOTAFOC BREAKWATER #8 CAISSON
Almazán Gárate J.L.1 Matías Mateos A 2 Martín Jiménez J3 Palomino Monzón MC4
Balearic Port Authority has developed an instrumentation system for the #8 caisson of the Botafoc breakwater that integrates 12 pressure sensors located at three surfaces, two in contact with the sea water and another with the bottom. This design was completed with an inertial system that measures the angular velocities and the accelerations over the three Cartesian axes. Consequently, the system measures actions (pressures) and reactions (movements and accelerations) experimented by the caisson, due to sea waves and/or other service loads. R+D department of the Port Authority and Polytechnic University of Madrid are working on two directions, the development of new theories on vertical breakwater design that go beyond Goda and Sainflou, and on the creation of a real-time critical structure alarm system, based on the instrumentation installed. This alarm system has two main parts: the instrumentation itself that collects data and processes it on real-time (the data processing compares the pressure law suffered by the caisson in every step process with the design critical state of the caisson, in this case the Goda pressure law for a 6.5 m wave), giving a security coefficient that points out the risk level on real-time; and the alarm system consisting of a monitoring panel located in the Port Control Center that shows the risk level and advises in case of an incidental evacuation of this critical portuary installation.
LABORATORY ESSAYS VERSUS IN SITU INSTRUMENTATION OF MARITIME STRUCTURES
Both laboratory essays and in situ instrumentation on caisson breakwaters behaviour (terms like stability, requirements, movements, exceeding, etc.) are mainly developed through a theoretical research of effects shown on physical model essays, principally subject to Froude’s resemblance law and to inevitable scale effects, proving decisive in this case when quantifying the effects observed, particularly when talking about “impulsive pressures” on vertical walls.
The role played by laboratory essays, the only possible method till recent times, contrasts with new possibilities offered by remote control techniques, remote experiment command, data storage capacity as well as in situ treatment capacity, offering in situ experimenting, together with sensing advances and its reliable application techniques to the structure researched, have improved these essay methods, as well as investigation, verification and monitoring of structures already built.
The existence of scale effects in physical model essays and the technology framework as far as maritime structures are concerned, provoked that all the
1 Ph. D. Civil Engineer. Polytechnic University of Madrid. Spain. 2 Civil Engineer. Balearic Port Authority. Ministry of Fomento. Spain. 3 Civil Engineer. Balearic Port Authority. Ministry of Fomento. Spain.
new construction structures with the purpose of taking useful pressure data, pursuing the obtaining, somehow using an analytic ruse, of all the requirements needed by structures, next step being the relationship between those requirements and failure probabilities, security coefficients and other useful parameters needed for a correct design of the new structures.
The instrumentation described in this paper goes even further, because it not only registers wave pressures on structures, but also the movements suffered by the structure. To sum up, the aim is to get more economic and simpler measurements of what really matters, and that is the reaction of the structure to pressures and not the pressures themselves, the latter including some other complex calculation only to estimate those reactions.
ANALYTIC MODEL RESTRICTIONS IN VERTICAL BREAKWATER CALCULATIONS AND NEED OF IN SITU INSTRUMENTATION
Goda’s analytic model is currently the most accepted by scientists, with some corrections made by Takahashi, concerning impulsive pressures. It is principally used in measuring pressures generated by wave’s crests. This model, though largely accepted, is limited. Comparing this model with in situ experiments show how Goda overestimates forces due to waves (Van der Meer et al, 1994). Sainflou proposed an analytic method derived from the trocoidal theory that
properly predicts negative net forces produced by real wave (stochastic process). Concerning sub-pressures, it is supposed to be a triangular distribution with its maximum located just under the voussoir’s base, its value coinciding with that of the vertical wall at that depth.
Experience shows that one of the most typical failures in vertical breakwaters is gyrating seawards. This failure is not considered when using laboratory essays, proving that, both the response of the structure to the wave’s trough and to the influence of the period and pulsating load amplitude induced by waves, are not considered by analytic methods.
These lacks must be analysed, and the most economical and efficient way of performing that is by in situ experimenting in breakwaters instead of laboratory essays. Also to avoid rejecting important elements in breakwater operation versus waves and that are not considered by those classic analytic methods, such as interaction between caissons, elastic effects of the bedding layer, rigidity of the full structure due to a continuous superstructure laying on it, real caisson’s mass and centre of gravity, points of gyration and seesawing, etc., must be researched both concerning actions (pressures) and reactions (movements due to pressures) until an analytic theory explaining all these phenomena not considered up to present times is reached to be able to predict the real answer of the structure to waves.
BREAKWATER INSTRUMENTATION IN SPAIN
instrumenting the new Botafoc caisson breakwater with vertical front in the port of Ibiza, solving the difficulties that the previous instrumentations had in the past, introducing new advanced concepts from the initial model designed by CEDEX. After that initial design from Almazán Ingenieros and the Balearic Port Authority, its installation got started, finishing in the spring of 2003, and being at that time the only installation of this kind working in Spain. This installation was made with the most modern technology available and, along with measurements of pressures and sub-pressures, it had new elements such as the following: measurement of caisson accelerations and gyrations; measurement of the three surfaces of the caisson in contact with water; and a real-time remote control for all the parameters of the instrumentation.
The instrumentation at Botafoc, thanks to efforts from many people, companies and institutions involved, and based on previous experiments, is atop of breakwater instrumentating all over the world and, from 2003 on, has got great technical results, some of those are introduced in this paper, and represent a first step for other investigations on course or just waiting to start.
BOTAFOC BREAKWATER INSTRUMENTATION
The Botafoc breakwater was built in 2002 with the purpose of creating a new dock with an increased draft in the port, as well as sheltering the already existing port installations and creating new berths. The breakwater is built from the already existing Botafoc lighthouse to the Southeast and is constituted by caissons anchored at an elevation of -19.50 m.
During its construction the places needed to install two identical sections at the #8 caisson were planned, mainly to check the security coefficients both of gyration and sliding, and in second term to develop new theories linking the forces exerted on the breakwater and its actual movements.
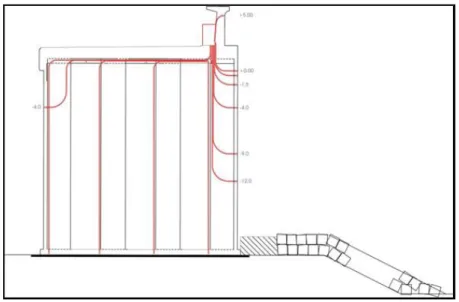
For each of the instrumented sections twelve sensors were installed, located at the surfaces in contact with water at different elevations, as it is shown in figure 1, 7 pressure sensors located at the outside vertical wall, elevations being between -12.00 m and +5.00 m, one more pressure sensor located at the sheltered wall at -4.00 m with the purpose of measuring the actual hydrostatic pressure as well as the incidental stir in the dock; and four sub-pressure sensors at the bottom surface. In order to increase the optimal working life of the whole device the sensors chosen were fully made of titanium, flush mounting, and using as signal transmission a 4-20 mA current curl, aiming to eliminate as many parasite signals as possible, those parasite signals being created due to interferences with other devices working in the zone.
The full system, composed of pressure sensors and moving and accelerations detection system, include a datalogger and remote control software that enable data acquisition as well as remote data downloading, so that it becomes a system fully remote controlled. As a complement of the devices described an atmospheric pressure sensor was installed aiming to evaluate the correct calibration of the sensors installed, though having an airing tube themselves to measure relative pressure.
All data are acquired continuously, the device having a storage equivalent to six months of data acquisition considering the current acquisition rate.
BOTAFOC INSTRUMENTATION WORKING POLICY
Botafoc breakwater working policy has previously been exposed and is based on two premises: firstly, the measurement of pressures, sub-pressures and movements, in an attempt to elude measuring pressures and obtain the actual movements instead; and secondly, pressure measurement at the three surfaces in contact with water to avoid separating statics from dynamics concerning pressure’s law.
Figure 1. Instrumented section with twelve pressure and sub-pressure sensors
superstructure on the caissons, the caisson’s real mass and centre of gravity (these data being unknown due to the fact that a caisson is not constituted by a homogeneous material) and the caisson’s points of gyration and swinging. So, the #8 caisson is effectively a fictitious rigid body that covers, not only the referred caisson, but also parts from the adjacent caissons and the superstructure laying on the caisson that takes part in the movement. On the other hand, regarding the frequency of the actions and reactions, the former, due to waves, have the same frequency as the waves involved, but regarding the latter, they have their own frequency, different from the waves’. If the frequency of the actions gets close to the rigid body considered could get to resonance frequency.
From these premises, the movement of the rigid body considered can be assimilated with an oscillation with viscous cushioning.
Another huge difference between this and other instrumentations in use in Spain is measuring pressures from the three surfaces in contact with water, so there is no need to separate the supposed part, corresponding to the hydrostatic pressure, and the part corresponding to dynamic pressure due to interaction between a moving fluid and the structure. The fact that both hydrostatic and dynamic pressures cannot be separated, and so the contribution of each of them to the pressure law is unknown, has to be considered.
By measuring only in two of the three surfaces in contact with water a hydrostatic pressure level has to be supposed, even having a tide gauge synchronized with pressure data acquisition, hydrostatic data are not guaranteed to be appropriate. An example can be the following: outside there are 4 metre high waves, and a wave trough is coming into contact with an instrumentated section, being the outside water level 2 m bellow average, while inside the sheltered zone it is 0.5 m over average. Assuming the same hydrostatic level for that instant entails a huge error. On the other hand, this example is also valid in the three dimensions case instead of a single section, considering that there can be a trough and a crest coming into contact with each section respectively at the same time, apart from the existing level in the sheltered zone.
DATA ACQUISITION AND TREATMENT
The installation directs its data to a computer network that keeps the data inside several hard disks, also putting up control and visualization applications from the data acquisition. These applications can be controlled in situ or by remote control by using a suitable computer application.
optimization of several analysing methods introduced in this paper and summarized as it follows:
• Fourier analysis, made in order to determine how useful data are and the proportion of “electronic noise” inserted in the signal.
• Filtering of the gross signal got by the sensors. This filtering produces signal flattening that eliminates oscillations around the signal base level.
• Continuous signal sampling and statistics are obtained with a computer application developed for that purpose, and that means calculating signal statistics for each sensor (average, minimum, maximum, zero crosses, wave period, etc.) for a period of time to be determined through days, weeks or even full months.
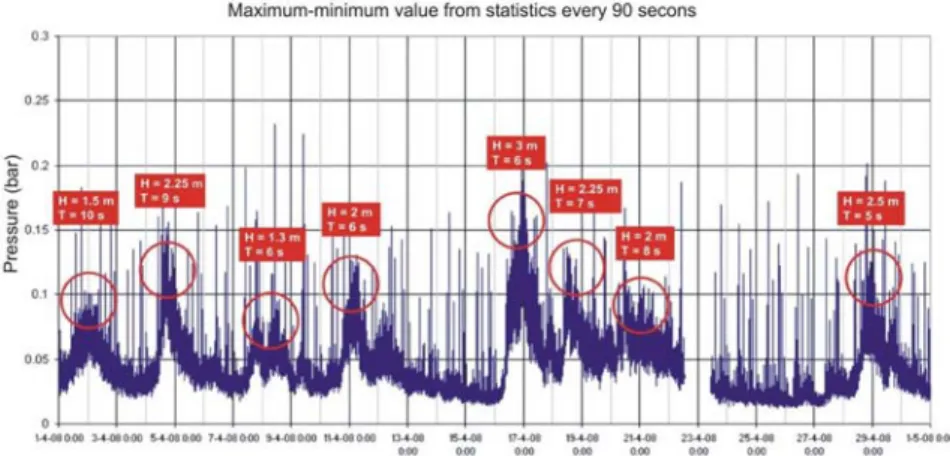
In order to show the result obtained the graph got from filtered data acquired by sensor 5 in section 2 through a month shows two different statuses, with little waves and with a lot of waves. The graph shows statistics (maximum, minimum and average values) for 90-second-long samples (roughly 12 waves) through a period of 20 days. Average, maximum values and minimum values are represented by three different colours. In these graphs other aspects of the waves registered can also be seen, such as:
• The distance between the maximum band and the minimum band represents the pressure due to wave action from a crest to the immediate trough.
• When a sensor is near the surface and waves are intense, if the trough of a wave comes into the breakwater, that sensor can remain dry, registering a flat graph as for minimum values.
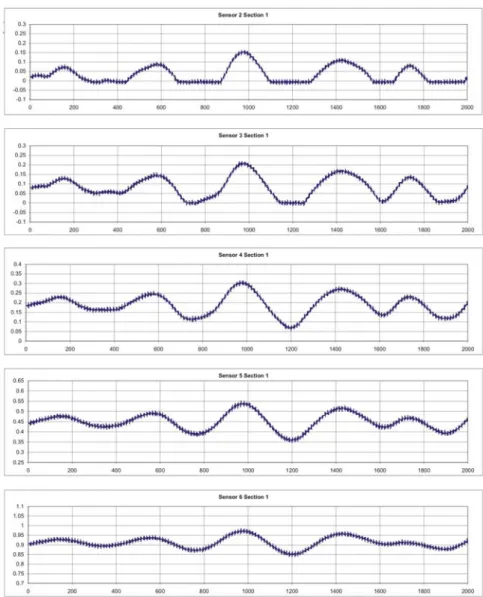
In order to find out the highest waves the statistics graph is amplified around its maximum value, getting for this particular moment a 30-second-period where the group of waves come into the breakwater, including the wave consider as worst (highest) in the total period analysed. Figure 2 shows simultaneous registering from main wall sensors from a wave group.
These computer applications developed make possible to make a tidal research of the zone (Island of Ibiza, in this case).
Comparing the average level statistics registered by a sensor with the tide registered at port of Ibiza (thanks to the tide gauge installed) the perfect coincidence between both of them can observed at first sight. This application also enables statistical calculation from single waves when crossing the average level. This is how a sequence of data pairs (amplitude and period) are calculated and represented by a graph.
can have when impacting with the breakwater, being a unique kind of research as far as stability in structures with a rigid behaviour when failing.
MOVEMENTS SUFFERED BY THE CAISSON
Section 2 (furthest from Botafoc lighthouse) has its main controlling system inside a booth, but this booth also contains a system that enables the registering of all the movements suffered by the caisson, both gyrations and accelerations, considering this registering most important in case of severe storm.
For a better understanding of the results given by system, further forward shown, the reference axes used must be considered as they were agreed, as well as the signs agreement concerning gyrations. The system was installed with the positive X axis pointing seawards, perpendicular to the breakwater’s longitudinal axis, the positive Y axis parallel to the breakwater, pointing at the jetty head, the positive Z axis being vertical and pointing downwards. Accelerations will be positive if pointing at the positive side of the axis, while gyrations will be positive if clockwise.
This system is used to analyse the movements suffered by the caisson, not only due to waves, but also due to ship docking. Most of the accelerations are projected on the Y axis (parallel to the breakwater longitudinal axis), and that does not occur when analysing wave impacts (projected on the X axis, perpendicular to the breakwater).
Concerning the magnitude, both accelerations, due to waves during a storm and due to docking, have a similar order of magnitude, the accelerations being roughly 0.20g projected on the Y axis during docking, representing the equivalent to a storm with wave heights of about 4 metres.
On the other hand, docking takes much lesser time than a severe storm, in the case of a storm forces are pulsating from wave to wave, prolonging this situations for many hours.
MOVEMENTS AND WAVES CORRELATION
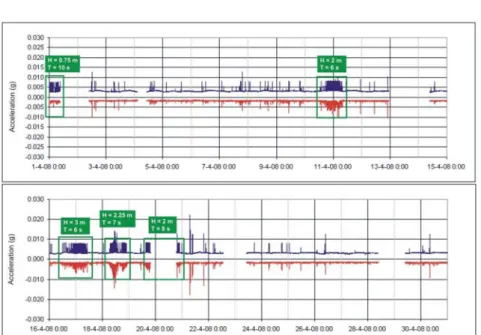
Waves at Botafoc throughout April 2008 show maximum values that are represented on the graph shown in figure 3, along with the respective significant wave height and peak period. It can be noticed how there are periods that make waves move the seawall along the X axis considerably above noise threshold (see figure 4).
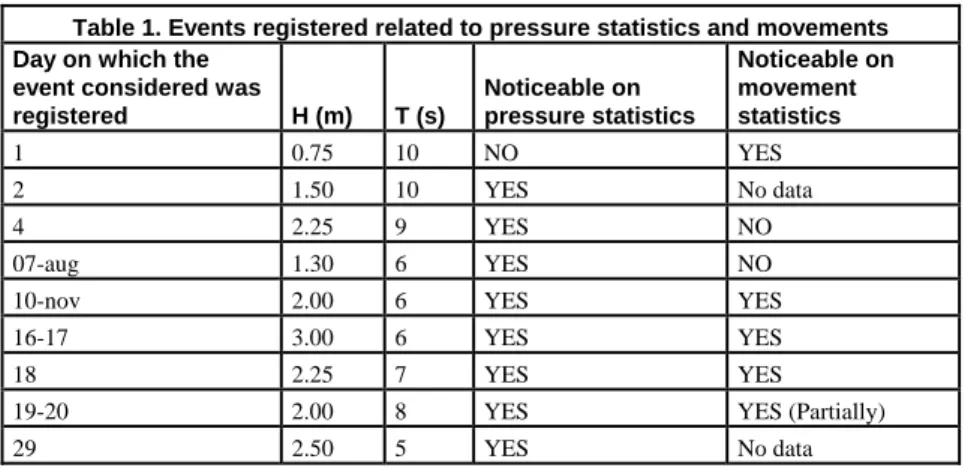
The existence of a “wave threshold” from which the seawall moves can be noticed from the data shown on table 1, and it is associated to a wave height of about 2 meters. The only exception was registered on day 1, when movements were registered with a wave height of about 0.75 meters.
Table 1. Events registered related to pressure statistics and movements Day on which the
event considered was
registered H (m) T (s)
Noticeable on pressure statistics
Noticeable on movement statistics
1 0.75 10 NO YES
2 1.50 10 YES No data
4 2.25 9 YES NO
07-aug 1.30 6 YES NO
10-nov 2.00 6 YES YES
16-17 3.00 6 YES YES
18 2.25 7 YES YES
19-20 2.00 8 YES YES (Partially)
29 2.50 5 YES No data
SHIP DOCKING AND MOVEMENTS CORRELATION
Observing figure 5 it is noticeable that there are short periods of time when movements are registered beyond “noise threshold “. These movements are due to ship docking. There is no system available to measure rope tension at Botafoc, but a ship docking register can be used to determine movements due to that fact. Analysing a ship docking register it is easy to observe events like that shown on figure 5.
Making a statistical analysis on the graph represented on figure 5, and assuming the peak marked on figure 5 corresponds to ship docking maneuvers, it is possible to get a graph that shows the complete register of the impacts made by the ship for the three axes considered. On the other hand, it has to be said that the most remarkable accelerations experimented by the caisson due to ship docking are through a short period of time (under a minute), compared to the pulsating accelerations through many hours produced by waves.
So, concerning this field, the data obtained with this installation are totally innovative and have to submit all the initial criticism that every innovation demands to be validated.
CURRENT INVESTIGATIONS
Figure 2. Simultaneous registering from main wall sensors from a wave group.
totally innovative and have to submit all the initial criticism that every innovation demands to be validated.
CONCLUSION
The initial purpose was to get an alert system to prevent the breakwater from failures for a critical installation, Botafoc breakwater being an example of that, hopefully achieving this feat through 2008.
ACKNOWLEDGEMENTS.
These activities are taking part thanks to a great contribution from the Balearic Port Authority, so there is a need to acknowledge this valuable cooperation, especially to Angel Matías (co-author of this paper), Joaquín Jiménez, Jorge Martín (also a co-author of this paper) and Armando Parada.
Thanks, as well, to all the people involved directly or indirectly with the maintenance and exploitation of all the data got from the installation of the #8 caisson at Botafoc breakwater in the port of Ibiza, whether belonging to university, the Balearic Port Authority or the state-owned Puertos del Estado.
Figure 4. These graphs show acceleration on X axis statistics and significant wave height and peak period.
REFERENCES
Almazán Gárate JL Et Al. (2000). Descripción, Medida Y Análisis Del Oleaje. E.T.S. De Ingenieros De Caminos, Canales Y Puertos.
Almazán Gárate JL Et Al. (1999). Estática De Fluidos. E.T.S. De Ingenieros De Caminos, Canales Y Puertos.
Amorós JR, Llorca J, Elvira AR, Lopez JD, Larraz MA (1997). Instrumentación En Prototipo De Un Dique De Cajones. Caso Del Dique De Reina Sofía Del Puerto De Las Palmas. IV Jornadas Españolas De Ingeniería De Costas Y Puertos, Mayo De 1997. Universidad De Cádiz.
Goda Y (1985) Random Seas And Design Of Maritime Structures. Tokyo: University Of Tokyo Press.
Goda Y (1994) Dynamic Response Of Upright Breakwaters To Impulsive Breaking Wave Forces. Procedings International Conference Coastal Engineering, 22 P . 135-158.
Oumeraci H (1994) Review And Analysis Of Vertical Breakwaters Failures – Lessons Learned. Coastal Engineering, Vol 22: Pp 3-29
Oumeraci H (1998) Wave Impact Loading And Dynamic Response Of Vertically Faced Breakwaters. European Reserch Project Mast Iii/Proverbs.
Takahashi S (1996) Design Of Vertical Breakwaters. Breakwater Design. International Conference On Coastal Engineering, Orlando, Short Course