SUSTAINABLE FOREST MANAGEMENT RESEARCH INSTITUTE
Department of plant production and forest resources
SUSTAINABLE FOREST MANAGEMENT IN
POPLAR PLANTATIONS: FOREST HEALTH AND
BIODIVERSITY CRITERIA
Doctorate programme on “Conservation and Sustainable
Management of Forest Systems”
The present thesis fulfils the necessary requisites to obtain the
International Doctorate Mention through the University of Valladolid
Jorge Martín García
ESCUELA TÉCNICA SUPERIOR DE INGENIERÍAS
AGRARIAS
DEPARTAMENTO DE PRODUCCIÓN VEGETAL Y
RECURSOS FORESTALES
TESIS DOCTORAL
GESTIÓN FORESTAL SOSTENIBLE EN
PLANTACIONES DE CHOPO: CRITERIOS
DE SANIDAD Y BIODIVERSIDAD
Presentada por Jorge Martín García para optar
al grado de doctor por la Universidad de
Valladolid
Dirigida por:
Es ahora en la recta final de la tesis, cuando me he dado cuenta que esta tesis doctoral es mucho más que un documento. Seguramente, este periodo me ha marcado desde un punto de vista profesional, pero aún más desde el personal, ya que esta tesis es una parte de mi vida, de mis experiencias personales y de mis aventuras/desventuras por España y el extranjero. Me ha acompañado en mis etapas por Palencia, Ponferrada, Burgos, Plasencia, Burdeos, Helsinki y en estos momentos por Aberdeen, y por ello me recuerda muy buenos momentos y sobre todo grandes amigos.
Me gustaría agradecer a la Universidad de Valladolid la oportunidad que me brindó para hacer mi tesis doctoral, al otorgarme una beca para la Formación de Personal Investigador. También cabe recordar que la financiación de la presente tesis doctoral fue sufragada por la Unión Europea y la Junta de Castilla y León en el marco del proyecto FORSEE (INTERREG IIIB). De una forma muy especial me gustaría dar las gracias a mi director de tesis, Julio Diez, por introducirme en el mundo de la investigación y ser un gran referente en este peregrinar. Ahora recuerdo cuando empecé a colaborar en el laboratorio con el proyecto fin de carrera de forestales, hace de eso más de 10 años, y desde entonces siempre he recibido su apoyo y comprensión.
También me gustaría agradecer a mi codirector, Hervé Jactel, que me aceptase e integrase en su grupo de investigación. De él aprendí una forma distinta de trabajo y sin lugar a duda a optimizar el tiempo.
Creo que echaré mucho de menos Burdeos, el INRA-Pierroton y mi habitación “chêne”, ya era una costumbre hacer una estancia todos los veranos y una buena razón para visitar a mis colegas franceses. Entre ellos, destacar a JC por ser un gran amigo y ofrecerme su casa siempre que la necesité (en esas noches de Burdeos). También quiero dar las gracias a Christophe por su asistencia profesional durante el FORSEE, pero fundamentalmente por su amistad, invitándome todos los años a pasar un rato con su familia. Quiero recordar también a Anne-Maïmiti, Inge, Dominique, Fabrice, Ondine, Guillaume, Jean-Sebastien, Julien, etc.
También me gustaría dar las gracias al METLA por brindarme la oportunidad de hacer una estancia de investigación en su centro. De forma muy especial a Michael, que no sólo es un gran investigador, sino también una gran persona. También agradecer a Jarkko y a Marja-Leena su asistencia técnica siempre que la necesité. Y como no, a todos los amigos de “Puimala”, Nichi, Joana, Alison, Amy, Jose, Fran, Claire, Elena, Ana, etc por hacer de esta estancia algo diferente. Quisiera tener también un recuerdo para las personas con las que comparto en estos momentos mis ensayos en la Universidad de Aberdeen. Especialmente para Steve por aceptarme en su grupo y hacerme sentirme uno más, a Eleni por facilitarme tanto las cosas y a Stuart por echarme una mano con el inglés.
También quisiera agradecer a todos aquellos que han colaborado de una u otra forma en esta tesis, Agustín Merino, Elba Espiga, Valentín Pando, Juan Andrés Oria de Rueda, Raúl Fraile, Luis Santos, Luc Barbaro, la guardería forestal de Carrión, en especial a Carlos García, y todos aquellos compañeros del FORSEE.
todo pronóstico fue capaz de sobrevivir al frío castellano y finlandés, y que siempre recordaré por ser mi compañero en “la estancia” por tierras norteñas. A Celia a quien tengo un cariño especial. También a los que empezaron justo después Leti y Encarna por traer aire fresco a la escuela y por ayudarme en la recta final, Estela Bogino por darme la oportunidad de conocer Argentina, y a Iñaki, Laura, María y Antonio por esas cañas. A los que empezaron después, Pablo (mi sucesor y promesa del laboratorio), Masum, Carmen, Cristina, Diana, Gonzalo, etc. A mis amigos de Ponferrada, y en especial a Alejandro, Oscar, Cris y Silvia, por hacer que mi etapa por Ponfe sea uno de mis mejores recuerdos, y por ser una buena razón para volver a menudo.
A mis compañeros de Burgos, especialmente a los amigos de “la anexa” Carol, Palmira, Alejandro e Isa que hicieron tan agradable el trabajo (incluso en esas condiciones tan adversas). A Santi y Roberto, que me ensañaron que el mus es la mejor excusa para disfrutar de los amigos. También a Juan Manuel por su afecto y sus consejos profesionales, entre ellos uno que siempre tengo presente “el papel lo aguanta todo pero el monte no”. A la guardería forestal de Burgos, con un recuerdo muy especial a Juan Reche que nos abandonó antes de tiempo, y a Cesar y Santi con los que tanto disfrute por los montes burgaleses.
A todos mis compañeros de Plasencia, por su amistad y apoyo en situaciones a veces difíciles de comprender.
A los colegas de Carrión, Richi, Diego, Amador, Javi, Crespo, Moy, Paco, Gallego, David, Mariano, Iñaki, etc. con los que he compartido toda mi vida y son una de las razones por las que siempre vuelvo al pueblo.
A los “personajes” por mantenerse desde el primer año de carrera y estar cada año más unidos, David por tu gran humor y por ser el engranaje del grupo, Chus por intentar poner un poco de sensatez, Miguel por enseñarnos ese mundo paralelo, Cere por ser incluso mejor que su vino, y especialmente a Chemari, porque por muchos pisos en los que haya vivido siempre será “mi compañero de piso”, sin ninguna duda una de las mejores personas que conozco y que más aprecio.
A Laura que está sufriendo los daños colaterales de una carrera investigadora, animándome en todo momento y entendiendo/aceptando que son necesarios ciertos sacrificios, renunciar a vacaciones más allá de un fin de semana largo y lo más duro tener que vivir distanciados y no vernos todo lo que nos gustaría.
Abstract in English ... 1
Abstract in Spanish ... 2
List of original articles ... 3
Introduction ... 4
Aims of the study ... 11
Materials and Methods ... 12
Results ... 19
Discussions ... 23
Final conclusions in English ... 29
Final conclusions in Spanish ... 31
References ... 33
1 Abstract
Martín-García, J. 2012. Sustainable Forest Management in poplar plantations: forest health and biodiversity criteria.
Sustainable Forest Management (SFM) emerged as a response to an increase in awareness of the deterioration of the environment and, in particular, an alarming loss of forest resources. The implementation of SFM is generally achieved through criteria and indicators (C&I), and although different sets of C&I have been implemented according to country, all of them agree that forest health and biodiversity criteria must be keystones in SFM. The objective of this thesis was to test the current indicators and search for new indicators of forest health and biodiversity criteria in poplar plantations, which may be able to assess the sustainability of changing ecosystems. Towards this purpose, a wide variety of both poplar plantations and the remnant patches of natural riparian forests were surveyed. The results suggest that both abiotic and biotic stresses are associated with forest health in monoclonal poplar plantations and may therefore be used as indicators. Although no dramatic phytosanitary problems have been displayed in these poplar plantations so far, the outcomes seem to suggest that soil properties, and mainly coarse fragments, determine tree vitality. Hence, the use of classification functions developed from soil properties would be desirable to ensure that new plantations will be established on suitable lands. In addition, an assessment of 1) digital crown transparency by CROCO software, 2) Sesia apiformis population by a
pheromone trapping system or 3) endophytes fungi may be used to evaluate the sustainability in poplar plantations. On the other hand, the studies carried out through three different taxonomic groups, including bird, vascular plant and fungi, showed marked differences on species, structural and functional diversity between poplar plantations and native riparian forests. Nevertheless, a suitable management at local level (minimising the use of harrowing) and at landscape scale (increasing the percentage of poplar plantations in relation to other crops) may favour vascular plant and bird diversity in poplar plantations. The results indicate that these taxonomic groups may be used as indicators of biodiversity for SFM in poplar plantations.
Keywords: Sustainability, Populus, indicator, biotic, abiotic, nutrients, pest, crown
2 Resumen
Martín-García, J. 2012. Gestión Forestal Sostenible en plantaciones de chopo: criterios de sanidad forestal y biodiversidad.
La Gestión Forestal Sostenible (GFS) nació como respuesta al incremento de la conciencia ambiental de la sociedad ante el deterioro del medio ambiente y, en particular, de la alarmante pérdida de recursos forestales. La implementación de la GFS se consigue a través de criterios e indicadores (C&I), y aunque diferentes conjuntos de C&I han sido desarrollados según el país, todos ellos están de acuerdo en que los criterios de sanidad forestal y biodiversidad deben ser piezas claves en la GFS. El objetivo de esta tesis fue evaluar algunos de los actuales indicadores y buscar otros nuevos dentro de los criterios de sanidad forestal y biodiversidad, los cuales puedan ser capaces de evaluar la sostenibilidad de ecosistemas cambiantes. Para este propósito, se muestrearon una amplia variedad de plantaciones de chopo junto con bosques de ribera existentes en el área de estudio. Los resultados sugieren que tanto factores abióticos como bióticos condicionan la sanidad forestal en las plantaciones monoclonales de chopos y por lo tanto podrían ser usados como indicadores. Aunque no se han encontrado graves problemas fitosanitarios en estas plantaciones hasta la fecha, los resultados parecen sugerir que las propiedades de suelo, y principalmente los elementos gruesos, determinan la vitalidad de los árboles. Por eso, sería aconsejable la utilización de las funciones de clasificación desarrolladas a partir de las propiedades de suelo para asegurar que las futuras plantaciones se establezcan en terrenos aptos para la especie. Además, (1) la transparencia de copa calculada mediante el software CROCO, (2) las poblaciones de Sesia apiformis estimadas mediante un sistema de trampeo con
feromonas o (3) los hongos endófitos, podrían ser utilizados para evaluar la sostenibilidad de las plantaciones de chopo. Por otro lado, los estudios llevados a cabo en tres grupos taxonómicos diferentes, incluyendo hongos, aves y plantas vasculares, apuntaron notables diferencias en la diversidad de especies, la estructural y la funcional, entre plantaciones de chopo y bosques de ribera. Si bien, un manejo adecuado a nivel de parcela (minimizando el número de gradeos) y a nivel de paisaje (incrementando el porcentaje de plantaciones de chopo en detrimento de cultivos agrícolas) podría favorecer la diversidad de aves y plantas vasculares en las plantaciones de chopo. Los resultados indican que estos grupos taxonómicos podrían ser usados como indicadores de biodiversidad para evaluar la GFS in plantaciones de chopo.
Palabras clave: Sostenibilidad, Populus, indicadores, bióticos, abióticos, nutrientes,
3 LIST OF ORIGINAL ARTICLES
The thesis consists of the following articles, which in the text will be referred to by their Roman numerals.
I. Martín-García, J. & Diez, J.J. (2012) Sustainable forest management: an introduction and overview. In: Sustainable forest management – current research, J. Martín-García & J.J. Diez (Eds.), 3-16 (454 pp). InTech, Rijeka
(Croatia). ISBN 978-953-51-0621-0.
II. Martín-García, J., Díez, J.J. & Jactel, H. (2009) Towards standardised crown condition assessment in poplar plantations. Annals of Forest Science 66: 308-314.
III. Martín-García, J., Merino, A. & Diez, J.J. (2012) Relating visual crown conditions to nutritional status and site quality in monoclonal poplar plantations (Populus x euramericana). European Journal of Forest Research 131:
1185-1198.
IV. Martín-García, J., Jactel, H. & Diez, J.J. (2011) Patterns and monitoring of Sesia apiformis infestations in poplar plantations at different spatial scales. Journal of
Applied Entomology 135 (5): 382-392.
V. Martín-García, J., Espiga, E., Pando, V. & Diez, J.J. (2011) Factors influencing endophytic communities in poplar plantations. Silva Fennica 45 (2): 169-180. VI. Martín-García, J., Müller, M. & Diez, J.J. (2012) ITS-based comparison of
endophytic mycota in twigs of native Populus nigra and cultivated P. x euramericana (cv. I214) stands in Northern Spain. Annals of Forest Science
69: 49-57.
VII. Martín-García, Barbaro, L., Diez, J.J. & Jactel, H. (2012) Contribution of poplar plantations to bird conservation in riparian landscapes. (In prep. to be submitted to Biodiversity and Conservation)
4 INTRODUCTION
Sustainable Forest Management
The concept of forest sustainability is not a new concept and dates from centuries ago (Wiersum, 1995), although the understanding of sustainable forest management (SFM) as an instrument that harmonizes ecological and socio-economic concerns is relatively new. The change in perspective occurred at the beginning of the 1990s in response to an increased awareness of the deterioration of the environment, in particular of the alarming loss of forest resources. Nevertheless, although the rate of deforestation and loss of forest has slowed down from 16 million hectares per year in the 1990s to around 13 million hectares per year in the last decade (FAO, 2011), the loss of forest varies according to the region. While the forest area in North America, Europe and Asia has increased in the past two decades (1990-2010), it has decreased in other regions such as Africa and Central and South America, and to a lesser extent Oceania. Nevertheless, other statistics such as the disturbing decrease in primary forests1
The implementation of SFM is generally achieved using criteria and indicators (C&I). Criteria are categories of conditions or processes whereby sustainable forest management can be assessed, whereas quantitative indicators are chosen to provide measurable features of the criteria and can be monitored periodically to detect trends (Brand, 1997; Wijewardana, 2008) and qualitative indicators are developed to describe the overall policies, institutions and instruments regarding SFM (Forest Europe, 2011).
(40 million hectares in the last decade) and the increase in planted forests (up to 7% of the world’s forests) (FAO, 2011) appear to indicate that to achieve forest sustainability, we must go beyond analysis of the changes in the total forest area worldwide.
The popularity of the C&I system is evident from the effort invested in its development in recent decades and from the large number of countries that are implementing their own sets of C&I within the framework of the nine international or regional process (African Timber Organization [ATO], Dry Forest in Asia, Dry Zone Africa, International Tropical Timber Organization [ITTO], Lepaterique of Central America, Montreal Process, Near East, Pan-European Forest [also known as the Ministerial Conference on the Protection of Forest in Europe, MCPFE] and Tarapoto of the Amazon Forest). Nevertheless, although different sets of C&I have been implemented according to country, all of them agree that forest health and biodiversity criteria must be keystones in SFM.
In addition to the efforts of different states to develop C&I in the last two decades, a parallel process has been developed to promote SFM at a commercial level. This
1 Forest of native species where there are no clearly visible indications of human activities and the
5
process is termed “forest certification”. Forest certification can be defined by a voluntary system conducted by a qualified and independent third party who verifies that forest management is based on a predetermined standard and identifies the products with a label. The standard is based on the C&I approach and the label, which can be identified by the consumer, is used to identify products.
Forest certification was designed as a tool whereby everyone should benefit (win-win situation): forest owners should have an exclusive market with premium prices; the forest industry should improve its green corporate image, should not be held responsible for deforestation, and should have a marketing tool available; consumers should be able to use forest products with a clear conscience; and overall, forests should be managed sustainably.
Forest health
The term “forest health” grew in popularity in the 1980s and 1990s, becoming a relevant issue for everybody (foresters, researchers and society at large). Nevertheless, although countless definitions have been provided, a consensus has not been finally arrived at. Kolb et al. (1994, 1995) opened Pandora’s box in trying to clarify the
concept “forest health” using utilitarian and ecosystem perspectives. Since then, an intense public debate has taken place (Staebler, 1994; DellaSalla et al., 1995; DellaSalla & Olson, 1996; Jenkins, 1997; MacCracken, 1997; LaSalle, 1998; Abrams et al., 2005; Warren, 2007; Marshall, 2009; Raffa et al., 2009; Turner, 2009), but there remains no universally accepted definition of forest health.
Beyond this controversy, forest health is being monitored practically all over the world through forest health monitoring programs. Thus, a forest health monitoring program has been carried out in Europe since the 1980s within the International Co-operative Programme, ICP Forest, as a result of several reports of declining forest in some parts of Europe. However, the ability of such a systematic network to capture the real health condition of the European forest has been questioned for several reasons. Firstly, a systematic sampling design based on a 16 by 16 km grid (more than 6,100 plots) is not able to monitor those small and fragmented forest types (Innes, 1988, 1993; Ferretti, 1997). This is the case of poplar plantations, which cover almost a million hectares in Europe and yet there are only 24 plots of Populushybrids monitored within
the European Level I Network (Fisher et al., 2010). Secondly, a common sampling
intensity is utilised for all types of forests, butpoplar, willow and eucalyptus plantations are often monoclonal, and protocols developed to assess health conditions in other types
of forest may not be relevant. In particular, as the variability of traits between trees is
lower, one can assume that tree clones will be similarly damaged (Braganca et al.; 1998;
6
such as crown transparency and discoloration, among others, remains questionable, in
spite of the fact that a considerable effort has been devoted to improve the assessment of
these variables (Ferretti, 1997). Traditionally, these variables are visually estimated by observers from the ground, which implies a degree of subjectivity that impedes a proper comparison between countries and even through time within the same country (Innes, 1988, 1993; Mizoue & Dobbertin, 2003). The sources of error in the quantitative assessment of crown condition are many, including variation in the expertise of observers, weather conditions, crown appearance, tree species, tree age and social position (Innes, 1988, 1993; Innes et al., 1993; Ghosh et al., 1995; Solberg & Strand,
1999; Wulff, 2002; Redfern & Boswell, 2004).
Nevertheless, in spite of the problems listed above, indicators of Sustainable Forest Management developed by Pan-European Process (MCPFE) to assess its criterion “forest health and vitality” were essentially based on this health monitoring program and therefore it should be thoroughly re-examined. Thus, taking into account the fact that the health of forests can be subjected to numerous abiotic and biotic stressors (Ferretti, 2004) and the peculiarities of poplar plantations, the current indicators, which gauge the sustainability of this type of plantation, should be assessed and new indicators identified. This is even more urgent now that natural disturbances that have an impact on the health of forests will be altered by climate change (Kirilenko & Sedjo, 2007; Woods et al., 2010).
Biological diversity
The term “biodiversity”, a contraction of “biological diversity”, has increased in popularity within the last two decades since the Conference on Environment and Development held in Rio de Janeiro, Brazil, in 1992 (the so-called Earth Summit). Although countless of definitions can be found from the literature (Wilson, 1988; Reaka-Kudla et al., 1996; Maclaurin & Sterlny, 2008), the most broadly accepted is that
reached at the Earth Summit “the variability among living organisms from all sources including terrestrial, marine and other aquatic ecosystems and ecological complexes of which they are a part: this includes diversity within species, between species and of ecosystems”.
As with its definition, there are many different classifications for the subdivisions of biodiversity within the literature. Carnus et al. (2006) established four components of
7
It is well known that biodiversity provides numerous benefits for society, such as key natural resources for our survival, sources of medicine, maintenance of ecological processes or improvement of air and water, among others. Nevertheless, even nowadays an alarming loss of biodiversity is still taking place all over the world and mainly in tropical forests (FAO, 2010). Furthermore, although it is likely that one of the greatest threats to biodiversity is climate change (Oman et al., 2009; Dawson et al., 2011; Urban et al., 2012), other challenges such as economic growth should not be underestimated.
The current growth in the world population (now > 7,000 million people) and the high economic growth of developing countries will lead to greater use of natural resources, which may lead to a higher loss of biodiversity. Hence, although several studies have concluded that there is no conflict between economic growth and biodiversity (Dietz & Adger, 2003; Fuentes, 2011), this aspect should be taken into account for future policies.
Fortunately, nowadays the importance of maintaining biodiversity is not just of interest to researchers, but to society at large. Thereby, new environmental and forest policies are being designed to protect biodiversity, which is evident in international conventions of biological diversity, the sustainable forest management processes implemented by most countries and the forest certification schemes.
Nevertheless, if it is accepted that biodiversity is, in one sense, everything (Wilson, 1996), then the way to measure biodiversity becomes the Achilles’ heel. Obviously, the overall biodiversity in forest ecosystems cannot be measured and quantified comprehensively, hence indicators may be a relevant option (Noss, 1999). Biodiversity indicators can be based on genetic diversity, species richness, indicator species or functional diversity of one or several taxonomic groups, assuming that the diversity of these groups is correlated with other groups or that a wide range of ecological information is covered (Maes & Van Dyck, 2005; Rossi & Halder, 2010). Nevertheless, the first assumption should be tested because contradictory results are frequently reached, while some authors have identified indicator groups (Ormerod & Watkinson, 2000; Gregory et al., 2005; Dynesius & Zinko, 2006), others have not
(Predergast & Eversham, 1997; Duelli & Obrist, 1998; Dauber et al., 2003; Wolters et al., 2006). This implies that although the overall taxonomic groups cannot be measured,
a selection of them based on their mobility, mode of dispersal and their habitat requirements should be carried out to collect information at both local and landscape levels.
Most studies have focused on taxonomic groups well known by ecologists, such as birds, vascular plants, lichens, butterflies, carabids, ants, bees, etc. Among them birds are often considered as efficient indicators by playing an essential functional role in ecosystems at, or near, the top of the food chain (Ormerod & Watkinson, 2000; Gregory
8
across levels since bird communities typically select habitat features at multiple scales (MacFaden & Capen, 2002; Warren et al., 2005; Mitchell et al., 2006; Barbaro et al.,
2007). Likewise, vascular plants are a faithful reflection of the situation of the forests, since vegetation is directly affected by any change, including those due to both natural disturbance and human management, and their strategies of dispersal vary according to the taxon or functional type (Grime, 2001). Thereby, vascular plants are often used as a general indicator of the broad state of wildlife (Lindenmayer et al., 2000; Gray & Azuma, 2005).
On the contrary, while great efforts have been made to study these macroscopic life forms, little attention has been paid to microbial diversity (Strobel, 2003). However, the latter, and in particular endophytic fungi, may be an even better indicator of the state of biodiversity because of their high host affinity (Fisher and Petrini, 1990; Collado et al., 2000).
Plantation forests
Although numerous definitions of planted forest can be found from the literature (FAO, 2003), plantation forests or planted forests can be defined as forests predominantly composed of trees established through planting and/or deliberate seedling (FAO 2010, Annex II). The Total area covered by planted forests is currently 264 million hectares, which represents 7 % of the World’s forests. The global area of planted forest increased by about 5 million hectares per year in the last decade, most of this was established through afforestations (FAO, 2011). Planted forests are located mainly in East Asia, Europe and North America (75 % of the global planted forest area), although East Asia reports the greatest area accounting for about 35 %, and most are found in China (FAO, 2011).
It is well known that planted forests provide a high percentage of the wood for industrial uses, such as pulp, fibreboard, particleboard, plywood, sawn timber or bioenergy industry, which are important economically to countries because of export income and employment (West, 2006). Nevertheless, some environmental organizations denounce the replacement of primary forests with plantations in developing countries, considering that plantation forests are not real forests, from an ecological point of view, and that therefore they should not be certified (WRM, 2003, 2010). On the contrary, the two most important schemes (FSC and PECF) approve the certification of forest plantations because they believe that the promotion of wood products from plantations will help to reduce the pressure on primary forests.
9
damage by biotic agents, it had also been contradicted (Gadgil & Bain, 1999). However, several reviews have recently shed light on this aspect concluding that higher damages caused by pest and diseases were found in monocultures than mixed stands (Jactel et al.,
2005; Pautasso et al., 2005).
Despite the fact that planted forests have been traditionally viewed as “green deserts”, this perception is currently being challenged. Although many researchers have pointed out that biodiversity in planted forests is lower than in native forests (Hanowski
et al., 1997; Twedt et al., 1999; Cheng, 2004; Barlow et al., 2007; Makino et al., 2007),
several reviews have shown that plantations can provide valuable habitat for indigenous flora, fauna and fungi (Hartley, 2002; Carnus et al., 2006; Stephens & Wagner, 2007;
Brockerhoff et al., 2008; Bremer & Farley, 2010). However, there seems to be
unanimity in that natural forests are usually more suitable as habitat for a wider range of native forest species, but that plantations could contribute to biodiversity when established on degraded lands or agricultural crops.
Poplar plantations
The area covered by poplar forests represents only about 2 % of the total forest area worldwide (FAO, 2008), however its importance from an ecological and economic point of view is evident beyond statistical data. As expressed, for example, by the establishment of the International Poplar Commission (IPC) in 1947, which presently comprises 37 member countries and is aiming to transfer knowledge between managers, users and researchers.
10
Plantations of hybrid poplar are of great interest in Spain because of their high profitability as a source of plywood, which reaches between 1,200 and 2,400 €/ha/year for highly favourable sites (Díaz & Romero, 2001). Single plantations are monoclonal and although several hybrids are used in Spain, Populus x euramericana(Dode) Guinier
clone I-214 (P. deltoides Marsh. !"!P. nigraL. #$!%&!'()!*+&'!,+**+-.!/'!is a female hybrid and covers about 70 % of the total area covered by poplar plantations (Fernández & Hernanz, 2004).
The density of poplar plantations, which is kept constant during the whole rotation, is approximately 278-400 stems/ha. The species has a deep root system and requires rich soils and large amounts of water, thereby poplar trees are placed in direct contact with the water table, usually at a depth of between 1 and 2.5 meters (De Mier, 2001; Fernández & Hernanz, 2004). Furthermore, poplar plantations are managed intensively in short rotations (12-16 years), weed control techniques (mainly surface ploughing) are used regularly during the first six years and all trees are pruned up to six meters from the ground level.
Riparian forests
In contrast with the increase in area covered by planted forests and, in particular, by poplar plantations, riparian zones have been modified or lost at an alarming rate during the past five decades in most European countries. Virgin vegetation of riparian zones was almost entirely lost when stream flow was regulated by storage reservoir and canalizations in the middle of the 20th century (Schnitzler, 1994; González & García, 2007). Such regulation was followed by a major conversion from native vegetation (riparian forests) to crops or planted forests such as poplar plantations.
In particular, the riparian zone in the Duero river basin, located in Castilla y León (NW Spain), was formerly characterized by several vegetation strips from the river to the external zone. The first vegetation strip had direct contact with the watercourse, which consisted of species, mainly a shrub stratum, with high water requirement and an ability to put up with floods. A second strip was located in alluvial meadow soils, which consisted of tree species that require a temporal water table with accessible deep (Lara et al., 2004). Now the first strip of vegetation in the study area is
very narrow ca. 5-7 meters, and consists of a mixed tree and shrub stratum (mainly species of genus Salix sp. and Alnus glutinosa, and to a lesser extent species of genus Populus sp), because of a lack of periodically drastic flooding. Wetland forests of the
11 AIMS OF THE STUDY
A broad consensus amongst researchers is the need to test and search new indicators adapted to each region and ecosystem, and reflect the new reality generated by global warming. Furthermore, despite the disparity of sets of C&I implemented, there seems to be unanimity in that forest health and biodiversity criteria must be keystones in SFM. In addition, the current and future increase in cover of poplar plantations as a result of national and regional policies, together with the peculiarities of the poplar plantations, due to both ecology and management, suggest the need for a more detailed study. Consequently, the main objectives are to contribute an overview of SFM and to test some current indicators and search for new indicators for forest health and biodiversity criteria in poplar plantations. To that end, abiotic and biotic stresses were studied to assess the forest health criterion, and three taxonomic groups, fungi, birds and vascular plants, were used to assess the biodiversity criterion.
More specifically the goals were:
1. To contribute an overview and identify the future challenges of Sustainable Forest Management (I).
2. To refine a monitoring method to assess the most commonly used forest health indicators (crown conditions) in poplar plantations quantitatively and objectively (II).
3. To identify the main nutrients limiting Populus x euramericana (clone
I-214), which may explain poor growth rates and crown conditions and may therefore be used as sustainability indicators (III).
4. To assess the forest health of poplar plantations using an insect pest, the hornet clearwing moth, Sesia apiformis (Clerck), and provide a suitable
monitoring tool based on a pheromone trapping system (IV).
5. To assess the usefulness of endophyte communities as indicators of forest health (V).
6. To test the effect of replacing a native tree species so threatened as the European black poplar (Populus nigraL.) with hybrid poplars (Populus x euramericana, clone I-214) on endophyte fungi diversity (VI).
7. To investigate the contribution of poplar plantations to bird conservation in riparian landscapes and to estimate the ecological implications of a substantial increase in the cover of poplar plantations (VII).
12 MATERIAL AND METHODS
Site description and experimental design.
The present study was carried out in the Duero river basin, more specifically in Palencia province (Castilla y León, NW Spain). The altitude of the study area ranges between 800 and 900 m and, in the most stands, the slope is almost flat. The average annual precipitation varies between 496 and 630 mm, and the average annual temperature, between 9 and 11.4 ºC (Ninyerola et al., 2005).
Thirty two Populus x euramericana (clone I-214) stands were selected (Figure 1),
which were chosen by use of a factorial scheme with three factors: (1) stand age (young stands of 3–7 years old or adult stands of 8–14 years old), (2) understory management (harrowed or not harrowed) and (3) site quality (Figure 2). We differentiated rich sites (quality 1 and 2) or poor sites (quality 3 and 4), according to the site quality abacus developed for the Populus x euramericana clone I-214 in the river
Duero basin (Bravo et al., 1995). Furthermore, the three native riparian forests found in
our study area were sampled to compare bird and vascular plant diversity between poplar plantations and native forests (Figure 1). These stands consisted of an upper storey of alders (Alnus glutinosa), a scattered lower storey of elders (Sambucus nigra),
common hawthorn (Crataegus monogyna) and common dogwood (Cornus sanguinea),
and a forb stratum (Figures 3).
13
Figure 2. Appearance of young (top) and adult (bottom) stands according to management, harrowed (left) or not harrowed (right).
14
Because of the fact that the aim of the study VI was to compare the endophytic mycota of native poplar (P. nigra) and hybrid poplar trees (P. x euramericana, cv.
I-214) additional stands had to be selected. Thus, three poplar plantations of clone I-214 and three native poplar stands were chosen for study, in Palencia province (Castilla y León, NW Spain) (Figure 4). The poplar plantations were 10-year-old monoclonal plantations established by the Government of the Castilla y León, whereas stands of native poplar exist as remnant patches. Native poplars of breast height diameter (10-20 cm) similar to those of the hybrid poplar sampling sites were selected for sampling.
Figure 4.Geographical location of the six sites surveyed. (a) Geographic location in Spain; (b) geographic location in the province of Palencia.
Assessment of crown condition and dendrometric variables(II, III, IVand V).
In each stand, four circular subplots of 15 m radius were monitored. These subplots were located 50 m apart from each other, at the ends of a cross located in the middle of the stand (Figure 5). Within each subplot all trees (a total of 2,695 poplar trees) were marked and sampled.
Figure 5.Sampling design of subplots
(b)
15
Crown transparency and discoloration were visually estimated and quantified using twenty classes of 5% width, according to Level I European network methodology (Eichhorn et al., 2006). Simultaneously, all trees were photographed using a digital photo camera from the same position. Crown transparency of a subset of these trees was digitally analyzed with CROCO software according to the methodology suggested by Mizoue (2002) (Figure 6).
Figure 6. Digital photo of a crown (left) and resulting image once the thresholding algorithm win-CROCO was applied (right).
Dendrometric variables, such as diameter at breast height (DBH), total height (TH), pruned height (PH), crown diameter (CD) and crown volume (VOL) were also measured in all trees.
Sampling and analysis of soils and leaves(III, Vand VIII).
16
Foliar sampling was carried out on green leaves from a minimum of 12 trees per subplot. This sampling was carried out during the first 2 weeks of September, a period when foliar nutrients are most stable in poplar (Bengoa & Rueda, 2001). Between 12 and 15 green leaves were removed from each tree, from two main branches of the upper third of the canopy. The oven-dried (60 ºC) samples of leaves were milled (0.25 mm) and digested with HNO3, in a microwave oven. Total carbon and N in milled foliar samples were analyzed by combustion in a Leco analyzer (LECO, St Joseph, Michigan, EEUU). The total concentrations of P, K, Ca, Mg, Fe, Mn, Zn, Cu, B, Ni S, Al, Cr, As, Mo, Cd, Co, Na and Pb in the digested foliar samples were determined by ICP-EOS (Perkin Elmer, Wellesley, MA, EEUU).
Pheromone trapping survey(IV)
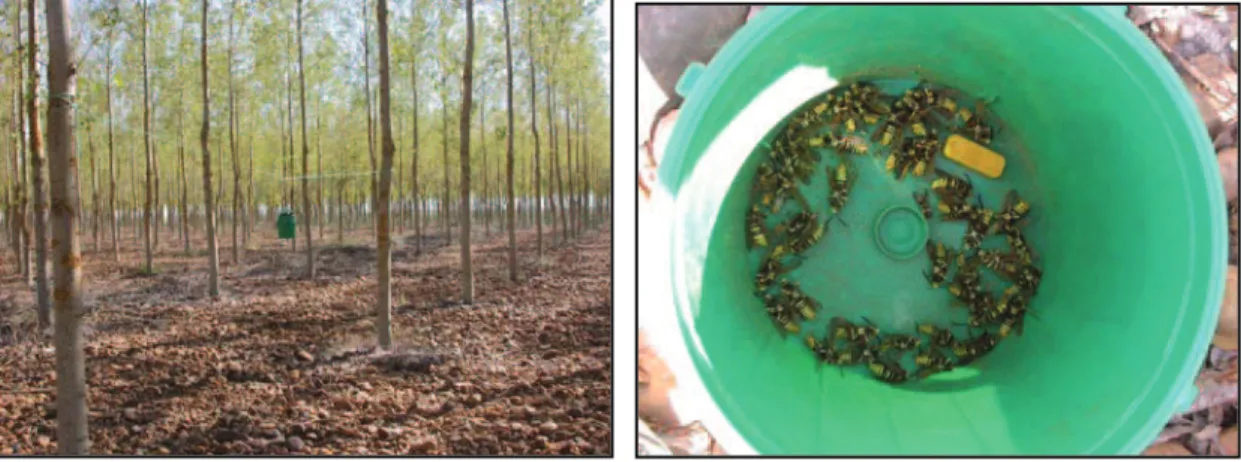
Populations of hornet clearwing moth were monitored with pheromone traps in all 32 stands (Figure 7). We used funnel traps (Uni-Trap; PHEROBANK, Wageningen, The Netherlands) baited with commercial lures (PHEROBANK) of S. apiformis sex
pheromone. Pheromone dispensers were loaded with a racaemic mixture of (Z,Z)-3,13-octadecadienyl acetate and (E,Z)-2,13-octadecadienal, with a release rate of 0.22 lg/h at 25 ºC. Traps were assessed every fortnight for a total of six times from May to August, and lures were renewed once (after 42 days).
Figure 7.Pheromone trap and captures.
Identification of fungi(Vand VI).
In the study V, fungal isolates were identified according to morphological characteristics, using a stereomicroscope the shape and colour of the colonies was analysed, and the main characteristics of fungal structures observed. Different taxonomic keys were used to identify the fungi (Lanier et al., 1978; Von Arx, 1981;
McGinnis et al., 1982; Barnet & Hunter, 1987; Goidanich, 1990; Watanabe, 1994;
17
In the study VI, fungal isolates were identified according to sequences of the internal transcribed spacer region of their rDNA. Total DNA was isolated according to Vainio et al. (1998). The internal transcribed spacer (ITS) region of the rDNA was
amplified with primers ITS1-F (Gardes & Bruns, 1993) and ITS4 (White et al., 1990).
All amplifications were performed according to White et al. (1990) and Vainio &
Hantula (2000). PCR products were purified with the High Pure PCR Product Purification Kit (Roche, Mannheim, Germany), according to the manufacturer’s instructions. The sequences were determined in an automated sequencing apparatus (Li-Cor Global Edition IR2 system; Li-Cor Inc., Lincoln, NE, USA), by following the manufacturer’s instructions. DNA fragments were sequenced in both directions at the same time. Finally, the sequences were aligned with LI-COR software (ALIGN IR ver. 2.0). Consensus sequences were identified by comparing them with sequences deposited in GenBank (NCBI) database, by means of the BLAST algorithm. The isolates were named according to the best GenBank match if at least 97% matched at least 401 bp.
Landscape metrics (IV and VII).
Landscape mapping within the study area was performed in a GIS (ArcGis 9.1, ESRI) using colour aerial orthophotographs at the scale 1: 1500, based on photo-interpretation and field cross-validation. Land cover types were assigned to each landscape patch according to the following classification: young poplar plantations (not closed canopy), adult poplar plantations (closed canopy), riparian forests, pine forests, oak forests, hedgerows, agricultural crops and roads (Figure 8). Landscape metrics were calculated within different radius circular buffers (100, 200, 300, 400, 500 y 1000 m) to capture landscape features at different spatial scales, using Fragstat 3.3 in raster version and a cell size of 2.5 m (McGarigal et al., 2002). Within each buffer, we calculated the
following metrics characterizing both composition and configuration of the landscape: the percentage cover of the eight land cover types, distance to river, edge density (in m ha-1) and Shannon index of habitat diversity. Procedures and metrics are fully described in McGarigal et al. (2002).
18
Bird sampling(VII).
Breeding birds were sampled by the point-count method in spring 2006 (Bibby et al., 1989). Unlimited distance was used within the stand, but all birds recorded were
located within the limits of the sampled stands. All birds heard and seen were recorded and a semi-quantitative abundance index, with a score of 1 for singing male heard or pair or 0.5 for each non-singing bird heard or seen, was calculated (Norton et al., 2000).
Point counts were performed within 3 hours after sunrise and rainy days were excluded.
Vascular plant sampling (IV, VIIand VIII).
At the centre of each stand, nine 2-m × 2-m quadrants (36 square meters) were laid out in order to quantify the understory vegetation, i.e. a total of 315 quadrants were assessed. Each vascular plant was identified (field or laboratory) and its percentage cover and characteristics were collected. The conversion of floristic data into a C-S-R signature (VIII) was carried out automatically by the calculator (first part of the spreadsheet tool) developed by Hunt et al. (2004).
Statistical analyses.
Univariate analyses: Analyses of variance and Tukey’s HSD post-hoc tests (II, III, IV, V, VI, VIIand VIII), Pearson’s correlation matrices (IIIand IV), Simple linear regressions (II, IV and VII), Multiple linear regressions (III, IV and VII), Linear mixed models (V), Mann-Whitney U test (VIandVIII), Paired ttest (II) and Wilcoxon
signed rank test (IV).
19 RESULTS
The main results on each chapter are separately summarized below.
I. Sustainable forest management: an introduction and overview.
Numerous sets of C&I have been implemented in a large number of countries, nevertheless three of these processes stand out against the others, namely the ITTO, MCPFE and Montreal processes. ITTO has developed C&I for sustainable management of tropical forest, whereas C&I for boreal and temperate forests were implemented by European (MCPFE) or non-European countries (Montreal process). Although the different processes have very different origins and have developed their own criteria, there are some similarities between the three major SFM programs
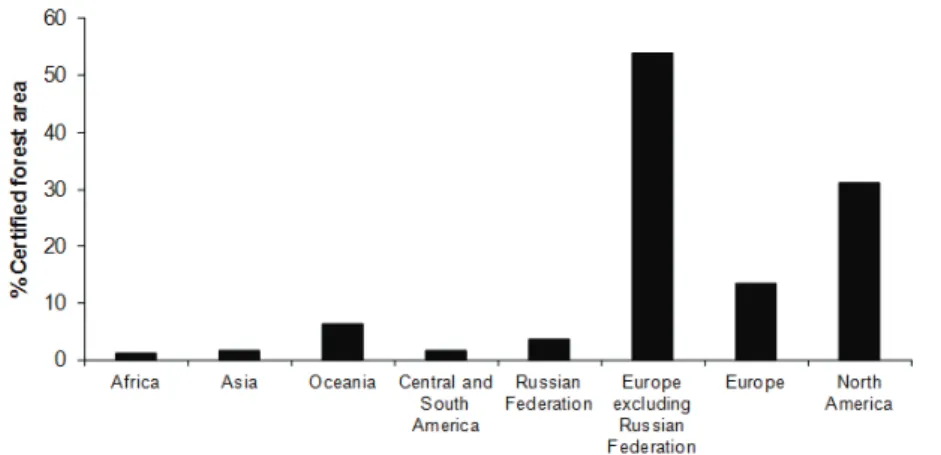
Several initiatives at international and national levels gave rise to numerous forest certification schemes, such as Forest Stewardship Council (FSC), Programme for the Endorsement of Forest Certification (PEFC, previously termed Pan European Forest Certification), the Canadian Standards Association (CSA), the Sustainable Forestry Initiative (SFI) and the Chile Forest Certification Corporation (CERTFOR), among others. Nevertheless, only two schemes (PEFC and FSC) have been used for most of the forest currently certified throughout the world. Furthermore, almost 90% of forests certified by the two major programs (FSC and PEFC) are located within Europe and North America. More than half (54%) of the forests in Europe (excluding the Russian Federation) have already been certified, and almost one third of the forest area in North America has been certified. On the contrary, only about 1.5% of the forests in Africa, Asia, and Central and South America have been certified, despite the fact that more of half of the world’s forests and almost 60% of primary world forests are located in these countries (FSC, 2011; PEFC, 2011).
II. Towards standardized crown condition assessment in poplar plantations.
20
selected across a longer gradient of visual crown transparency values, showed a good fit too (R2= 0.64, p< 0.0001).
III. Relating visual crown condition to nutritional status and site quality in
monoclonal poplar plantations (Populus x euramericana).
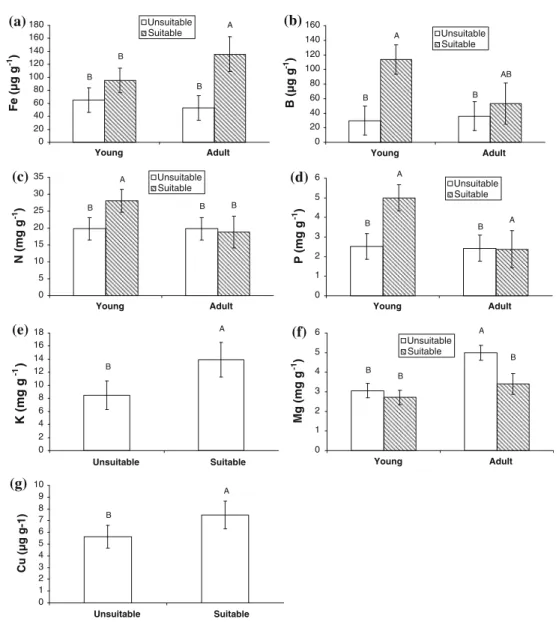
High contents of coarse fragments (> 30 %) implied low growth rates, poor conditions and deficiencies mainly in Fe and B, and to a lesser extent N, P and K. Suitable and unsuitable lands were discriminated according to soil properties or foliar nutrients. In the first model, the stands were classified correctly in 81.25 % of cases on the basis of the percentage of coarse fragments and the C/N ratio in the upper mineral soil horizon, reflecting the main soil properties that determine nutrient availability. On the other hand, the second model was able to discriminate the two groups of stands with different tree growth on the basis of the foliar concentration of Fe and B (stands were classified correctly in 96.43 % of cases). Visual crown conditions were related to growth rates and nutritional status. Models showed that about 60 % and 80 % of the variability in crown condition can be explained by age and coarse fragment content, and by age and foliar Fe concentration, respectively. Nevertheless, other variables that seem to influence crown condition, such as P, K, B, Zn or Cu, were not added in the models because multiple stepwise regressions avoid the use of correlated variables.
IV. Patterns and monitoring of Sesia apiformis infestations in poplar
plantations at different spatial scales.
The percentage of attacked trees by Sesia apiformisper stand varied from 0 % to
71 % with an average (± SE) of 25.5 ± 4.3 %. There were significantly more attacked trees in older stands, whereas in young stands the percentage of infested trees increased with the percentage cover of understory vegetation. There was no significant effect of site quality on the rate of infestation and no difference in tree height, diameter or crown conditions between attacked and un-attacked trees within each stand. A positive correlation between trap capture and percentage of attacked trees in a radius of 100 m around the pheromone trap was found. However, this regression was improved when the area of other poplar plantations within a distance of 600 m was incorporated in the model.
V. Factors influencing endophytic communities in poplar plantations.
A total of forty-three species of morphological types were isolated from 576 plant fragments (288 plant fragments for each tissue, leaves and twigs), of which the most frequent were Ulocladium spp. and Cladosporium herbarum (Pers.) Link. ex S.F.Gray.
On the other hand, Glonium spp., Pestalotia spp., Trichotecium roseum (Persoon) Link.
21
differ significantly between site qualities or between tissues, but did differ between ages (richness was higher in young stands than in adult stands). Moreover, the differences in richness between ages depend on the site quality, with the lowest richness values observed in old stands located on poor sites. At stand level, endophyte assemblages varied among stands according to site quality and, to a lesser extent, stand age. Likewise, crown discoloration, total height and several foliar concentrations (Fe, Zn and N/P ratio) were associated with endophytic communities in poplar plantations.
VI. ITS-based comparison of endophytic mycota in twigs of native Populus
nigraand cultivated P. x euramericana(cv. I-214) stands in Northern Spain.
A total of 13 species were found. Six species originated from Populus nigraonly [Stemphylium vesicarium (Wallr.) E.G. Simmons, Alternaria spp., Aureobasidium pullulans (de Bary) G. Arnaud, Fimetariella rabenhorstii (Niessl) N. Lundq., Plagiostoma fraxini (Redlin & Stack) Sogonov and Cryptodiaporthe salicella (Fr.) Petr.] and four from P. x euramericana only [Cytospora chrysosperma (Pers.: Fr.) Fr., Athelia bombacina Pers., Biscogniauxia mediterranea (De Not.) Kuntze and Unidentified sp. 1], whereas three were found on both types of trees [Lewia infectoria (Fuckel) M.E. Barr & E.G. Simmons, Alternaria alternata(Fr.) Keissl. and Epicoccum nigrum Link]. Species richness and diversity, as expressed by the Shannon index of isolates from natives poplar, were higher than those for isolates obtained from hybrid poplar, although the differences were not significant (p = 0.10 and p = 0.07,
respectively). Furthermore, richness and diversity accumulation curves predicted a low increase in number of species and diversity with increasing number of trees sampled. A CCA showed that fungal assemblages differed according to type of poplar (p < 0.01),
which explained the 17.4 % of the total variation in species.
VII. Contribution of poplar plantations to bird conservation in riparian
landscapes.
Comparison between riparian forests versus poplar plantations reflected differences in species richness, total abundance and bird assemblages. In particular, riparian forests showed higher number of species and total abundance (18.3 ± 1.45 and 39.0 ± 0.29, respectively) than poplar plantations (11.7 ± 0.67 and 22.2 ± 2.91, respectively). Moreover, whereas riparian forests were characterized by several specific bird species, such as Aegithalos caudatus, Cettia cetti, Columba palumbus, Cuculus
canorus, Garrulus glandarius, Parus major, Phylloscopus collybita, Regulus
ignicapillusand Serinus serinus, poplar plantations did not show any specific species.
22
plantations lies between 300 and 400 m and that the variable most important to explain species richness, abundance and bird assemblages was the percentage of poplar plantations in the surrounding landscape. Furthermore, our results showed that local scale was also a key factor influences for bird diversity. Indeed, understory vegetation determined bird assemblages in poplar plantations, since only poplar stands with high understory cover were associated to bird species typical of natural riparian forests, such as Cettia cetti,Aegithalos caudatus,Parus major, or Regulus ignicapillus.
VIII. The role of poplar plantations on vascular plant diversity in riparian
landscapes
Comparison between riparian forests versus poplar plantations did not reflect differences in species richness (N = 6, Z = 0.44, p = 0.66). Nevertheless, Non-metric
multidimensional scaling (NMDS) using species frequency revealed a complete turnover of vascular plant assemblages from poplar plantations to riparian forests. In the same vein, NMDS ordination test reflected a clear differentiation between riparian forests and poplar plantations according to functional diversity estimated by CSR strategy. Particularly, NMDS ordination showed that plant communities in riparian forests mainly consisted of Stress-Tolerant Competitors species (SC), whereas a clear gradient towards Ruderal species (R) was found in poplar plantations.
A total of 133 species were recorded from the thirty-two poplar plantations, of which 44 occurred in only one stand. Mean species richness in young stands was significant higher than adult stands (ca. 23 and 16, respectively), and harrowed stands showed a lower species richness than non harrowed stands (ca. 13 and 26, respectively). IndVal analysis detected 25 indicator species at several levels of the typology, but no indicator species were found in harrowed stands. On the other hand, NMDS ordination and MRPP tests reflected a differentiation in the CSR strategies in poplar plantation according to age (A = 0.06, p= 0.02) and site quality (A = 0.03, p= 0.04). Furthermore,
NMDS retained two significant environmental variables (number of harrowings [p =
0.04] and percentage of coarse fragments [p = 0.04]). While, the latter was associated
23 DISCUSSION
Current and future challenges of sustainable forest management and forest certification.
Although utility of indicators is still controversial and several weakness have been pointed out (Bradbury, 1996; Michalos, 1997; Bass, 2001), there is general agreement that the advantages of the approach outweigh these limitations and that researchers should focus their efforts on testing the current indicators and searching for new indicators. Even more so in the current changing environment when the sustainability concept and indicators must be revised to reflect the new reality generated by climate change. Among other initiatives, the FORSEE project was carried out in order to shed light on usefulness of the proposed indicators and develop new indicators in the Atlantic regions of Europe (Tome & Farrell, 2009).
There are two key challenges involved in improving the C&I system, a harmonization of the sets of C&I and the use of a suitable scale of each indicator. Thus, advances in harmonization will minimise costs (avoiding duplication and preventing overlap), facilitate comparisons between countries and, overall, improve the credibility of SFM. Likewise, the use of a suitable scale would avoid additional charges as a result of correlations of several different scales and facilitate the interpretation of each indicator. On the other hand, the scientific community must search for new indicators. Gaps in knowledge have been identified, and as these mainly involve ecological aspects, researchers should go further in investigating the relationships between type of forest management and ecological and socioeconomic functions.
Forest certification has became very popular, mainly because it is regarded it as a tool whereby everyone should benefit (win-win goal). This situation would be based on an economic balance, where forest owners and the forest industry place sustainable products on the market in the hope that consumers will be willing to pay the extra cost implied by SFM. Nevertheless, forest certification is still far from reaching its initial goal (win-win), since the expected price increases have not occurred (Cubbage et al.,
2010; Gafo et al., 2011). In practice, only consumers and the forest industry have
benefited; consumers use certified forest products with a clear conscience, and the forest industry has ensured market access without any great extra cost because this has mainly been assumed by forest owners.
24
must be made to achieve forest certification, while primary forests have largely been ignored. The fact that foresters are able to place certified products from productive forests on the market, with a small additional charge compared to the extra charge involved in certifying products from primary forests hinders certification of the latter, which are actually the most endangered forests. Moreover, this disadvantage may favour unsustainable management, such as illegal logging or in extreme cases conversion of forest land to agricultural land, to favour market competitiveness.
The viability of tropical forest certification will depend on forest owners obtaining premium prices that at least cover the certification costs, taking into account that these costs vary according to the type of forest (primary forest, plantations, etc.) and that consumers’ willingness to pay premium prices will also differ. It should be possible for consumers to distinguish the origin of each product, and in other words different labels are required. Nevertheless, the use of different eco-labels is controversial, since many labels may confuse rather than help consumers (Teisl et al., 2002). On the other hand,
with an absence of standardization and a powerful information campaign, most environmentally concerned consumers will probably demand wood from sustainably managed forests, without taking into account the type of certification label, and will choose the least expensive product (Teisl et al., 2002). This may entail a new associated
problem, since producers and industries will probably also choose the bodies that certify forests most readily and at the lowest cost. This may lead to a situation where the certification schemes would tend to compete with each other and standards would be reduced to attract producers, as pointed out by Van Dam (2001).
Indicators of forest health in poplar plantations.
The health of forests is determined by numerous abiotic and biotic stressors, which vary according to type of forest and region, making it more difficult to assess (Ferretti, 2004). Researchers initially focused on crown condition as a good indicator of forest health, based on the theory that impact in forest caused by natural or antropogenic stresses would be observed in the tree crowns (Zarnoch et al., 2004). Nevertheless,
although the usefulness of crown conditions as indicator of forest health is beyond doubt, several limitations have been found, such as a lack of objectivity in the assessment or the difficulty of identifying its relationship with stresses factors.
Different shapes and sizes of sampled plot have been proposed for forest health surveys, like four subplots of six trees located 25 m from a fixed point by the ICP-Forest in Europe (Eichhorn et al., 2006), four subplots spaced 36.6 m apart with a fixed
radius by the Forest Health Monitoring in the U.S. (Zarnoch et al., 2004) and one
25
sufficient to assess crown condition in monoclonal poplar plantation. The discrepancy with the results obtained by Innes and Boswell (1990) in even-aged stands of conifers, who demonstrated significant variations amongst the 4 subplots of each plot, may be due to the higher homogeneity of trees within monoclonal plantations. On the other hand, an objective assessment of crown transparency in poplar plantations may be available if CROCO software is used and our models are implemented.
Our outcomes support the influence of abiotic stressors on forest health. Thus,
nutrient status showed an influential pattern on growth and crown condition (III). In
particular, a coarse fragments content higher than 30 % was associated with unsuitable stands and poor crown condition, possibly due to the small volume of soil available for the development of roots, the lower amount of available nutrients per unit of soil volume or a lower soil water-holding capacity. Likewise, the soil C/N ratio appears to be a limiting factor only in young plantations, which may due to an increase in soil N with age of the stand as a result of the return of some nutrients in soils through litterfall (Das & Chaturvedi, 2005) or enhancement of N mineralization because of a
well-developed root system (Browaldh, 1997). Moreover, although several foliar nutrients,
such as N, P, K, Fe and B, seem to affect tree growth and crown conditions in these poplar plantations, Fe and B appear to be the most limiting elements (III). These deficiencies seem to be associated with high contents of coarse fragments, which would imply lower availability of these nutrients as well as a lower moisture-holding capacity in superficial soil horizons, since moisture is required for uptake of the nutrients. On the other hand, the suitability of lands could be predicted (with low cost and high probability of success) using the classification functions developed (III) from soil properties to ensure that new plantations will be established on suitable land.
Our results also demonstrated that forest health in poplar plantations are related to biotic factors. In this vein, the study (IV) displayed that poplar plantations of
P. x euramericana can sustain high infestation rates of S. apiformis, up to 71 % of
attacked trees per stand. This is consistent with other studies that found
P. x euramericana to be more susceptible to S. apiformisthan other poplar species such
as P. nigra, P. trichocarpa and P. alba (Arundell & Straw, 2001; Straw et al., 2007).
Our outcomes also showed that understory management may be used as a tool for the control of the Sesia populations. The fact that Sesia attacks were positively related to
the percentage cover of understory vegetation in young plantations, may be due to vegetation would provide eggs and egg-laying females with more protection against adverse weather condition (de Tillesse et al., 2007) and predation (Coleman & Boyle,
2000). Both key aspects in young trees in which the eggs would be laid unprotected by bark cracks.
26
monitoring system based on a single trap could provide reliable information to estimate
S. apiformis attacks in poplar plantations (IV), whereas a minimum of three traps were
necessary to properly estimate pine processionary moth (Thaumetopoea pityocampa)
populations in maritime pine plantations (Jactel et al., 2006). This discrepancy is likely
to originate from differences of stand homogeneity, as poplar plantations are based on monoclonal stands with regular spacing of trees. Furthermore, our outcomes support the hypothesis that the active radius of attraction by pheromone traps, baited with
S. apiformissex pheromone at a release rate of 0.22 µg/h, is about 100 m. Nevertheless,
managers should take into account the fact that S. apiformis male moths could fly
around 600 m and should therefore be considered when interpreting pheromone trap captures. Thus, our model could be implemented to correct the effect of surrounding poplars, and then pheromone trapping would offer a reliable monitoring tool for hornet clearwing moth population which can be easily applied on a larger scale than the usual sampling method based on exit hole counts.
Although many authors have recognized the importance of endophytic communities in forest health (Bettucci & Alonso 1997; Bettucci et al., 1999; Gennaro et al., 2003; Ragazzi et al., 2003; Santamaría & Diez, 2005; Zamora et al., 2008; Botella et al., 2010, 2011), it has not yet been studied in poplar plantations. Our study (V)
displayed that several variables related to forest health (discoloration, total height and the concentration of several nutrients) determined the fungal communities in poplar plantations. In particular, fungal assemblages differed mainly according to site quality of the stands, which seems be due to a stress factor caused by nutrient deficits in poor site qualities. Thus, deficiencies in Fe, which is one of the most nutrient limiting in these poplar plantations (III), appears determine directly to discolorations and low growths, and indirectly endophyte communities. Furthermore, it is well known that some endophyte species, such as Periconiellaspp. (Collado et al., 1999) and Cytospora
spp. (Bettucci & Alonso, 1997; Callan, 1998), require trees to be exposed to stress conditions before colonization. On the other hand, it should also be underlined that human factors could determine forest health in poplar plantations. Thus, the occurrence of weak pathogens, such as C. chrysosperma, on only hybrid poplars (VI) may be
explained by the origin of the hybrid poplar seedlings. The hybrid poplars in each sampled stand probably originated from cuttings of a single ortet, which may have been infested by the pathogen and it is therefore possible that all cuttings used in the plantation already carried this fungus as a latent infection.
27
dramatic phytosanitary problems have been displayed in poplar plantations so far, a diversification of clones at least at landscape level and a verification of the provenance of the seedlings used for plantation and its phytosanitary status would be desirable to avoid future phytosanitary problems.
Indicators of biodiversity in poplar plantations.
As already noted, effect of planted forests on biodiversity is still a controversial topic. It is even more noteworthy in Mediterranean riparian zones, where the interface between terrestrial and aquatic environments plays a key role on biodiversity (Schnitzler, 1994). Hence, it is essential to investigate the role of poplar plantations on biodiversity in riparian zones and to estimate the ecological implications of a substantial increase in the cover of poplar plantations.
Our outcomes (VI, VIIand VIII) displayed that poplar plantations should not be used as surrogates of native riparian forests from the point of view of biodiversity and native riparian forests should therefore be preserved and increased as far as possible. In particular, the community structure of twig endophytes of the native P. nigra and the
hybrid P. x euramericana (cv. I-214) differed greatly (VI), which is noteworthy as
clone I-214 is a 50 % descendant of P. nigra. In previous studies, distinct differences
between endophytic communities were found on comparison of different tree species (Fisher & Petrini, 1990). Nevertheless, taking into account the fact that
P. x euramericana can be considered as a partly exotic species (the other parent species P. deltoides originates from North America), may therefore carry resistance factors
(genes), which would be new to the fungal flora in Spain. Moreover, the hybrid poplar is known to grow considerably faster than the native poplar, which is the main reason for its popularity among foresters. The speed of growth may affect the mycobiota associated with the tree, as shown by Korkama et al. (2006) in studies on the
mycorrhizal diversity of various spruce clones. Similarly, bird (VII) and vascular plant (VIII) assemblages also differed between riparian forest and poplar plantation. While poplar plantations hosted mainly generalist bird species, riparian forests were associated with specific bird species typical of well preserved riparian forest areas with a dense and unmanaged understory. In turn, most of the indicator vascular plant species found only in natural forests have been previously identified as species with high requirements in shade and/or edaphic moisture, even temporal flooding in some cases, which is typical of riparian zones.