Is
EU
fi
nancial
support
enhancing
the
economic
performance
of
PPP
projects?
An
empirical
analysis
on
the
case
of
spanish
road
infrastructure
Laura
Garrido,
Juan
Gomez,
María
de
los
Ángeles
Baeza,
José
Manuel
Vassallo
Keywords:
Public-Private Partnerships Europeanfinancial instruments Multiple regression model Economic performance Profitability Spain
A B S T R A C T
During the last few decades, the European Union has been promoting the use of PPPs in order to accelerate the development of the TEN-T for ensuring economic, social and territorial cohesion and increasing accessibility within the EU. To that end, several mechanisms have been put at the disposal of the Member States to enhance transport infrastructure of interest for the EU. This paper conducts a review of the main funding programs implemented by the EU authorities in order to evaluate to what extent the European support has been rightly channelled to PPP projects. To that end, a multiple regression model has been applied to road PPP projects in Spain to analyse whether those PPP projects with EUfinancial backing ultimately have a higher economic performance compared to those projects not receiving such a support. The research concludes that there is a positive correlation between receiving Europeanfinancial support and the good economic performance of those projects.
1. Introduction
It was not until the Treaty of Maastricht in 1992 when the foundations of a common transport infrastructure policy along with itsfinancial instruments were passed to boost the development of the Trans-European Networks for transport (TEN-T). Since then, there has been a clear policy from the European Commission to support public-private partnerships as a means to promote infrastructure projects within the TEN-T network (European Commission, 2008) and increase the level of privatefinancing in public infrastructure projects, especially in the transport sector.
This position has been reflected through a variety of actions, such as the reform of the procurement rules; the progressive removal of technical (European Commission, 2003), legal (Commission of the European Communities, 2004), administrative and accounting barriers (EUROSTAT, 2004); and the evolution of Europeanfinancial resources available for the development of PPP projects, including a series of innovative financial instruments (Zaharioaie, 2012). These measures are expected to have influenced both the number of PPPs developed in recent years and their performance, which deserves to be analysed.
Spain is one of the European countries with the greatest tradition in the use of private financing for the promotion of infrastructure, especially in thefield of transport. PPPs have been mostly implemented in the road sector, but nowadays the model is being used also for any
kind of infrastructure by both the national and the regional govern-ments. As a consequence, Spain is currently one of the EU countries with the highest volume and number of PPP projects in operation (Inderst, 2013), what makes it an interesting case to explore the influence of EU support on PPP economic performance.
The aim of this paper is twofold. On the one hand, we aim at determining the volume of the EUfinancial support to transport PPP projects in Spain compared to otherfinancial sources. On the other hand, we explore whether the EUfinancial support provided by either the European Union or the European Investment Bank —which is associated to a stricter fulfilment of procurement, economic, social, and environmental requirements— has influenced the economic perfor-mance of these projects. At this point, we make the hypothesis that, ceteris paribus, EU support —both financial and non-financial— improves the quality and soundness of the projects and, consequently, their economic performance during the operation phase. As far as the authors are concerned, it is among thefirst empirical analyses to deal with this research topic.
The paper is structured as follows. After this introductory chapter, Section 2develops a review of the main Europeanfinancing instru-ments currently available for PPP projects and analyses to what extent the projects under that scheme have benefited from the mechanisms under review.Section 3displays a review of the success factors and the criteria commonly used in PPP project performance evaluation.Section
4outlines the methodology of this research. Section 5presents and discusses the main results. Finally, Section 6 sets out the main conclusions and points out further research.
2. Review of the EUfinancial instruments supporting PPP projects and its implementation in Spain
This section reviews the main EUfinancial instruments currently available for PPP projects to get funding and the extent to which the projects under that scheme have benefited from them.
2.1. EU structural funds and the TEN-T budget line
Grants from European Regional Development Fund (ERDF) and Cohesion Fund (CF) support the European poorest regions with the aim of narrowing their development gap in order to achieve a higher economic and social cohesion among the EU. They account for the largest amount of funding potentially available to PPPs, and may adopt two forms in PPP transport projects: a defined percentage of the construction cost of shadow toll and availability payment projects or a variable grant to cover the funding gap of real toll ones. That is, an economically viable project that is unable to meet its total costs from user fees, can benefit from a maximum subsidy equal to the value that is sufficient to make the project financially viable ("funding gap") (EPEC, 2011).
Spain has been the largest beneficiary of both Structural and Cohesion Funds until the enlargement of the EU in 2004. More than 60% of these resources were allocated to transport infrastructure projects (Dall’Erba, 2003). However, only two of the major projects supported up to date by the ERDF and the CF, were PPPs: the AP-53 (Santiago-Alto de Santo Domingo) toll road in Galicia and the Almanzora (Purchena-AP-7) shadow toll highway in the region of Andalusia. These projects represent only 1.6% of the ERDF budget allocated to Spain from 2000 to 2013.
Regarding the TEN-T line and its successor the Connecting Europe Facility, the majority of grants are offered to support studies or works that contribute to the TEN-T programme priorities. Unlike the ERDF and the CF, every Member State, regardless of their level of develop-ment, is eligible to receiving financing from the TEN-T programme. TEN-T funding opportunities are also explicitly open to public private partnerships (PPPs). However, both its co-funding rates and budget allocation are much more constrained than the ERDF or the CF ones.
Despite the fact that TEN-T funding allows for grant disbursement to private partners and both its rules and application process are favourable for PPPs (EPEC, 2011), only two PPP projects have benefited from this grant in Spain, both in the 2007–2014 period: the high speed rail line Perpignan-Figueras, connecting France and Spain; and the new highway A-66 from Benavente to Zamora, accounting for just 9.8% of the whole budget in this period.
2.2. EIB co-financing
One of the largest EU sources to promote PPP projects for transport infrastructure throughout Europe, particularly the TEN-T networks, is the European Investment Bank (EIB). The EIB is a EU's long term lending, not-for-profit institution owned by the Member States that supports projects of European interest (European Investment Bank, 2015a). All projects financed by the EIB must be in line with the objectives of the European policy and be viable from an economic,
financial and technical point of view, meet strict environmental and social standards and be tendered according to the EU procurement rules (European Investment Bank, 2004).
The EIB has a positive influence on the stability and added value of the PPP projects it co-finances (European Investment Bank, 2004). It has developed flexible financing structures for PPPs and adapts the
financial system to the needs of each project. This fact, in combination with the lower cost of EIB funds, strengthens the economics of the projects and improves the affordability of the investment for both the public sector and the potential private lenders. Moreover, economic quality is ensured by the EIB's high standard of due diligence, which comprises the project appraisal and selection, as well as its close cooperation with the promoters in the whole life cycle of the project.
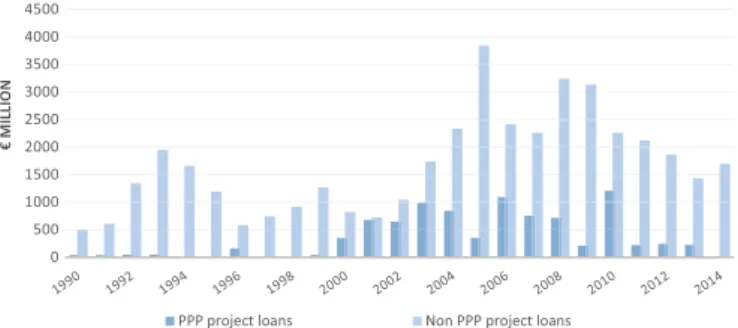
Fig. 1 shows the volume of loans granted by the EIB to both conventional procurement and PPP projects in Spain. Although a greater amount of loans allocated to PPP projects can be noted ever since 2000, this amount has never surpassed the amount allocated to conventional projects. Moreover, in the last few years, with the sole exception of 2010, the loans to PPPs have been dwindling. This has been caused by a huge decline of the PPP market.
Fig. 2displays the relative involvement of the EIB infinancing PPPs in Spain by showing the share provided by EIB loans tofinance PPPs. Thisfigure shows that the share of the EIB infinancing PPPs in Spain has been relevant, especially in the last few years.
2.3. EU Innovative Instruments
More recently, the Commission has set up a number of instruments aiming at supporting the provision of important transport infrastruc-ture and addressing thefinancing gap that most PPP projects have to meet. The beneficiaries of these instruments are PPP projects facing difficulties in becoming bankable for several reasons. In the last few years, the EU has promoted innovative instruments aimed at covering some of the project risks associated to PPP projects, whilst others try to supply the lack of sufficientfinancing for large infrastructure projects under PPP schemes.
The most important ones are the Loan Guarantee Instrument for Trans-European Transport Network Projects (LGTT), designed to encourage and promote private-sector involvement in the financing of the TENT projects by covering traffic revenue shortfalls during the initial operating period (ramp-up); the EU Project Bonds Initiative, aimed at enhancing the credit quality of project bonds issued by private companies in order to make them more attractive to investors; and the
0 500 1000 1500 2000 2500 3000 3500 4000 4500
€
MILLION
PPP project loans Non PPP project loans
Fig. 1.Comparison of the volume of loans granted by the EIB to PPP projects and non PPP projects in Spain in the period 1990–2014. Source:European Investment Bank (2015b).
0 2000 4000 6000 8000 10000
2003 2004 2005 2006 2007 2008 2009 2010 2011 2012 2013 2014 € MILLION
EIB loans to PPP projects Other financial sources to PPP projects
Marguerite Fund (MF), a pan-European infrastructure equity fund established to act as a catalyst in the development of infrastructure in the transport and energy sectors.
Their scope has been quite modest in Europe in general and particularly in Spain. Only the LGTT and the Marguerite Fund have contributed to finance transport PPP projects in Spain. One of the seven projects signed by the LGTT is the C25-Eix Transversal, located in the region of Catalonia, in Spain. On the other hand, in 2012 the Marguerite Fund made its first investment in the transport sector acquiring a 45% stake inAutovía del Arlanzón, a brownfield TEN-T project in Spain.
3. Performance evaluation and success factors in PPP
One of the main goals of this paper is to evaluate whether the involvement of the EU in PPP projects is actually contributing to improve the economic performance of these projects. To that end it is necessary to know both the performance measures used in PPPs and the success factors that, apart from the EU support, may contribute to the good performance of PPP projects.
3.1. Criteria for measuring performance of PPP projects
Traditionally, the criteria for measuring the performance of con-ventional projects have been based on the so-called“Iron Triangle”of cost, time, and quality (Ratnasabapathy and Rameezdeen, 2006). However, these historic criteria have been also considered too simplis-tic, since they ignore important outcomes such as profitability, technical performance, functionality or financial and social issues (Cooke-Davis, 2002; Shenhar et al., 2001). This is even more striking given the complexity of PPP arrangements, in which different interests of several stakeholders are involved (Farinde and Sillars, 2012).
Up to date, few authors have identified different means of measur-ing project performance in public private partnerships. Some of them assess performance measures (Chan et al., 2002;Ratnasabapathy et al., 2006;Songer and Molenaar, 1997;Songer et al., 1996); some others define key performance indicators (Mladenovic et al., 2011; Yuan et al., 2009); and there are some who consider both to evaluate the performance of a PPP project (Liyanage and Villalba-Romero, 2015).
3.2. Project Success factors
The performance of a project will be directly affected by a set of circumstances, facts or influences which contribute to its outputs but do not form the assessment basis (Lim and Mohamed, 1999). Since the evolution of PPPs, several researchers have recurred to project success factors (PSFs) to improve the understanding and best ways of implementing PPP policy for infrastructure development (Liu et al., 2015).
Since the PSFs identified over time are extremely extensive, several authors have applied Factor Analysis in order to reduce and regroup the individual factors list into a relatively smaller and more critical one, by considering the scores collected from questionnaires (Chan et al., 2010; Hardcastle et al., 2005; Zhang, 2005).Zhang (2005)identified 5 Critical Success Factors (CSFs) for Public-Private Partnerships and calculated their significance indexes based on the 42 worldwide PPP expert responses to a questionnaire survey. The rank of thefive main CSFs were: 1) Economic viability, 2) Appropriate risk allocation via reliable contractual arrangements, 3) Sound financial package, 4) Favourable investment environment, and 5) Reliable concessionaire consortium with strong technical strength. Moreover,Hardcastle et al. (2005) based the analysis on a questionnaire survey administrated among UK organisations with involvement in PFI projects. The rank obtained was instead 1) Effective procurement, 2) Project implement-ability, 3) Government guarantee, 4) Favourable economic conditions, and 5) Availablefinancial market.
3.3. Linkage between project performance and project success factors
Most of the previous contributions have hitherto been conducted on project performance criteria and project success factors identification, but very few research works have focused on investigating the linkage between them (Gunathilaka et al., 2013).Jha and Iyer (2006)used a Multinomial Logistic Regression Model to assess the contribution of 20 success and failure factors on performance, based on the question-naires responses of Indian construction industry professionals. Lam et al. (2008) developed a Multiple Regression Analysis to study the relationships between the project performance and the success factors for D & B projects. Finally,Tabish and Jha (2012)tested the hypothe-sized relationship between success factors and project performance by using a total of five statistical parameters. They found that success factors have a significant positive influence on project performance and quantified their relative importance. Unfortunately these studies provide little information about PPPs.
4. Hypothesis and methodology
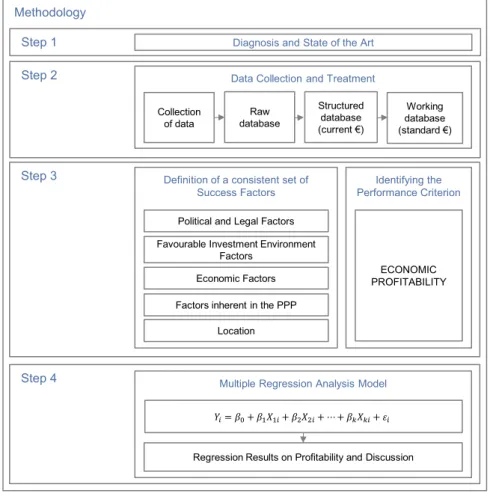
This research is aimed at analysing to what extent EUfinancial backing has a positive influence on the economic performance of PPP projects applied to the case study of roads in Spain. To that end, an econometric model has been designed, whose main steps are shown in Fig. 3. The case study comprises all road PPP projects carried out from 1995 to 2009 in Spain. This country can be considered an interesting case in the international context for a number of reasons: the existence of a large number of road PPP projects, the Spanish long tradition and extensive experience in developing PPPs, and the fact that it is among the countries in Europe having received the largest amount of EU
financial support. Moreover, Spain has implemented a variety of projects, what is interesting to study as project performance often varies across type of project, type of contract and project character-istics, among other factors (Liyanage and Villalba-Romero, 2015; Müller and Turner, 2007).
4.1. Hypothesis of this research
All PPPs in Spain were awarded in a competitive way so the bidder who ultimately won the tender and ended up being the sponsor of the project estimated a rate of return according to the cost of capital of the project. The cost of capital of road PPP projects in Spain may be considered similar for different projects of the sample though there might be slight differences regarding risk perception —more risky projects are expected to need higher profitability levels. This implies that all projects are promising for investors when they are granted no matter whether the EU supported the project or not. No bank—either the EIB or any commercial bank—would invest in a PPP project that does not foresee certain profitability.
The hypothesis behind this paper assumes that EU support should, ceteris paribus, achieve better economic performance of PPP contracts once the project is in the operational phase. This assumption is based on the fact that EU participation ensures the implementation of EU procurement rules, improves the design of the contracts, and promotes a better risk allocation. There are several main requirements that have to be met by the project in order to receive EU support: project technical,financial, economic and environmental feasibility must be ensured. Projects supported by the EU must contribute to EU objectives and have to be tendered in accordance with EU procurement rules ensuring publicity and real competition. The EU is expected to add value to the projects supported in terms offinancing, technical assistance, PPP structuring, contract negotiations, appropriate risk sharing, etc., and this is expected to improve their quality and soundness in the operational phase, which in turn may contribute towards better economic performance.
should be considered: (i) projects were not generally in need of
financial support: Spain experienced a period of economic prosperity during the 1990–2007 cycle that boosted the development of the
financial markets; the low interest rates and the high liquidity available at that time helped banks to get more debt out of the market, being relatively easy for the projects to reachfinancial close; (ii) it is very complex to blend PPP projects and EU funds, especially when it comes to Structural Funds (ERDF or CF): the inflexibility of the grant application, the funding gap analysis, the difficulty in timing the grant application and the PPP procurement, etc., tend to discourage PPP projects from applying for this funds not only in Spain, but in the EU in general; (iii) the EU has a limited budget and, consequently, all projects cannot be funded even though the EU requirements are met; and (iv) every project to befinanced must contribute to meeting one or more of the EU policy objectives: unless a project complies with this require-ment it will not be eligible for funding regardless of its soundness and high quality. Therefore, a project not receiving EU funding does not necessarily mean that the project has not enough global quality.
4.2. Data collection and treatment
In order to accomplish the objectives of the research, an intensive data collection from multiple sources was carried out. The sample used in the statistical analysis includes all the Spanish PPP projects whose contracts were awarded between 1995 and 2009. Other toll motorways already in operation in Spain have not been considered in the sample because they were awarded many decades ago (late 1960s and the beginning of the 1970s), corresponding to a far different scenario for several reasons: (i) there was no legislation on PPPs at the time, so they were awarded through different and specific legislation passed by the Government on a case-by-case basis; (ii) Spain was not part of the EU until 1986, therefore no EU support mechanism was available at that
time; (iii) macroeconomic conditions were not comparable; and (iv) the available annual accounts only show data since 1992 regardless of the project awarding date.
Regarding the compilation of data concerning tolled motorways, the Spanish Ministry of Transport (Ministerio de Fomento, 2013) pub-lishes annual reports providing data related to the motorways managed by both the national and regional governments. With regard to shadow toll motorways,Vassallo and Pérez de Villar (2010)already conducted a detailed compilation of the projects awarded in Spain at the time, which served as a starting point. The resulting PPP projects included in our database are illustrated inFig. 4.
The second phase of the data collection involved an in-depth analysis of the European and Spanish working papers to know which projects actually received EU support. This information allowed us to complete the PPP project database with the type of Europeanfinancial support received by each project: grant, EIB loan, guarantee or innovative financial instruments, as can be seen in Table 1 (Directorate General for EU Funds, 2014).
For economic andfinancial indicators of the PPP projects’ perfor-mance, we obtained the unconsolidated annual accounts of every concessionaire constituted after 1995 from the SABI database. In addition, we collected GDP data at the provincial level from the Spanish Statistical Office (Instituto Nacional de Estadística, 2014) to control for the evolution of the economy. We used the GDP deflator to convert the currency values to constant euros. This information was obtained from the Bank of Spain.
4.3. Identifying the indicator for measuring performance (IMP)
Establishing a proper indicator for measuring economic perfor-mance of PPPs revealed to be one of the most important decisions in the methodological approach. Although there are many IMPs in the
Methodology
Step 3 Definition of a consistent set of
Success Factors
Step 1
Step 2
Favourable Investment Environment Factors
Diagnosis and State of the Art
Political and Legal Factors
Economic Factors
Data Collection and Treatment
Identifying the Performance Criterion
ECONOMIC PROFITABILITY
Factors inherent in the PPP
Step 4 Multiple Regression Analysis Model
Regression Results on Profitability and Discussion Collection
of data
Raw database
Working database (standard €) Structured
database (current €)
Location
literature to take into consideration, the primary screening was considering the necessity for the criteria to be objective, measurable and available in a database for as many projects as possible.
Particularly we selected the economic profitability (EP) measured as the ratio between the gross annual profit and the assets included in the balance sheet of each PPP company. Profitability is a proper measure of the economic performance of the project and, in a context of increasing competition, concessionaires are aware that the project must be properly managed to be profitable (Parfitt and Sanvido, 1993). Furthermore, profitability is considered a critical criterion for a project to be successful by Project Managers (Menches and Hanna, 2006) and the most important one for public sector clients (Kušljićand Marenjak, 2013).
Additionally, this variable was widely used before for the same purpose in the literature, such as inHorta et al. (2012)orKangari et al. (1992). Profitability is measured in the post-construction phase, when thefinal account is settled and thefinancial result can be assured (Chan et al., 2002). Particularly in PPP projects, it constitutes a relevant criterion given the clear incentive to hasten the construction phase so as to accelerate the rate of return. Moreover, as a performance measurement, profitability can be taken as a key indicator of the evolution of the project over time, acting as a tool for continuous improvements (Takim and Akintoye, 2002).
The economic profitability (EP) that we use as the dependent
variable in our model measures the gross profit of the concessionaire before taxes and interests (Horta et al., 2012). It was calculated for every project using the Gross Profit (GP = concessionaire revenue– nonfinancial costs) and the Total Assets (TA = allfinancial resources) as a measure of the resources used. This indicator is not affected by the differentfinancial structure (equity vs. debt) of the project database.
To account for the economic profitability in the modelling approach we considered the 5th year of operation for each project to avoid the ramp-up period, when traffic demand is not consolidated yet. This period is characterized by greater inter-annual instability of road demand levels and consequently of its economic profitability, poten-tially showing a non-representative picture of the project performance in the medium- and long-term. Although the ramp-up period may vary from immediate to beyondfive years (Bain and Wilkins, 2002), the most considered ramp-up duration among the researchers ranges from three tofive years (Baeza and Vassallo, 2008; Pašićet al., 2014).
Within the sample, both cases of economic success and failure can be found regarding EU supported and non-EU supported projects. The mean of the economic profitability variable for the EU supported projects is 0.019, compared to a 0.012 for non-EU supported ones. The model will state whether there is a statistically significant difference between both groups of projects.
4.4. Definition of the success factors
An exhaustive review of the current literature in order to identify the most appropriate success factors was conducted. Although a higher number of success factors were considered in a first round, the difficulties encountered in terms of collecting data made it impossible to include some of them in the present research. For thefinal selection we took into account the following factors:
(1) Political and legal factors, comprising stability of the political Fig. 4.Current situation of PPP road infrastructure in Spain.
Table 1
Share of financed PPP projects in the sample.
Financed Projects Non Financed Projects Total
EIB EIB + MF EIB + LGTT ERDF
environment in the country, experience of governments in PPP schemes, transparency of the procurement system, or the existence of a mature and adequate regulatory framework, among others, were not finally included in the statistical analysis. The reason behind that decision is that all the projects in the sample are located in Spain and, consequently, are subjected to the same regulatory context.
(2) Regarding the experience of government in PPP schemes, most of the PPP projects were promoted by the Spanish national govern-ment, which has an extensive experience in arranging this type of contract. Unfortunately, we were not able to differentiate in the analysis the national governments from the regional governments because, as most of the regional governments have developed shadow-toll PPPs, there are multicollinearity problems between the type of PPP and the governmental level managing the contract. (3) With regard to the reliability of PPP consortiums, this factor was not explicitly included in the analysis since all the PPPs were awarded to Spanish infrastructure operators with a large experi-ence in PPPs and a technical strength endorsed worldwide (Chislett, 2014).
(4) Favourable investment environment factors, such as stability of the economic environment in the country or the existence of service needed, were introduced through the evolution of GDP. As we try to explain the gross economic profitability in the 5th year, we calculated the 5-year GDP variation for each PPP road. GDP data was collected at the provincial level with the aim of better under-standing the influence of local socioeconomic characteristics on the projects economic performance. In this respect, each road was assigned the total GDP of the provinces it crosses, in contrast to adopting an average national GDP evolution for the whole road network analysed. Particularly, we considered its variation in the
first 5-year period since the project was awarded. As traffic demand is elastic with respect to the level of economic activity (Gomez et al., 2015; Matas et al., 2012), the GDP variable will also capture the effect of the evolution of traffic.
(5) The construction cost of the project was also included in the model as a control variable for the size of the project.
(6) Four dummy variables were considered in order to capture additional effects regarding the type of PPP and the type of project (seeTable 4below). Firstly, the type of PPP variable distinguished between explicit toll, shadow toll and availability payment, taking thefirst one as the reference case in the model. Secondly, the type of project distinguished between greenfield, brownfield or widen-ing of a conventional existwiden-ing road, bewiden-ing again thefirst category the reference case in the model.
(7) A categorical variable differentiating urban and interurban road PPPs has been introduced in the model. Demand elasticities in short-distance trips, more attuned to urban motorways, signifi -cantly differ from long-distance movements, typically of interurban travel. It seems that changes in generalized transport costs—toll, fuel, etc.— tend to discourage long-distance trips to a greater extent than the shorter ones (Gomez et al., 2015). This may lead to a difference in terms of traffic demand evolution between urban and interurban motorways that might have an impact on the economic profitability of the projects.
(8) Finally we included a categorical variable indicating whether the project has been supported by the EU or not, of greater interest for this research.
4.5. Selection of the econometric model
Several econometric models were initially considered in order to analyse the influence that EU support has on PPP project performance. Panel data techniques and time series analysis were discarded because of the great disparity between PPP concessions with regard to the year they were awarded, which resulted in highly unbalanced data samples.
The techniquefinally adopted was the standard Multiple Regression Analysis, which allowed us to avoid the inconvenient already men-tioned and has been already used by previous research analysis with a similar purpose (Lam et al., 2008).
The multiple regression technique is a statistical specification widely used to analyse the functional relationship between several independent variables and a single dependent or criterion variable, in order to explain the variation in the dependent variable as a result of changes in the explanatory or independent factors.
Hence, multiple linear regression analysis was employed to model the relationships between the economic profitability (dependent vari-able) and a set of success factors (independent variables) for PPP projects in Spain (see Table 2). The regression equation can be expressed as follows:
Yi= β0 + β X1 1i + β X2 2i + … + β Xk ki + εi; i= 1, … , N (1) where β0 represents the intercept while β1,β2, …,βk are regression coefficients which denote the estimated change in the dependent variable Y for a unit change of the independent variablesX1,X2,…,Xk.
The prediction error (εi) or the residual, is the difference between the
actual and predicted values of the dependent variable. The results of the regression will be presented and discussed inSection 6. Once the model is developed, the adjusted coefficient of determination (adjusted R2) is calculated to reflect the goodness offit thereof.
The model evaluates the economic performance of each project in the fifth year of operation. Therefore there is one observation per project, in contrast to one observation per year, as in time series analyses. As a consequence, the sample is relatively limited from a statistical point of view regarding some aspects:
1. Local fixed effects are only considered to a certain extent: the scarcity of sample makes it necessary to consider a trade between the number of variables and the degrees of freedom. The GDP variable is evaluated at the provincial level, capturing the local socioeconomic characteristics of the different areas where the projects are located. Moreover, a differentiation has been made regarding the location of the projects with respect to their urban/ interurban context to take into account its influence in the projects’ performance. Other potential variables related to local effects were initially considered, such as the location of road sections in coastal or interior roads. However, given the small sample size they were not
finally included in the model as resulted to be non-statistically significant.
2. Likewise, there are not enough projects to make an analysis disaggregated by region; therefore, it is not possible to evaluate the regional governments’experience, either in comparison with the Spanish national government or among the different regions. Table 2
Definition of the variables included in the model.
INDICATORS VARIABLES TYPE
Economic performance PPP's economic profitability in the 5th year of operation
Continuous
EP=GrossProfit TotalAssets Favourable investment
environment factor
GDP variation in the first 5-year period since the project was awarded
Continuous
Economic factors Construction cost of the project Continuous
EU support Categorical
Factors that are inherent in the PPP
Type of PPP Categorical
Type of project
Location Differentiates between urban and interurban PPP projects
4.6. Univariate analysis
Before calibrating the model, the data collected have been subjected to a descriptive analysis, including variability and evolution studies. At this point, the continuous variables are described by using univariate statistics: (i) measures of central tendency: Mean (M) and median (m); (ii) measures of dispersion: Range (R), Standard Deviation (SD), Coefficient of Variation (CV), Standard Error of the Mean (SEM) and Interquartile Range (IR); and (iii) frequency distribution: histograms and box plots. However, those parameters are not suitable when describing categorical variables. Therefore, a cross-tabulation table is developed to show the number (frequency) of observations within each particular category for the variables selected.Table 3andTable 4below compile all the descriptive analysis previously mentioned.
Regarding the descriptive analysis of the dependent variable—the 5th year Economic Profitability—, the sample has a higher frequency in the range between 1% and 2%. The relative frequencies of the projects with negative profitability are quite high and, despite the greater relative frequencies of the projects with positive profitability, the higher the profitability the lower the frequency of projects in the sample. Although wefind a project with profitability close to 8%, it cannot be considered an outlier as it is in the upper quartile of the distribution.
The 5-year GDP variation variable is evenly distributed across a large interval, which ranges from–11.5% to +23.4%. Although there is a tendency to higher positive variations, a considerable number of values are negative, resulting in a GDP decline during the firstfive years of operation for almost 40% of the road sections in the sample.
Finally, with regard to the construction investment, most of the projects are largely concentrated in the lower ranges and the relative frequency gradually decreases. For this reason, there is a very sharp tendency towards low levels of investment, which explains the more Table 3
Descriptive analysis of continuous variables.
Histogram Box Plot Histogram Box Plot
Histogram Box Plot
Table 4
Descriptive analysis of categorical variables.
Type of project
EUfinanced Total
Yes No
Type of PPP
Explicit toll Greenfield 9 5 14
Brownfield 0 0 0
Road Widening 0 0 0
Total 9 5 14
Shadow toll Greenfield 7 7 14
Brownfield 10 0 10
Road Widening 4 11 15
Total 21 18 39
Availability Payment
Greenfield 0 0 0
Brownfield 0 4 4
Road Widening 0 0 0
Total 0 4 4
Total Greenfield 16 12 28
Brownfield 10 4 14
Road Widening 4 11 15
abrupt reduction of relative frequencies and intervals. Moreover, the projects lying above intervals with null relative frequency turn out to be atypical events.
5. Regression results and discussion
This section reports the mainfindings from the analysis undertaken to explain Economic Profitability in PPP projects for the case study of Spain. Subsection 6.1 presents the results of the modelling approach through a multiple linear regression specification. Discussion of the results and policy recommendations regarding PPP support are displayed in Subsection 6.2.
5.1. Regression results on economic profitability
In order to analyse the relationship between the economic profi t-ability of PPP projects and certain success factors such as the EU
financial support for PPP projects in Spain, a multiple linear regression model has been calibrated. The model explores (see Table 5) the influence of the different explanatory variables (success factors) considered. Particularly, it estimates to what extent having EUfinancial backing has, from a statistical point of view, a significant influence on the profitability of the projects; that is, whether the projects benefi ci-aries of EUfinancial aid are more likely to be profitable. Before setting up the regression model, some tests for checking multicollinearity between the explanatory variables modelled were applied, showing no significant interactions.
Most of the explanatory variables in the model were categorical, so a base case needed to be chosen as a reference to establish comparative analysis among the different categories (seeTable 5). For instance, with respect to the type of PPP, explicit toll concession was selected as the base case, so it allows us to approach whether shadow toll or availability payment concessions have a statistically significant diff er-ent performance for project profitability.
Table 5includes the modelling results from the multiple regression analysis. Given the significance level of every independent variable, we can observe that the type of concession and the economic environment are critical success factors for the economic performance of PPP projects. Furthermore, thefinancial support provided by the EU seems to positively influence the economic performance of PPPs. By contrast, the type of project and its location did not evidence to be an
explanatory factor significantly affecting the economic profitability. Further comments about the importance of these explanatory factors are provided below (see Subsection 6.2). Regarding the goodness-offit of the model, the 37.9% of variance of the Economic Profitability can be explained by three success factors. In addition, the signs of the regression coefficients and their statistical significance are consistent with the expected results, as it will be later discussed.
5.2. Discussion
In this section we discuss the results obtained from each one of the explanatory variables (success factors).
The results obtained show that the type of PPP significantly influences their economic profitability. Particularly, the model points out that both shadow toll and availability payment PPPs tend to be more profitable when compared to tolled ones. At this point, it seems that those projects not directlyfinanced through users´ contributions (explicit tolls) have a higher probability of being successful from the economic standpoint. This seems reasonable given that both shadow toll and availability payment mechanisms are less sensitive to economic
fluctuations. Moreover, the availability payment should be regarded in
first instance as the most favourable option whenever a PPP project is considered to be implemented. This result may be due to the fact that, in this type of PPP, the private operator does not assume the demand risk.
The results confirm that, as might be initially expected, the economic situation is positively correlated with the economic perfor-mance of road PPP projects. That is, if the level of economic activity increases, the profitability of the PPP project does it as well. This proves that this control variable works correctly.
We made the hypothesis that EU support contributes to a better quality and soundness of the projects thereby improving ceteris paribus the economic performance of these projects in the operational phase. The results support this hypothesis, since having EU support seems to be positively correlated with the economic performance of PPP projects, and the variable is significant at 90% level of confidence. This is likely related to the quality and suitability of the PPP project, the correct contract design and the transparency and fairness of the procurement process. All this facts together are ensured by the EU, giving rise to projects with a better economic performance over time.
Finally, it is worth mentioning that unlike expected, the type of Table 5
Multiple regression analysis for economic profitability.
Explanatory variables Unstandardized beta coefficients Unstandardized typ. error coefficients Significance level
(Constant) −2.148 1.044 0.045
Type of PPP
Explicit toll (base case)
Shadow toll 2.932 0.780 0.000
Availability payment 5.096 1.476 0.001
5-year GDP variation 0.070 0.032 0.035
EUfinancial support 0.979 0.539 0.076
Type of project
Greenfield (base case)
Brownfield road 0.797 0.913 0.387
Road Widening −0.488 0.705 0.492
Total construction investment 0.000 0.001 0.746
Location
Urban road (base case)
Interurban road 0.303 0.681 0.659
AdjustedR2 0.379
project—that is, greenfield, brownfield or road widening approaches— and its location —urban or interurban road— did not significantly influence the profitability of the concession. Regarding the type of project, it might seem reasonable that this variable was significant given the substantial difference in terms of work and investment needed between the different approaches. However, the results are consistent with those obtained for the total construction investment variable, which was not significant either. With respect to the location of the PPP projects, differences in economic performance between urban and interurban roads are not statistically significant. This might be due to the fact that although a higher traffic can be observed in urban roads, interurban ones are subjected to a greater traffic of heavy vehicles. Trucks tariffs are commonly 2–10 times higher than the car ones, so they make a significant contribution to the total revenues of the PPP compared with light vehicles.
6. Conclusions
The analysis of the case study of Spain shows that despite the EU effort to encourage the use of EU funds to support PPP projects, the application of the ERDF, the Cohesion fund and the TEN-T budget line to promote PPPs has been very limited. Regarding the innovative
financial instruments, their implementation at the time of the writing of this paper had been quite modest in Europe in general, but particularly in Spain. Finally, the EIB's lending activity to PPPs in Spain is currently the largest EU support source even though the share of EIB loans given to PPP projects compared to other loans has not increased over the last few years.
Based on the multiple regression analysis, the first conclusion is that there seems to be a positive relationship between the European
financial support and the economic profitability of PPP projects. The PPP projects that werefinancially backed by the EU seems to be more profitable. It is therefore necessary for the EU to continue promoting
financial instruments available to Member States to deliver transport infrastructure through successful public-private partnerships.
The second conclusion is that the type of road PPP is also a key factor to explain economic profitability. Both shadow toll PPPs and, to a greater extent, availability payment ones have higher economic returns when compared to explicit toll concessions. Then, those PPP projects not directlyfinanced through users’contributions and/or not assuming the demand risk show a better economic performance. This provides further support for the global trend towards preferably bidding new PPPs under availability payment approaches.
From the results of this paper, some aspects can be pointed out for further research works. First, the influence of other success factors on the profitability of PPP projects deserves to be explored in order to reinforce the main hypothesis of this research. Particularly, some of the variables discarded due to the difficulties encountered to collect them —such as construction delays, cost overruns and the variation of the estimated demand—are worth to be tested. Additionally, the influence of the European support could be analysed in a more disaggregated way, establishing a categorical approach to differentiate across grants, loans and guarantees. Finally, the methodology could also be used to analyse how Europeanfinancial support has influenced the success of PPP projects in other sectors such as rail, ports and airports.
Acknowledgments
The authors wish to thank the Spanish Ministry of Economy and Competitiveness (MINECO), which has funded the project EU Support mechanism to promote public private partnerships for financing transeuropean transport infrastructure [TRA2012-36590]. We also gratefully acknowledge the support and generosity of the Fundación Agustín de Betancourt, without which the present study could not have been completed.
References
Baeza, M.A., Vassallo, J.M., 2008. Traffic Uncertainty in Toll Motorway Concessions in Spain: An analysis of the ramp-up period. In: Proceedings of the Third International Conference on Funding Transport Infrastructure, 10th Journée Transport. París, pp. 299–304.
Bain, R., Wilkins, M., 2002. Traffic risk in start-Up Toll facilities.Standard & Poor's Infrastructure Finance., 30.
Chan, A.P.C., Scott, D., Lam, E.W.M., 2002. Framework of Success Criteria for Design/ Build Projects. J. Manag. Eng. 18.
Chan, A.P.C., Lam, P.T.I., Chan, D.W.M., Cheung, E., Ke, Y., 2010. Critical Success Factors for PPPs in Infrastructure Developments: Chinese Perspective. J. Constr. Eng. Manag. 136, 484–494.
Chislett, W., 2014. Spain leads the world market for infrastructure development [WWW Document]. URL〈http://www.realinstitutoelcano.org/wps/portal/web/rielcano_ en/contenido?WCM_GLOBAL_CONTEXT=/elcano/elcano_in/zonas_in/ari52-2014-chislett-spain-leads-world-market-for-infrastructure-development#. VeYksPbtmko〉.
Commission of the European Communities, 2004. Green paper on Public-private partnerships and community law on Public contracts and Concessions. COM 2004, 327.
Cooke-Davis, T., 2002. The "real’success factors on projects. Int. J. Proj. Manag. 20, 185-190.
Dall’Erba, S., 2003. European regional development policies : history and current issues, European Union Center Discussion Paper 2. University of Illinois.
Directorate General for EU Funds, 2014. La Política Regional y sus instrumentos [WWW Document]. URL〈http://www.dgfc.sgpg.meh.es/sitios/dgfc/es-ES/ipr/Paginas/ inicio.aspx〉.
EPEC, 2011. Using EU Funds in PPPs - explaining the how and starting the discussion on the future.
European Commission, 2003. Guidelines for Successful Public - Private Partnerships. Brussels.
European Commission, 2008. TEN-T Implementation of the Priority Projects Progress Report.
European Investment Bank, 2004. The EIB’s role in Public-Private Partnerships ( PPPs). European Investment Bank, 2015a. EIB at a glance [WWW Document]. URL〈http://
www.eib.org/about/index.htm〉.
European Investment Bank, 2015b. Finance contracts signed [WWW Document]. URL
〈http://www.eib.org/projects/loans/list/index.htm〉.
EUROSTAT, 2004. New decision of Eurostat on deficit and debt Treatment of public-private partnerships, Decision 18/2004, 11 February 2004.
Farinde, O. Sillars, D., 2012. A holistic success model for the construction industry Proceeding of the 2012 Engineering Project Organizations Conference–Global Collaboration , 1–21.
Gomez, J., Vassallo, J.M., Herraiz, I., 2015. Explaining light vehicle demand evolution in interurban toll roads: a dynamic panel data analysis in Spain. Transportation 43, 677–703.
Gunathilaka, S., Tuuli, M.M., Dainty, A.R.J., 2013. Critical Analysis of Research on Project Success in Construction Management Journals. In: Smith, S.D., Ahiaga Dagbui, D.D. (Eds.), In: Proceedings of the 29th Annual ARCOM Conference. Reading, UK, pp. 979–988.
Hardcastle, C., Edwards, P.J., Akintoye, A., Li, B., 2005. Critical success factors for PPP/ PFI projects in the Uk construction industry: a factor analysis approach. Constr. Manag. Econ. 23, 1–9.
Horta, I.M., Camanho, A.S., Moreira Da Costa, J., 2012. Performance assessment of construction companies: a study of factors promotingfinancial soundness and innovation in the industry. Int. J. Prod. Econ. 137, 84–93.
Inderst, G., 2013. Private Infrastructure Finance and Investment in Europe, European Investment Bank Working Papers No 2013/02.
Instituto Nacional de Estadística, 2014. Spanish Regional Accounting [WWW Document]. URL〈http://www.ine.es/jaxi/menu.do?Type=pcaxis & path=/t35/p010 &file=inebase & L=〉.
Jha, K.N., Iyer, K.C., 2006. Critical factors affecting quality performance in construction projects. Total Qual. Manag. Bus. Excell. 17, 1155–1170.
Kangari, R., Farid, F., Elgharib, H.M., 1992. Financial performance analysis for construction industry. J. Constr. Eng. Manag. 118, 349–361.
Kušljić, D., Marenjak, S., 2013. Critical Ppp/Pfiproject success criteria for public sector clients. Teh. Vjesn. Gaz. 20, 947–954.
Lam, E.W., Chan, A.P., Chan, D.W., 2008. Determinants of successful design-build projects. J. Constr. Eng. Manag. 134, 333–341.
Lim, C., Mohamed, M.Z., 1999. Criteria of project success: an exploratory re-examination. Int. J. Proj. Manag. 17, 243–248.
Liu, J., Love, P.E.D., Smith, J., Regan, M., Davis, P.R., 2014. Life cycle critical success factors for public-private partnership infrastructure projects. J. Manag. Eng., 04014073.http://dx.doi.org/10.1061/(ASCE)ME.1943-5479.0000307.
Liyanage, C., Villalba-Romero, F., 2015. Measuring success of PPP transport projects: a cross-case analysis of Toll roads.. Transp. Rev. 35, 140–161.
Matas, A., Raymond, J.-L., Ruiz, A., 2012. Traffic forecasts under uncertainty and capacity constraints. Transportation 39, 1–17.
Menches, C.L., Hanna, A.S., 2006. Quantitative measurement of successful performance from the project manager's perspective. J. Constr. Eng. Manag. 132, 1284–1293. Ministerio de Fomento, 2013. Informe 2013 sobre el sector de autopistas de peaje en
España.
performance objectives. Built Environ. Project Asset Manage 3, 228–249.
Müller, R., Turner, R., 2007. The Influence of Project managers on Project success criteria and Project success by type of Project. Eur. Manag. J. 25, 298–309.
Parfitt, M.K., Sanvido, V.E., 1993. Checklist of critical success factors for building projects. J. Manag. Eng. 9, 243–249.
Pašić, M., Bijelonja, I., Gusinac, E., 2014. Highway Empirical Traffic Flow Patterns and Regression Analysis. In: Proceedings of the 18th International Research/Expert ConferenceTrends in the Development of Machinery and Associated Technology TMT 2014. Budapest, pp. 285-288.
Ratnasabapathy, S., Rameezdeen, R., 2006. Design-bid-build vs. design-build projects: performance assessment of commercial projects in Sri Lanka,Symposium on Sustainability and Value Through Construction ProcurementSustainability and Value Through Construction Procurement. In-house publishing, University of Salford, Salford, UK, 474–481.
SEOPAN, 2015. Evolución de la licitación de concesiones de obras por tipos de obra y CCAA 2014.
Shenhar, A.J., Dvir, D., Levy, O., Maltz, A.C., 2001. Project success: a multidimensionsal strategic concept. Long. Range Plann. 34, 699–725.
Songer, A.D., Molenaar, K.R., 1997. Project characteristics for successful public-sector
design-build. J. Constr. Eng. Manag. 123, 34–40.
Songer, A.D., Molenaar, K.R., Robinson, G.D., 1996. Selection factors and success criteria for design-build in the U.S. and U.K. Journal of Construction Procurement 2, 69–82.
Tabish, S.Z.S., Jha, K.N., 2012. Success traits for a construction project. J. Constr. Eng. Manag. 138, 1131–1138.
Takim, R., Akintoye, A., 2002. Performance Indicators for Successful Construction Project Performance. In: Greenwood, D.J.(Ed.), In: Proceedings of the 18th Annual Association of Researchers in Construction Management (ARCOM) Conference, 2-4 September 2002, University of Northumbria. Association of Researchers in Construction Management,2, pp. 545-55.
Vassallo, J.M., Pérez de Villar, P., 2010. Diez años de peaje sombra en España. Rev. Obras. Públicas 3506, 19–30.
Yuan, J., Zeng, A.Y., Skibniewski, M.J., Li, Q., 2009. Selection of performance objectives and key performance indicators in public–private partnership projects to achieve value for money. Constr. Manag. Econ. 27, 253–270.
Zaharioaie, M., 2012. Appropriatefinancial instruments for public-private partnership in European Union. Procedia Econ. Financ. 3, 800–805.