Coronary Artery Tracking in 3D Cardiac CT
Images Using Local Morphological
Reconstruction Operators
C. Castro, M. A. Luengo-Oroz, A. Santos and M. J. Ledesma-CarbayoJuly 8, 2008 Biomedical Image Technologies Lab., ETSI Telecomunicación, Universidad Politécnica de Madrid
Abstract
Automatic segmentation and tracking of the coronary artery tree from Cardiac Multislice-CT images is an important goal to improve the diagnosis and treatment of coronary artery disease. This paper presents a semi-automatic algorithm (one input point per vessel) based on morphological grayscale local reconstructions in 3D images devoted to the extraction of the coronary artery
tree. The algorithm has been evaluated in the framework of the Coronary Artery Tracking Challenge 2008 [1], obtaining consistent results in overlap measurements (a mean of 70% of each vessel well tracked). Poor results in accuracy measurements
suggest that future work should refine the centerline extraction. The algorithm can be efficiently implemented and its general strategy can be easily extrapolated to a completely automated centerline extraction or to a user interactive vessel extraction.
Contents
1 Introduction 2
2 Algorithm overview 2
2.1 General framework 2
2.2 Preprocessing 2
2.2.1 Heart mask constriction 2
2.2.2 Calcium removal 3
2.2.3 Aorta detection 3
2.3 Coronary tree iterative reconstruction 4
2.3.1 Local morphological reconstructions 4
2.3.2 Directional window weighting 5
2.3.3 Tree searching 5
3 Results 6
1 Introduction
In medical imaging, vessel segmentation (see a very complete review in [2]) is the core of many practical applications such as diagnosis of the vessels (e.g. stenosis or malformations) or visualization systems and it may also be required in therapeutic tools such as computer-guided surgery. However, vessel segmentation is still an open problem and many methods have been proposed depending on the image modality, the human interaction required and many other factors. This article deals with datasets of 3D CTA images acquired in the Erasmus Medical Center Rotterdam, as part of the Coronary Artery Tracking Challenge 2008 [1]. It describes a method to automatically track the lumen center lines with minimal user interaction (i.e. allowing the use of just one point per vessel as input for the algorithm).
The article is structured as follows: first, we present the algorithm, based on iterative local morphological reconstructions [3], used for the extraction and tracking of the central lumen lines in the coronary artery tree. Then, we present and discuss the results obtained on 8 training and 16 testing datasets according to the objective, comparable evaluation metrics and the gold standards provided for the Challenge [1].
2 Algorithm overview
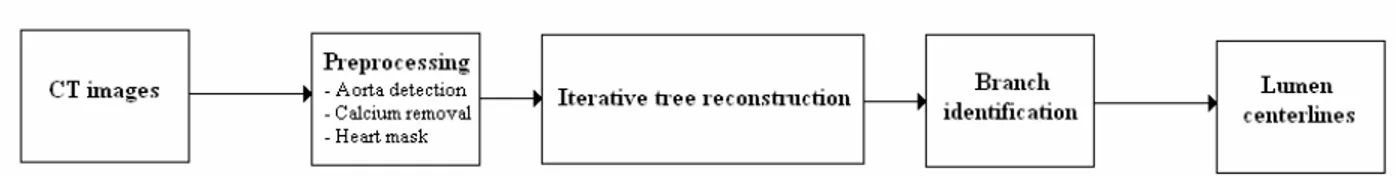
Figure 1. General scheme of the system architecture.
2.1 General framework
The goal is to track the centerlines of four of the main coronary artery branches named the Right Coronary Artery (RCA), the Left Anterior Descending (LAD), the Left Circumflex Artery (LCX) and one large side branch of the main coronary arteries [1]. Moreover, this has to be achieved with minimal user interaction, that is to say, the algorithm will only be able to use one point as input. That position will be point S, the starting point where the vessel leaves the aorta. In addition, when obtaining the vessels from the initial point, a second point can be used after the centerline determination in order to select the appropriate lumen to follow. Indeed, this is the approach used in this article. Our scheme starts the algorithm from point S, then detect all the possible vessels branching from the initial path (see Section 2.2) and finally keeping the one that passes by point A, a point inside the distal part of the vessel that unambiguously defines the vessel to be tracked. This way, we have certainty of starting our algorithm at the beginning of the vessel, robustness since multiple branch detection could provide us with a set of candidate vessels to choose among and a univocal choice determined by point A. It is also relevant to note that the algorithm is flexible enough to work with any other combination of provided points. The general scheme of the proposed method is detailed in Figure 1.
2.2 Preprocessing
2.2.1 Heart mask constriction
the rest of bright background structures that were disconnected to the heart were filtered out. The final result is a dataset equal to the original in those parts that belong to the cardiac region mask, and zero elsewhere Fig. 2.A.
Figure 2. A) Transverse views of the original CT image and the result after applying the corresponding heart mask. B) Calcium plaque. C) Calcium plaque removal result. D) Vessel trajectory avoiding the
calcium.
2.2.2 Calcium removal
Calcium appears as bright plaques on the vessel borders that must be avoided when delimiting the lumen centerlines trajectories. Since our algorithm follows tubular-like structures highlighted with respect to their surroundings, see Section 2.3.1, those pixels whose brightness is higher than a certain threshold above the blood gray level are darkened proportionally to their brightness. This threshold is an estimation of the characteristic gray level of blood in the image made according to those areas surrounding the starting points S. See Fig. 2.B
2.2.3 Aorta detection
An algorithm to automatically segment the aorta in the CTA images has been developed. The aorta segmentation is used to properly initialize which direction to follow when leaving point S. It can also be used as a stopping criterion when initializing the algorithm from other points than S. The direction followed by the vessels once they have left the aorta remains uncertain since all the regions surrounding are equally bright due to the presence of blood in both the aorta and the arteries. Locating the aorta allows us to choose the proper exiting direction.
The proposed algorithm segments the cross-section of the aorta in the top slice of the data and expands this segmentation through the z-axis. The correct circular zone corresponding to the aorta is selected in each slice by the Hough transform [5] and segmented with a morphological area opening. A circularity shape index over the segmented region is calculated in each slice in order to finish the segmentation when the segmented region (aorta) does not have the appropriate shape. The algorithm provided a proper segmentation for all the processed cases.
2.3 Coronary tree iterative reconstruction
After the preprocessing, our algorithm performs iteratively with step-wise morphological reconstructions in order to follow the coronary arteries trajectories. Given a certain initial point located inside the vessel, our method seeks, within a certain distance range, the best candidate, or candidates in case of branching, to be the following point in the coronary tree and repeats this operation recursively until the vessels are undistinguishable from the background. Afterwards, only those vessels passing by the unambiguous points A are selected and their positions among consecutive points interpolated before providing the final results. These procedures are described in the following sections.
2.3.1 Local morphological reconstructions
Morphological grayscale reconstruction [3] has previously been applied with success to the extraction of the coronary artery tree through 2D slice images [6]. Here, we propose a generalization of such method to 3D. Mathematical morphology is a nonlinear image processing technique that allows incorporating a priori knowledge of shapes such as the tubular branching structures of the coronary tree. In this way we are able to enhance this kind of structures and filter out the rest of elements in the image. In the current approach, we perform this operation iteratively according to the following steps, see Figs. 4 and 5:
1) Select the seed point, Pi, which will be used as marker image, M. This point belongs to the vessel trajectory, therefore having the characteristic blood gray level. It can be either the point S, at initialization, or the previously computed position, in case of the remaining steps.
2) Perform a local morphological reconstruction [6] of the marker image, M, inside the original heart image, G, restricted to a certain window, approximately of 3-5 mm. radius from point Pi.
RB1(M,G)= δ k
G(M)=δ 1
Gδ
k-1 G(M)
Where k is chosen such that δkG(M)= δ k+1
G(M) and δ 1
G(M)=δB1(M)∩G indicates a dilation [3] of image M by the structuring element B1 restricted to G.
3) Perform a top-hat opening [7]
V=RB1(M,G)-γB2(RB1(M,G))
Where γB2(RB1(M,G)) is an opening performed over the reconstructed image with a structuring element B2, a sphere of radius similar to the vessel width (e.g. 3 mm.). The result is the extraction of just those bright sections of the tubular-like structures whose width and gray level matches that of a typical vessel.
4) Apply a Gaussian filtering, W=G(V), in order to smooth possible noisy areas.
Figure 5. A) Detail of a vessel leaving the aorta. B) Marker image. C) Reconstruction window overimposed to the original image. D) Candidate points to be in the vessel trajectory in red.
2.3.2 Directional window weighting
Among the blood-like pixel candidates resultant by each local morphological reconstruction, we need to select which is the most appropriate aspirant to be the following point in the vessel trajectory. Collecting information about the vessel direction [8] is crucial in order to do so. For every iteration in the algorithm, a local directional arrow, v, is computed as the unitary vector linking actual position, Pi, with the previous one, Pi-1. Afterwards, the gray level scores of the candidate points are spatially weighted according to a Hanning window centered at the current direction. In this way, our algorithm gets blind to those candidate points opposing the directional arrow and considers them more and more likely as their angular deviations with v become smaller. This scheme proved to be a reasonable choice both to provide a spatially smoothed trajectory and to manage to follow the artery in case of partial occlusions.
2.3.3 Tree searching
We decided to implement a branch detection algorithm so that all the bifurcating vessels in the coronary tree could be extracted. Out of all possible vessels, only those passing by points A are retained. Once the following point in the trajectory has been selected a solid angle area around the current vessel is masked out and therefore no new candidate will be selected there. Under these circumstances, our algorithm calculates a new candidate point in the region remaining. When the new candidate gray level score is comparable to that of the initial one, we will consider the birth of a new branch, see Fig. 6.
A B
The algorithm is flexible to control how many ramifications will be found. There is a trade-off between the number of branches to extract and the CPU time. In the contest framework, our choice was to expand 6 children out of the main branch and 6 grandchildren out of each of the children. Finally, those candidates which best fit the aimed vessels (unambiguously defined by their points A) are selected. Once the minimum vessel length has been exceeded, the algorithm stopping criteria starts checking within each local reconstruction window whether it is possible to find structures having a radius matching that of a detectable artery (which ranges from 1.5 to 3.5 mm. approximately) or not. This procedure is achieved by means of morphological residues of top-hat openings. The tracking also stops in case the maximum possible vessel length is reached. These minimum and maximum lengths were found heuristically.
3 Results
The results presented here have been obtained using the 8 training and the 16 testing datasets described in [1]. Similarly, the evaluation metrics and software, the gold standards used and the scores assigned to the algorithm performance are those of Coronary Artery Tracking Challenge 2008 [1]. The method produces consistent results in global overlap measurement and tracking of the vessels of radius greater than 1.5 mm with a success rate around 70%. We found that this rate could be improved by refining our stopping criteria, which is not robust enough. On the other hand, results concerning accuracy show a mean distance of 7.35, 0.62 and 6.87 mm. in the proposed AD, AI and AT measurements respectively. In the case of well tracked vessels (“accuracy measurement until first error”), this mean distance is 0.62 mm. This is due to the fact that the local morphological reconstructions are influenced by the directional windowing, making the algorithm to follow the vessel but not being very precise on its centering when changing the direction of the vessel. Furthermore, results in “tracking until first error” (34.3%) which are much worse than the other overlapping measurements are directly consequence of this lack of fine precision in the centerline detection. Four out of the 64 vessels completely failed due to wrong initialization, while 7 were tracked with more than 90% of overlapping and less than 1mm. accuracy.
Table 2. Algorithm results on the 8 training datasets.
4 Discussion and future work
We observe quite robust overlap measures, specially in OV and OT, with rates around 70%. This means we are able to generally track the clinically relevant parts of the vessel (those exceeding 1.5 mm. width) which are usually placed at the proximal part from the aorta. Nevertheless, we fail to track the distal part of the arteries. This is a consequence of our stopping criteria which turns out to be not accurate enough. Improvements about this issue are needed. In the same sense, stopping too prematurely prevents us from getting better scores in the accuracy measures. Specially relevant are the AD and AT measures where the deviations shown in the tables could be drastically reduced in case the most distal parts were better tracked. Whereas, as long as we are inside the vessels, the centrelines were tracked with an average AI distance of 0.62 mm. Finally, we appreciate poor results as far as the OF overlap measure is concerned. This is mainly due to the fact that our directional filtering prevents our system from effectively detecting directional changes in the vessels. As a consequence, in case of curves, the algorithm tends to locate points at the vessel borders, or slightly outside them. This should be solved by implementing a new module that centers the output positions in the lumen centrelines. In addition, performing an interpolation based on minimal paths [9] between each pair of points should improve the results. A first minimal paths implementation was developed for this work with still unsatisfactory results.
An additional preprocessing step for vessel geometry enhancement [10] has been tried. Although the visual inspection of such pre-filtering step turned out to be promising, the computational complexity in terms of CPU time discarded it for practical applications to large 3D images. Concerning computational cost, the proposed branching schema takes approximately 30 min for the extraction of the whole coronary tree (vessels 0 to 3) in one dataset in an Intel Core2 CPU at 2.4 GHz with 3 GB of RAM. Nevertheless, a more detailed study comparing the number of explored branches with the obtained results will allow optimizing the CPU time requirements.
to expand branches until the end point E is reached. In addition, “Challenge 1: automatic tracking” can also be solved by our system adding minor modifications. In this case, protrusions in the detected aorta segmentations would be used as potential seeds to reconstruct the whole coronary tree.
Acknowledgements
This work was supported by the research projects TIN2007-68048-C02-01 from the Spanish Ministry of Education and Science and the CDTEAM project from the Spanish Ministry of Industry.
References
[1] C. Metz, M. Schaap, T. van Walsum, A. van der Giessen, A. Weustink, N. Mollet, G. Krestin and W. Niessen. 3D Segmentation in the Clinic: A Grand Challenge II – Coronary Artery Tracking. Medical Image Computing and Computer-Assisted Intervention – MICCAI, 2008.
[2] C. Kirbas, F. Quek. A review of vessel extraction techniques and algorithms. ACM Comput. Surv. 36, pp. 81-121, 2004.
[3] L. Vincent. Morphological grayscale reconstructions in image analysis: Applications and efficient algorithms. IEEE Transactions on Image Processing, vol. 2, no. 2, pp. 176-201, 1993.
[4] J. Serra. Image analysis and mathematical morphology. Academic Press, London, I, 1982, II, 1988. [5] R. O. Duda and P. E. Hart. Use of the Hough transformation to detect lines and curves in pictures. Comm. ACM, vol. 15, pp. 11–15, 1972.
[6] M. A. Luengo-Oroz, M. J. Ledesma-Carbayo, J. J. Gómez-Diego, M. A. García-Fernández, M. Desco and A. Santos. Extraction of the coronary artery tree in cardiac computer tomographic images using morphological operators. 4th International Conference on Functional Imaging and Modelling of the Heart (FIMH 2007). Lecture Notes in Computer Science, vol. 4466, pp. 424-432. Springer, 2007.
[7] S. Eiho and Y. Qian. Detection of coronary artery tree using morphological operator. Computers in Cardiology, vol. 24, pp. 525-528, 1997.
[8] G. Lavi, J. Lessick, P. C. Johnson and D. Khullar. Single-seeded coronary artery tracking in CT angiography. IEEE Nuclear Symposium Conference Record, vol. 5, pp. 3308-3311, 2004.
[9] L. Vincent. Minimal path algorithms for the robust detection of linear features in gray images. Proceedings of the International Symposium on Mathematical Morphology and its Applications to Image and Signal Processing, pp. 331-338, 1998.