For Peer Review
Structural Damage Detection and Reliability Estimation using a Multidimensional Monitoring Approach
Journal: Part F: Journal of Rail and Rapid Transit
Manuscript ID JRRT-16-0118
Manuscript Type: Article
Date Submitted by the Author: 05-May-2016
Complete List of Authors: Ortiz, Juan ; Universidad EAFIT Escuela de Ingenieria, School of Mechanical Engineering
Betancur Giraldo, German; Universidad EAFIT Escuela de Ingenieria, School of Engineering
Gomez, Johnny; Universidad EAFIT Escuela de Ingenieria, School of Mechanical Engineering
Castañeda, Leonel; Universidad EAFIT Escuela de Ingenieria, School of Mechanical Engineering
Zajac, Grzegorz; Politechnika Krakowska im Tadeusza Kosciuszki, Mechanica Engineering
Gutiérrez Carvajal, Ricardo Enrique; Universidad EAFIT Escuela de Ingenieria, School of Mechanical Engineering
Keywords: RAMS, Railway Vehicle, Sensor Fusion, strain measurement, Superstructure
Abstract:
Many structural elements are exposed to load conditions that are difficult to model during the design stage, such as environmental uncertainties, random impacts and overloading amongst others, thus, increasing unprogrammed maintenance and reducing confidence in the reliability of the structure in question. One way to deal with this problem is to monitor the structural condition of the element. This approach requires supervising several signals coming from critical locations and then, performing an accurate condition estimation of the element based on the data collected. Herein, this paper implements a method to diagnosis and evaluate the reliability of the bolster beam structure of the railway-vehicle during a fatigue test. The results show that multidimensional monitoring not only provides an accurate diagnosis of the element, but also that this technique allows to estimate reliability correctly.
For Peer Review
Page 1 of 12
http://mc.manuscriptcentral.com/JRRT Journal of Rail and Rapid Transit
For Peer Review
Structural Damage Detection and
Reliability Estimation using a
Multidimensional Monitoring Approach
Journal Title XX(X):1–12
c
The Author(s) 2016 Reprints and permission:
sagepub.co.uk/journalsPermissions.nav DOI: 10.1177/ToBeAssigned www.sagepub.com/
J. O. Ortiz1, German R. Betancur1, J. Gómez1,2, Leonel F. Castañeda1, G. Zaja¸c3and R.E.
Gutiérrez-Carvajal1
Abstract
Many structural elements are exposed to load conditions that are difficult to model during the design stage, such as environmental uncertainties, random impacts and overloading amongst others, thus, increasing unprogrammed maintenance and reducing confidence in the reliability of the structure in question. One way to deal with this problem is to monitor the structural condition of the element. This approach requires supervising several signals coming from critical locations and then, performing an accurate condition estimation of the element based on the data collected. Herein, this paper implements a method to diagnosis and evaluate the reliability of the bolster beam structure of the railway-vehicle during a fatigue test. The results show that multidimensional monitoring not only provides an accurate diagnosis of the element, but also that this technique allows to estimate reliability correctly.
Keywords
Structural Diagnosis; Structural Health Monitoring; Multidimensional Monitoring; Mechanical Systems; Singular Value Decomposition; Symptom Reliability.
Introduction
Nowadays, structural health monitoring (SHM)
is a topic of active research1. It consist of
the entire process of signal acquisition, signal processing and computer decision support to plan maintenance activities of critical elements in order to increase reliability, availability, maintainability
and security indexes (RAMS)2. SHM deals
with real operational conditions, many of them difficult to model during the design stage, such as environmental effects, the alteration of load conditions during operation, structural fatigue and
random impacts, amongst others3;4. This type
of maintenance strategy allows one to estimate the best time to perform a maintenance task, thus providing for the availability of qualified operators, the suited tools for the task and so forth, overall improving the system to which the structure belongs5;6.
Railway-vehicles in particular, are designed to operate for at least thirty years, but real-life conditions present a complex mixture of
alternated loads specific to each railway system7, such as railway routes, type of vehicles, different operational schedules and maintenance programs amongst others. This could result in early wearing of components, such as cracks and fissures; requiring frequent corrective maintenance tasks and also dramatically reducing its life-time,
in terms of operation and reliability8;9. These
scenarios get worse if we take into account that the effort of SHM on railway-vehicle structures is limited to the bogie, leaving the maintenance program of the remaining elements mainly supported by non-destructive tests, avoiding real-time signal measurements that would otherwise
1Universidad EAFIT
2Instituto Tecnológico Metropolitano 3Cracow University of Technology
Corresponding author:
R.E. Gutiérrez-Carvajal, GEMI research group Universidad EAFIT, Carrera 49 No. 7 Sur-50. Office 20-133, Medellín, Colombia.
Tel: (57)(4)4489500 ext 9145.
Email: rgutier7@eafit.edu.co
Prepared usingsagej.cls[Version: 2015/06/09 v1.01]
Page 2 of 12
http://mc.manuscriptcentral.com/JRRT Journal of Rail and Rapid Transit
For Peer Review
2 Journal Title XX(X)
diagnose the structure inline10. One of these
components is the bolster beam, which is the main structure of the carbody and is not a disposable piece. The diagnosis of a bolster beam consists of a set of non-destructive tests, such as those that include magnetic particles, ultrasound, permeable liquids, amongst others, that would require the whole train to be taken out of service, thus decreasing its availability. On the other hand, regarding fissures, the repair action would be to hire an expert operator to weld the fissure, whose level of expertize would depend on the location and type of weld11;12. Hence, it is critical for the maintenance manager to estimate when and where a fissure will appear.
Although there are several strategies for SHM reported in the literature13;14, such as the use of accelerometers and strain gauges measurements, acoustic signals, temperature sensors, machine vi-sion and profile detectors, as far as we know, there have not been any applications of SHM to the bolster beam, despite the fact that this is a critical structure needed for vehicle operation, in which poor maintenance or incorrect loading can result in damage to both the infrastructure and
passengers15. On the other hand, although full
scale fatigue and fracture requires a huge invest of time and monetary cost, these studies play an important role in validating engineering designs. Notwithstanding the existence of analytical mod-els and computational tools, this test provides the only reliable tool available to solve complex behaviours16.
Considering this issues, Universidad EAFIT designed and produced a new bolster beam
element17 to which we performed a destructive
fatigue test, simulating extreme starts and stops with loads and thereafter conducting a health monitoring strategy based on multidimensional monitoring. It allows not only for a complete diagnosis of the system, but also to estimate the reliability of the element, highlighting the first region to fail.
Bearing these ideas in mind, the rest of the article is organized as follows: Materials and Methods explains the experimental setup and methods used; Results presents the results obtained with the proposed method, Discussion discuses the main results; and finally Conclusions introduces the main conclusions of this study.
Materials and Methods
This study concerned to passenger vehicles similar in geometry and design to the ET420 trains set,
e.g., Munich S-Bahn and Metro de Medellín18.
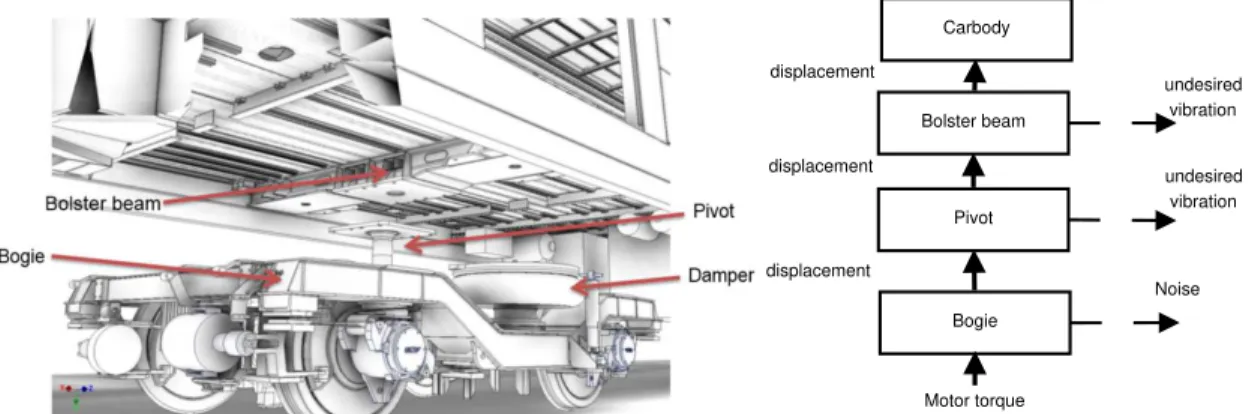
In particular, the bolster beam is the structural element that supports the loads coming from the carbody and transmits to it to the bogie movement through the pivot at interface element, as is presented in Fig. 1. Universidad EAFIT designed
a new bolster beam8;17 and performed a fatigue
test applying critical loads at the pivot, simulating impacts between bogie and the pivot, as reported by railroad operator.
Experimental Set-up
A database of stress signal at fifteen points were constructed during a fatigue test of a bolster beam designed by Universidad EAFIT. In the following subsections, the experimental setup is explained in detail, firstly, introducing the product test laboratory of Universidad EAFIT and secondly, introducing the sensors placed at the element.
Product Test Laboratory The load test was performed using the Product Test Laboratory of Universidad EAFIT. It is made up of four systems, as demonstrated in Fig. 2:
1. Reaction structure. This supports the loads applied to the bolster beam. It consist of a reaction frame that allows the actuators to be placed in several configurations, a reaction wall and underframe, that permit the element of interest to be placed according to test protocol.
2. Power system. It is composed of the set of elements required to transmit loads to the test element, mainly a 6CTAA8.3-G1
CumminsR Motor, three Shore-WesternR
922.5E actuators designed to apply 102 kN at tension and at 167 kN compression, two
Shore-WesternR
927E actuators designed to apply 995 kN and 1500 kN at tension and compression respectively19.
3. Control system. The power system is governed by a SC6000 controller system, an industrial computer running a software specifically designed for this purpose by the
Shore WesternR company20.
4. Monitoring system. The laboratory includes
HBMR MGCPlus equipment configured
Prepared usingsagej.cls Page 3 of 12
http://mc.manuscriptcentral.com/JRRT Journal of Rail and Rapid Transit
For Peer Review
Ortiz et al. 3
(a) Location of the bolster beam and the elements in its surroundings.
Pivot
Bogie displacement
Bolster beam
Noise undesired vibration
undesired vibration Carbody
displacement displacement
Motor torque
(b) The system’s energy processor model.
Figure 1. Railway-vehicle components. The bolster beam supports loads coming from the carbody and also from the bogie through the pivot as interface element.
Figure 2. Diagram of conformation of the test laboratory at testing a particular element. There are four interacting systems: the reaction, power, control and monitoring systems.
with 5 AP815 cards devoted to dealing with strain gauges signals and two AP801S6 cards that acquire signals coming from accelerometer transducers.
bolster beam Instrumentation The bolster beam instrumented corresponds to the element patented in17. Three different types of sensors were located
Prepared usingsagej.cls
Page 4 of 12
http://mc.manuscriptcentral.com/JRRT Journal of Rail and Rapid Transit
For Peer Review
Page 5 of 12http://mc.manuscriptcentral.com/JRRT Journal of Rail and Rapid Transit
For Peer Review
Page 6 of 12
http://mc.manuscriptcentral.com/JRRT Journal of Rail and Rapid Transit
For Peer Review
6 Journal Title XX(X)
Table 1. Definition of Symptoms. Regarding the Fourier transform, only the coefficients that correspond to {0,1,2,3,4} Hz were used.
Symptom Definition
Average (µ) µ= 1
N
PN
n=1xn
Standard deviation (σ) σ=q1
N
PN
n=1(xn−µ)2
Skewness (sk) sk=
1 N
PN
n=1(xn−µ)3 ( 1
N−1
PN
n=1(xn−µ)2)3/2
Kurtosis (kurt) kurt=
1 N
PN
n=1(xn−µ)4 (1
N
PN
i=1(xn−µ)2)2−3
Root Mean Square (rms) rms=q1
N
PN n=1x2n
Crest factor (cf) cf= |x|peak
rms
Fourier transform amplitude(|F{x}|) F{x}k=
PN
n=0xne−
2jπ
N kn,j=√−1
the dependency amongst symptomssiandsjwas
then computed using the Pearson coefficient of correlation as:
rsi,sj =
PN
n=1(Sni−µsi)(Snj−µsj)
N σsiσsj
. (3)
The most correlated symptom is selected as representative of all those symptons that obtain correlations higher than a threshold of 0.6. A new subset of symptoms is created with the remain symptoms and the process is performed repeatedly until each symptom is represented.
Multidimensional Condition Monitoring Multidi-mensional condition monitoring is based on the holistic modeling24;25, representing the element as an open system using two resolutions of time:
the high resolution one, t, in which the element
has a particular signature in the signals coming from it, where the system is considered instantly time-invariant, and the life-time (low resolution)θ
which correspond to observations where the sys-tem could be considered time-variant; hence, if the system wears during operation, signals observed at timeθi must differ from others observed atθj. It means that the system varies its efficiency over its life-time.
Herein, the symptoms matrix was constructed using the symptoms as columns of the SOM matrix
(O) selected above, with each observation (θ)
taken every 100 cycles, as in:
Opr =
Oθ1,S1 Oθ1,S2 Oθ1,S3 . . . Oθ1,S12
Oθ2,S1 Oθ2,S2 Oθ2,S3 . . . Oθ2,S12 ..
. ... ... . .. ...
Oθn,S1 Oθn,S2 Oθn,S3 . . . Oθn,S12 ..
. ... ... . .. ...
OθN,S1 Oθp,S2 Oθp,S3 . . . OθN,S12 , (4)
N being the total number of observations.
A way to decompose the SOM into linear combination of spaces is to perform a singular
value decomposition (SVD)26;27, which allows for
the generation of an index of failure (Σ) w.r.t an
orthonormal symptom space (U), formally:
Opr =UppΣprV⊤
rr, (5)
UandV⊤are unitary matrices andΣis a diagonal
matrix composed of non-negative numbers. Thus,
symptoms of damage (SD) were computed as:
SDi(θ) =Σiiui, (6)
hence, the system damage at time-life θ is
computed as the sum of all symptoms of damage, formally:
SD(θ) =
z X
i=1
|SDi(θ)|= z X
i=1
Σii·ui(θ). (7)
Moreover, as U is an orthonormal space, the
diagonal of Σ governs the contribution of each
vector to the symptom damage matrix, therefore, it is possible to use this information to construct
Prepared usingsagej.cls Page 7 of 12
http://mc.manuscriptcentral.com/JRRT Journal of Rail and Rapid Transit
For Peer Review
Ortiz et al. 7
another index of general damage summing up the contribution of each vector as:
DS(θ) =
z X
i=1
|Σii(θ)|. (8)
Symptom Reliability The holistic modeling ap-proach suggests that there is a finite quantity of energy that the system could dissipate before it must get out of service, defining the energy of the system as the sum of the absolute value of the singular values28. It allows for the reinterpretation of the damage occurred during the lifetime of the element as the quotient between the current
observed symptoms (θ(S)) and the limit allowed
of the symptom in which the machine is not safe to work (θl):
D(S) = θ(S)
θl(S) s.t. θl(S)> θ(S). (9)
Hence it is considered that the system will not continue in operation after reaching the limit
θl and hence 0< D(S)<1. On the other hand,
reliability (R) is defined as the probability of
a system to perform its task correctly, i.e., the system is operating belowθl(D), hence, reliability is redefined as:
R(S) = 1− θ(S)
θb(S) = 1−D(S). (10)
Typically, this limit is computed using a statistical test that measures the mean life of several elements with similar properties. However, in many cases it is not possible to get access to this information, due to a lack of specimens to test, a high variability in components and in the welding process itself (a huge number of specimens are indeed required). In this cases, it is preferable to
adjust an ad hoc bound based on the reliability
itself. Herein, we use the approach proposed in28,
whose metric includes the desired availability Pg
and the permissible probability of needless repair to avoid malfunctions:
R(Sl) = A
Pg
, (11)
the ratio A/Pg= 0.1 representing the design
rule28.
Results
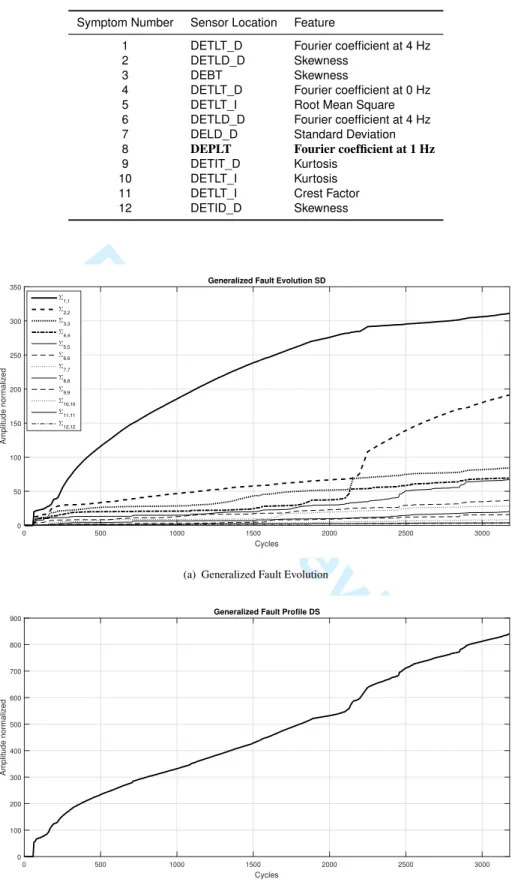
Table 2 introduce the symptoms selected by the redundancy reduction algorithm, based on the Pearson correlation coefficient. The symptoms are ranked according to their correlation with the remaining ones.
Figure 6 presents the generalized fault evolu-tion. Figure 6(a) presents the evolution of the
kSDik, which is equal to the singular value of
the corresponding vector. The evolution of each generalized fault presents a monotonic behavior.
The generalized fault profile DS evolution is
in-troduced in Fig. 6(b), and is used as a measure of the overall condition of the system.
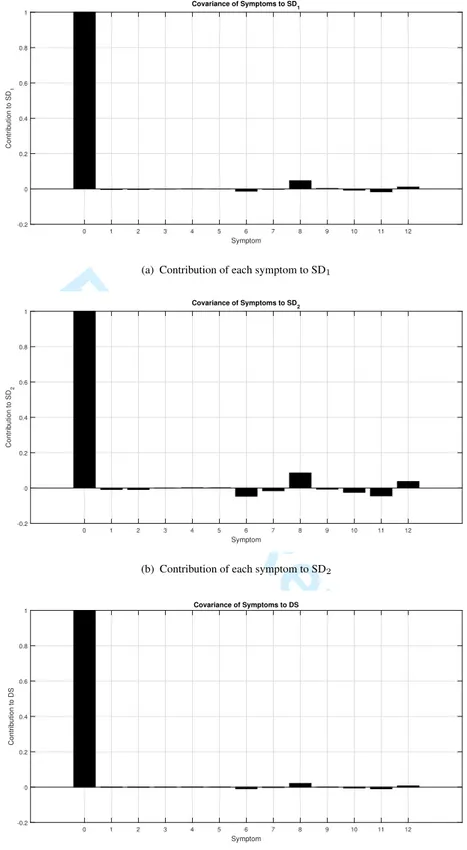
Figure 7 introduces the composition of the
gen-eralized failures SD1 and SD2, being the most
relevant in the construction of the overall condition
estimator, DS. The contribution to each
general-ized fault was computed via the covariance matrix and normalized using its internal variability. In all cases, the main coefficient was related to the sensor closer to the location where a crack appeared and also in the direction of load application (DEPLT). The second most relevant coefficient was related to the sensor DETLD_D, which is closer to the sec-ond weld that supports more stress in the bolster beam structure.
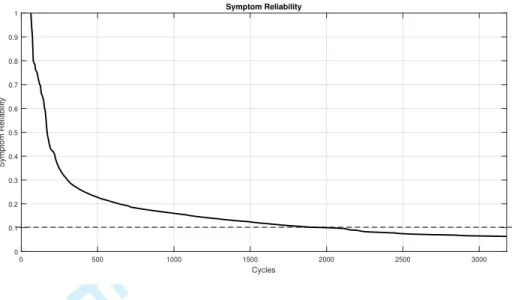
Figure 8 introduces the reliability symptom
curve computed from the DS normalized by its
first non-zero value. Using this curve and the reliability limit proposed above, the system could be safely used for a duration of 2000 cycles; after that, a maintenance task must be required. This result is coherent with the actual behavior of the couple pivot/bolster beam tested, as the pivot presented a crack after cycle number 2490.
Discussion
Structural monitoring deals with real conditions that are difficult to model during the design stage and also allows for the implementation of maintenance strategies for each specific device. This is a technique well suited for those structures that cannot withstand invasive or destructive tests. Also it is reported that continuously monitoring critical structures allows for a reduction in the cost of maintenance task, as the are addressed to the particular requirements of a specific structure, rather than a general policy based on periodic maintenance29.
Prepared usingsagej.cls
Page 8 of 12
http://mc.manuscriptcentral.com/JRRT Journal of Rail and Rapid Transit
For Peer Review
8 Journal Title XX(X)
Table 2. Symptoms selected after reduce their correlation. The closest sensor to the failure is presented in bold.
Symptom Number Sensor Location Feature
1 DETLT_D Fourier coefficient at 4 Hz
2 DETLD_D Skewness
3 DEBT Skewness
4 DETLT_D Fourier coefficient at 0 Hz
5 DETLT_I Root Mean Square
6 DETLD_D Fourier coefficient at 4 Hz
7 DELD_D Standard Deviation
8 DEPLT Fourier coefficient at 1 Hz
9 DETIT_D Kurtosis
10 DETLT_I Kurtosis
11 DETLT_I Crest Factor
12 DETID_D Skewness
Cycles
0 500 1000 1500 2000 2500 3000
Amplitude normalized
0 50 100 150 200 250 300 350
Generalized Fault Evolution SD
Σ1,1 Σ2,2 Σ3,3 Σ4,4 Σ5,5 Σ6,6 Σ7,7 Σ8,8 Σ9,9 Σ10,10 Σ11,11 Σ12,12
(a) Generalized Fault Evolution
Cycles
0 500 1000 1500 2000 2500 3000
Amplitude normalized
0 100 200 300 400 500 600 700 800 900
Generalized Fault Profile DS
(b) Generalized Fault Profile
Figure 6. Generalized faults and generalized fault profile. Figure (a) presents the evolution of the energy of each generalized fault, i.e.,Σii. In this case the first singular value rise faster than others. Figure (b) presents the generalized fault profile, it is the overall
condition estimation, which is a monotonic rising function related to the overall system wear.
Prepared usingsagej.cls Page 9 of 12
http://mc.manuscriptcentral.com/JRRT Journal of Rail and Rapid Transit
For Peer Review
Ortiz et al. 9
Symptom
0 1 2 3 4 5 6 7 8 9 10 11 12
Contribution to SD
1
-0.2 0 0.2 0.4 0.6 0.8 1
Covariance of Symptoms to SD1
(a) Contribution of each symptom to SD1
Symptom
0 1 2 3 4 5 6 7 8 9 10 11 12
Contribution to SD
2
-0.2 0 0.2 0.4 0.6 0.8 1
Covariance of Symptoms to SD2
(b) Contribution of each symptom to SD2
Symptom
0 1 2 3 4 5 6 7 8 9 10 11 12
Contribution to DS
-0.2 0 0.2 0.4 0.6 0.8
1 Covariance of Symptoms to DS
(c) Contribution of each symptom to DS
Figure 7. Contribution of symptoms to generalized faults, measured as covariance. The first covariance value is always one, as it is the autocovariance. Figures 7(a) and 7(b) presents the covariance of each selected symptom to the first two singular values. Figure 7(c) presents the covariance of each symptom to the generalized profile,DS. Note that in all cases the maximum covariance appears at sensor DEPLT, the sensor closest to the crack.
Prepared usingsagej.cls
Page 10 of 12
http://mc.manuscriptcentral.com/JRRT Journal of Rail and Rapid Transit
For Peer Review
10 Journal Title XX(X)
Cycles
0 500 1000 1500 2000 2500 3000
Symptom Reliability
0 0.1 0.2 0.3 0.4 0.5 0.6 0.7 0.8 0.9
1 Symptom Reliability
Figure 8. Symptom reliability. Accordingly to this graph, the system reaches 0.1 reliability after 2000 cycles of operation. The pivot of the bolster beam broke-down after 2490 cycles.
Currently, maintenance of the carbody structure is based on non-destructive tests, following a periodic inspection strategy. In this cases, the entire train is taken out of operation to perform the inspection, reducing its availability. Particularly, Schlake et al. recently proposed a method based on computer vision to identify
fissures in the structure9. Despite the fact that
it monitors the entire underframe structure, the failure must be visible by the naked eye and also, it does not directly instruct a maintenance task recommendation until it requires a corrective task to be undertaken. The method proposed herein to monitor the bolster beam not only estimates the current condition of the system, but also takes into account the history of the condition to construct a reliability function to guide the maintenance program.
Reliability is typically computed based on the time to the point of failure measured by a set of similar devices30. The inner variability in material composition, sensor sensitivity, low repeatability to perform welds and other such factors are all taken into account. The approach taken herein explodes the information coming from the history of a particular device and creates a specific reliability, reducing those uncertainties.
The method proposed differs from machine learning methods as they learns from examples, an action that limits the type of identifiable
failures31;32. The proposed method estimate the
current reliability of the system based in several lowly-correlated symptoms and also finds the source of data that contributes the most to condition variation. Finally, the method explored in this article relates condition evolution with system reliability. Typically, to compute the reliability associated with a machine, it is necessary to measure the lifetime of a statistical
significant number of similar devices33. On the
contrary, the method used herein takes advantage of all the measurements performed in a particular system to the current reliability. It allows for a function to be fit over the reliability curve and predicts the best time to perform a maintenance task.
Conclusions
This study presented the application of multidi-mensional monitoring to SHM, particularly con-cerning the bolster beam of a railway vehicle. The method is sensible to input signals, hence it was necessary to develop a strategy to reduce redundancy amongst symptoms, which consisted of a recursive algorithm based on the Pearson cor-relation coefficient. Multidimensional monitoring allowed for the combination of signals coming from several locations in the bolster beam and generated a single index to evaluate the entire system, which is directly related to its reliability. The technique not only recommended performing a maintenance task 490 cycles before the system
Prepared usingsagej.cls Page 11 of 12
http://mc.manuscriptcentral.com/JRRT Journal of Rail and Rapid Transit
For Peer Review
Ortiz et al. 11
failed, but also accurately located the region of the failure.
Acknowledgements
The authors want to acknowledge Universidad EAFIT staff for the support received to this study.
Funding
This work was partially funding by the “Patrimonio autónomo
Fondo Nacional de Financiamiento para la Ciencia, la Tecnología y la Innovación, Francisco José de Caldas”.
Declaration of conflicting interests
The authors declare that there is not conflicting interests.
References
1. Seo J, Hu JW and Lee J. Summary review of structural
health monitoring applications for highway bridges.
Journal of Performance of Constructed Facilities 2015;
DOI:10.1061/(ASCE)CF.1943-5509.0000824. URL
http://dx.doi.org/10.1061/(ASCE)CF.
1943-5509.0000824. http://dx.doi.org/
10.1061/(ASCE)CF.1943-5509.0000824.
2. Farrar CR and Worden K. An introduction to structural health
monitoring.Philosophical Transactions of the Royal Society A
2007; 365.
3. Tlili L, Radhoui M and Chelbi A. Condition-based
maintenance strategy for production systems generating
enviromental damage.Mathematical Problems in Engineering
2015; 2015: 12 pages. DOI:http://dx.doi.org/10.1155/2015/
494162. URLhttp://www.hindawi.com/journals/
mpe/2015/494162/.
4. Lv Z, Wang J, Zhang G et al. Prognostics health management of condition-based maintenance for aircraft engine systems. IEEE Conference on Prognostics and Health Management (PHM)2015; : 1–6DOI:10.1109/ICPHM.2015.7245055. 5. Gutiérrez-Carvajal RE, de Melo LF, Rosario JM et al.
Condition-based diagnosis of mechatronic system using a
fractional caluclus approach. International Journal of
Systems Science 2014; : 9 pagesDOI:10.1080/00207721.
201. URL http://www.tandfonline.com/doi/
full/10.1080/00207721.2014.978833.
6. Cho S. Probabilistic fatigue life prediction for bridges using system reilability analysis and shm-based finite elemen model
updating. 12th International Conference on applications of
Statistics an Probability in Civil Engieering2015; : 1–8. 7. Martinod RM, Betancur GR, Osorio JF et al. A study of the
effect of the transition curve in the coupling elements between
the carbody and the bogie.Transportation safety and security
2014; 21(4): 351–363. DOI:http://dx.doi.org/10.1504/IJHVS. 2014.068113.
8. Aristizabal M, Barbosa JL, Betancur GR et al. Structural
di-agnosis of rail vehicles and method for redesign.Diagnostyka
2014; 15(3): 23–31.
9. Schlake BW, Todorovic S, Edwards JR et al. Machine
condition monitoring of heavy-axle load rail structural
underframe components. Proceedings of the Institution of
Mechanical Engineers, Part F: Journal of Rail and Rapid Transit2010; .
10. Ngigi RW, Pislaru C, Ball A et al. Modern techniques
for condition monitoring of railway vehicle dynamics. Journal of Physics: Conference Series 2012; 364(1): 12 –16. URL http://stacks.iop.org/1742-6596/ 364/i=1/a=012016.
11. EN/ISO. EN/ISO 14731: Welding coordination ˚U tasks and
responsibilities, 2006.
12. EN/ISO. EN/ISO 14732:2013: Welding personnel
-qualification testing of welding operators and weld setters for mechanized and automatic welding of metallic materials, 2013.
13. Kouroussis G, Caucheteur C, Kinet D et al. Review of
trackside monitoring solutions: From strain gages to optical
fibre sensors.Sensors2015; DOI:10.3390/s150820115.
14. Liang JY and Deng XJ. Structural Heatlh Modelnitoring
2015: System Reliability for Verivication and Implementation, chapter Applications of Structural Health Monitoring on Intelligent High-speed Train. 2015. pp. 2037–2045.
15. Barke D and Chiu WK. Structural health monitoring in the
railway industry: a review. Structural Health Monitoring
2005; 4(1): 81–94. DOI:10.1177/1475921705049764.
URL http://shm.sagepub.com.ezproxy.eafit. edu.co/content/4/1/81.full.pdf+html. 16. Raghava G. Contribution to structural integrity: Fatigue and
fracture related full scale experimental investigations carried
out at csir-serc.Procedia Engineering2014; 86: 139–149.
17. Heredia LFC, Pérez JLB, Cano MA et al. Traviesa
para vehículos ferroviarios de pasajeros, procedimiento de ensamble de la misma y método para disponerla en una carrocería de vehículos ferroviarios, In process.
18. Martinod RM, Betancur GR and Castañeda LF. Identification of the technical state of suspension elements in railway
systems. Vehicle System Dynamics2012; 50(7): 1121–1135.
DOI:http://dx.doi.org/10.1080/00423114.2012.656657. 19. Shore Western Manufacturing Inc., 225 W. Duarte rd.
Monrovia, CA 91016. User Manual 92XE Series Linear
Actuators, v20140728 ed, 2014.
20. Shore Western Manufacturing Inc., 225 W. Duarte rd.
Monrovia, CA 91016. SC6000 Operation Guide v8.2.39,
System Overview, 2014.
21. Hoffmann K. An Introduction to Measurements using Strain
Gages. Hottinger Baldwin Messtechnik GmbH, Darmstadt, 1989.
22. Martinod RM, Betancur GR, Castañeda LF et al. Estimation of combustion engine technical state by multidimensional
analysis usin svd method. Vehicle Systems Modelling and
Testing2013; 8(2): 105–118. DOI:http://dx.doi.org/10.1504/ IJVSMT.2013.054476.
23. Cempel C. Vibroacoustic condition monitoring. NASA
STI/Recon Technical Report A1991; 93.
24. Natke HG and Cempel C. Model-Aided Diagnosis of
Mechanical Systems. Springer, 1997.
25. Natke HG and Cempel C. Holistic dynamics and subsystem
modelling: principles. International Journal of Systems
Science1999; 30(3): 283–293.
26. Cempel C and Tabaszewski M. Multidimensioanal
condition monitoring of machines in nonstationary operation.
Prepared usingsagej.cls
Page 12 of 12
http://mc.manuscriptcentral.com/JRRT Journal of Rail and Rapid Transit
For Peer Review
12 Journal Title XX(X)
Mechanical systems and Signal Processing2007; 21(3): 1233– 1241.
27. Cempel C. Decomposition of the symptom observation matrix and grey forecasting in vibration condition monitioring of
machines. International journal of applied mathematics and
computer science2008; 18(4): 569–579.
28. Cempel C. Assessment of symptom limit value in
vibration condition monitoring. Proceedings of the
First International Congress on Condition Monitoring and Diagnostic Engineering1989; : 29–33.
29. Ceravolo R, Pescarote M and Stefano AD. Symptom-based reliability and generalized repairing cost in monitored bridges. Reliability Engineering & System Safety2009; 94(8): 1331– 1339.
30. McPherson JW.Reliability Physics and Engineering.
Time-To-Failure Modeling. New York, USA: Springer, 2010.
31. Mechbal N, Uribe JS and Rébillat M. A probabilistic
multi-class multi-classifier for structural health monitoring. Mechanical
Systems and Signal Processing2015; 60-61: 106–123.
32. Santos A, Figueiredo E, Silva M et al. Machine learning
aalgorithms for damage detection: Kernel-based approaches. Journal of Sound and Vibration2016; 363: 584–599.
33. Hasan Touama MB. Estimation and evaluation the
reliability of production machines practical study of the textile department/the national establishment of the jordanian textiles
in the industrial king abdullah ii city. Procedia - Social and
Behavioral Sciences2013; 93: 125–133.
Prepared usingsagej.cls Page 13 of 12
http://mc.manuscriptcentral.com/JRRT Journal of Rail and Rapid Transit