ISSN 1732–4254 quarterly
journal homepages: http://www.bulletinofgeography.umk.pl/ http://wydawnictwoumk.pl/czasopisma/index.php/BGSS/index http://www.degruyter.com/view/j/bog BULLETIN OF GEOGRAPHY. SOCIO–ECONOMIC SERIES
© 2015 Nicolaus Copernicus University. All rights reserved. © 2015 De Gryuter Open (on-line).
DE
G
Technical efficiency of the generation of knowledge
in the European Union (2003-2010)
Manuel Agüeros
1, DF, Pedro Casares-Hontañón
2, FMR, Pablo Coto-Millán
3, CR,
Miguel Ángel Pesquera
4, CUniversity of Cantabria, Avda. de los Castros, s/n, C.P.: 39005, Santander-Cantabria, Spain; e-mail: 1[email protected], 2casaresp@
unican.es (corresponding author), 3[email protected], 4[email protected]
How to cite:
Agüeros, M., Casares-Hontañón, P., Coto-Millán, P. and Pesquera, M.A., 2015: Technical efficiency of the generation of knowl-edge in the European Union (2003-2010). In: Szymańska, D. and Rogatka, K. editors, Bulletin of Geography. Socio-economic Series, No. 27, Toruń: Nicolaus Copernicus University, pp. 7–16. DOI: http://dx.doi.org/10.1515/bog-2015-0001
Abstract. This paper analyses the determinants of knowledge in the European Union of the 27, through estimates of transcendental logarithmic production functions (translog) in different scenarios. For this, a data panel for the period 2003-2010 has been elaborated, selecting the production stochastic frontier as the most reliable model to estimate technical efficiency for European innovation. The empirical result is that technological capital, human capital and relational capital have a positive and significant influence on the generation of knowledge. Also, from the observation of results we can assure that the size (in terms of popula-tion) of a country within the EU-27 does not positively influence the technical efficiency of knowledge production.
This is an empirical study about the relationship between the determinants of knowledge and the technical efficiency of the generation of knowledge, and such a study does not exist in literature for the EU-27 in the period analysed.
Contents:
1. Introduction . . . 8
2. Literature review . . . 8
3. Theoretical framework of the model and the analysis of technical efficiency in knowledge . . . 10
3.1. Model. . . 10
3.2. Stochastic frontier of technical efficiency in European knowledge . . . 11
4. Variables and data used . . . 12
5. Results . . . 13 6. Conclusions . . . 15 References . . . 15 Article details: Received: 10 February 2014 Revised: 6 May 2014 Accepted: 10 December 2014 Key words: efficiency, knowledge, European Union, human capital, production. © 2015 Nicolaus Copernicus University. All rights reserved.
1. Introduction
In the innovative process developed within the countries of the European Union today, the pos-sibility that technical efficiency of such knowledge activities differs among the set of countries stud-ied will be considered. The result will be a model-ling of the knowledge production strong enough to assess which countries are leaders in the use of in-puts to generate knowledge, and which ones should consider modifying their innovative strategy. This strategy is basically defined by the combination of those inputs which, together, generate knowledge, such as technological capital, human capital and collaborative factors among enterprises and institu-tions, which, we assume, a priori facilitate knowl-edge production in each country. This is defined as relational capital. The starting point will be a data panel obtained from the European Innovation Score-board, an annual report published by the European Commission since 2003 inclusive, for all 27 coun-tries in the European Union.
In general, there are different points of view that attempt to address the issue of efficiency. However, this concept is so complex that it has been broken down by economic theory into two components, the orthogonal multiplication of which results in economic efficiency. The first one, called allocative efficiency, attempts to find out to what extent inputs are hired more or less efficiently; in other words, paying competitive prices. On the other hand, the second component of economic efficiency is called technical efficiency, and is defined as output max-imisation, considering specific amounts of inputs and a specific technology or combined form of such inputs.
The present study will focus on quantifying the degree of technical efficiency of each country when compared to the rest, so as to rank them and show which countries maximise technical efficiency in generating knowledge, considering the inputs they possess.
The structure of this paper is as follows: the next section will present a brief literature review, the third section will address the theoretical framework using one estimation methodology: stochastic production frontiers, to be reviewed in the third section and specified in the theoretical model as translog
pro-duction functions. The data and the variables used in the model will be presented in the fourth sec-tion. Next, the econometric results obtained will be assessed and, finally, a number of conclusions will be presented.
2. Literature review
The issue of technical efficiency has been raised in recent decades by numerous authors, acquiring particular significance when applied to the estima-tion of aggregate producestima-tion funcestima-tions. Thus, most works in this field have focused on the study of technical efficiency in the generation of added val-ue and total factor productivity.
First, Afriat (1972) analysed the main studies published previously on the analysis of technical efficiency of the added value production functions. He stated –as a criticism– that econometric estima-tion techniques were remarkably simple and pre-dictable, in most cases maintaining the classical regression model. Thus, he elaborated an exten-sion of that theoretical model, introducing into the production function the possible existence of inef-ficiencies in the production process, including an error term containing two components: one which was fixed and one which could oscillate. This term adopted an exponential form, assuming that its den-sity was distributed on the basis of the known gam-ma density function. In the same work, he proposed the econometric estimation method of maximum likelihood.
Subsequently, Aigner et al. (1977) also made in-teresting contributions to the field of empirical es-timation of technical efficiency collected in the various functional forms that production functions can adopt. As Afriat (1972), they placed the initial reference of technical efficiency consideration in the context of applied economic analysis, in the work of Farrel (1957). However, the innovation of these authors lay in presenting an estimate of a stochas-tic production function, whereas previous work had focused on analyses based on a deterministic pro-duction frontier, although, as we shall see, this last method has continued being used. Within empiri-cal contrasts, numerous production frontier models are used which show that estimates of the
stochas-tic frontier are not substantially different from those known so far, although maximum likelihood values point to a better approximation of technical efficien-cy using stochastic production frontiers.
Meanwhile, Meeusen et al. (1977) analysed tech-nical efficiency in the French manufacturing sec-tor in 1962, and produced a ranking of the existing technical efficiency in all productive sectors of the time, analysing this concept and considering most of the methodologies for estimating technical effi-ciency proposed so far. Their main result showed that the most efficient production sectors were those of footwear, sugar and drinks, whereas the group of industries leading inefficiency included the glass in-dustry and dairy products.
Greene (1980), inspired by the idea of Aigner et al. (1968), also proposed an econometric model for the purpose of correcting the intercept of a re-gression estimated in the first stage, to then com-pare estimates of the dependent variable with their true values, excluding that common intercept. To this end, he developed a deterministic production frontier model, and obtained an indicator of tech-nical efficiency in the production of the U.S. met-allurgical sector.
A great contribution to the specification of technical inefficiency was made by Schmidt et al. (1984), who studied inefficiency considering a pro-duction function within the U.S. airline indus-try, using the data panel methodology for a period spanning from 1970 to 1978 and studying differ-ent airline data quarterly during those eight years. Furthermore, they proposed a novel specification of the common intercept, within the estimate of sto-chastic production functions frontiers, which con-sisted in assigning a binary variable for each of the airlines, thus collecting the individual effect that each of them had on the efficiency of the sector as a whole. On the other hand, they included the random disturbance component, variable for each company and each moment. Similarly, Battese et al. (1992 and 1995) continued to examine techni-cal efficiency in the production function for agri-cultural enterprises in India, and also considered the stochastic production frontier, finding that the companies considered hardly varied their efficiency over time, so the component associated with each particular company was statistically irrelevant; that is, changes in technology occurring throughout the
study period did not result in an increase in tech-nical efficiency.
Furthermore, Baños-Pino et al. (1999) and Co-to-Millán et al. (2000) conducted various estimates of allocative and economic efficiency, respectively, within the port and airport transport industry in Spain, verifying that deterministic and stochastic parametric methods differed in their results.
More recently, Pires et al. (2004) found, with a panel of 35 developed countries in the period 1970- -2000, that the main part of the observed technical progress was explained by the good performance of technical efficiency, despite the fact that allocative ef-ficiency suffered a moderate decline. They also con-cluded that a part of technological progress was not entirely explained by efficiency, even after incorpo-rating technological expenditures in innovation.
Alvarez et al. (2007) focused their analysis on the evolution of economic efficiency in the dairy sector in the province of Asturias, estimating the corresponding costs function. They showed that extensive production was less costly than intensive production in terms of the inputs used, but more inefficient in terms of technical efficiency.
Andrés et al. (2010) conducted one of the most recent works dealing with technical efficiency, esti-mating stochastic frontiers for coffee production in Colombia. They sectioned the sector by the supply side, and found that the most efficient coffee farms were those which were larger in size (with efficient coffee production levels around 90%), whilst small and medium farms barely reached 70% technical ef-ficiency. Coto-Millán et al. (2007) analysed the tech-nical and economic efficiency of Spanish airports for the period 1992-1994. Rodriguez et al. (2007) studied technical efficiency in ports. Furthermore, Tapiador et al. (2008) and Lozano et al. (2011) an-alysed technical efficiency for airports in 2006 and 2007, respectively. Size is important in the results of many empirical studies for airports, ports and oth-er sectors: economies of scale are achieved and larg-er production units are more technically efficient.
Therefore this research will study whether the size of a country (in terms of population) generates more technical efficiency or not.
With respect to the specific literature review on the estimation of knowledge production func-tions, the background is found in Griliches (1979), who pointed out that the main determinants of
knowledge production (measured by the number of innovation patents) are the expenditure in R&D (hereinafter referred to as technological capital) and the Human Capital. Authors such as Jaffe (1986) added other important variables to the produc-tion funcproduc-tion in order to capture effects of proxim-ity dimensions on knowledge spillovers. The work of Jaffe (1989) attempting to measure the real ef-fect of academic research is also of great interest. These works have inspired the following investiga-tions: Coto-Millán et al. (2011), estimating technical efficiency in the production of innovation in the At-lantic Arc regions for 2002-2006, Badiola and Coto (2012), analysing an innovation production func-tion for European regions for the period 2002-2006, Badiola et al. (2012), analysing the determinants of technical efficiency and innovation in the European regions during the period 2002-2006, and Agüeros et al. (2013), investigating the determinants of a knowledge production function for European coun-tries during the period 2003-2009.
In particular, there is little literature on research works which adopt methodologies of knowledge production efficiency with regression models based on parametric and nonparametric approaches. It is worth mentioning the works by Moreuno et al. (2005) to capture the spillover effects in Europe-an regions Europe-and the investigations by Marrocu et al. (2011a) and Marrocu et al. (2011b) to capture the factors of proximity and density of social networks in the knowledge production function.
The work by Miguelez et al. (2013) estimates a knowledge production function for major European regions with panel data for the period 2000-2007, using the method of parametric frontiers. It con-cludes that knowledge generation is positively in-fluenced by the traditional variables technological capital and human capital, and by labour mobili-ty between regions, as well as negatively influenced by the density of social networks. In addition, the most technically efficient regions in the production of knowledge are concentrated in central Europe and Scandinavia. However, the highest production of knowledge occurs not only in regions belong-ing to Finland and Sweden, but also in regions of France, northern Italy, Germany, Spain, Denmark, Austria and the Netherlands. It is noteworthy that some regions in these countries are highly special-ised in the manufacturing sector, such as
Emil-ia-Romagna, Lombardy, Veneto and Piemonte in Italy, Rhône-Alpes in France and Stuttgart in Ger-many. There is also a “proximity to a big city” effect that is highly important so that regions where major cities are located, such as Stockholm, Île de France, Catalonia, Düsseldorf, Vienna, Berlin, Lazio, Köln, Madrid and Hanover, are more efficient in produc-ing knowledge.
Finally, the work of Fodi et al. (2013) estimates the knowledge production function in key Euro-pean regions with panel data for the period 2000-2007, using the two methods of parametric and nonparametric frontiers, concluding in both cases that regions located in central Europe, such as Île de France, Stuttgart or Belgian Noord-Brabant, are the most efficient, while more peripheral regions are the least efficient, in particular regions of coun-tries which have joined the European Union most recently.
3. Theoretical framework of the model
and the analysis of technical efficiency
in knowledge
3.1. Model
In this section the theoretical framework of the knowledge production function is presented, for which we adopt an empirical econometric specifi-cation.
Following the economic literature on the esti-mation of knowledge production functions (Grili-ches, 1979; Jaffe, 1986, 1989; Cohen et al., 1990), as determinants of the knowledge activity we in-clude the human capital and the expenditures in R&D (technological capital). Also, the econometric specification of the model proposed in this research includes another variable, determining the genera-tion of knowledge, which we will call relagenera-tional cap-ital. This includes the collaborative capacity among institutions and businesses, and is measured from the number of innovative and knowledge-generat-ing research projects developed by private compa-nies in collaboration with other private compacompa-nies or by private companies in collaboration with pub-lic and/or private institutions. This new variable is inspired by the work of Ponds et al. (2010).
Next, the analytical process described in the in-troduction section will be developed, stating the necessary equations that lead to the analysis of the object of study. The first consideration to keep in mind is that efficiency analysis can be approached from two perspectives: the first one is to use non-parametric estimation tools (particularly Data Envelopment Analysis or DEA) and the second one is to use parametric tools. In the latter case, the most common techniques are those focused on es-timating parametric stochastic production frontiers.
3.2. Stochastic frontier of technical efficiency in European knowledge
In order to analyse in depth the issue of techni-cal efficiency in the knowledge of European Union countries, we will consider a model of stochastic production frontiers, as opposed to the determin-istic analysis of technical efficiency.
Firstly, Wold (1938) developed the theorem used by all the econometric foundations of this model in the field of time series. He established that every variable to be explained could always be divided into two processes; a deterministic one, which does not vary over time, and a stochastic one, appear-ing as the result of the imperfection regression con-sidered, which will decrease proportionally to the level of description of the dependent variable (in-novation, in this case). Subsequently, the works of Aigner et al. (1977) and Meussen et al. (1977) con-sidered that the production process is subject to two different types of random perturbations: a vec-tor of intercepts, invariant over time, for each of the cross-sectional units (countries, in this case), and
a random component, which varies according to each country and in each time period.
The first vector contains the random effects that can be registered in production and are not under the control of the decision unit, but are inherent to the country, while the second vector includes purely stochastic factors, which are not observable in our model. Since the first component of the error term includes the specific individual effects of each pro-duction unit, depending on these individual effects being correlated or not with the observable explan-atory variables, it is possible to apply two types of estimation models with panel data: the fixed effects model (in the first case) or the random effects mod-el (in the second case).
In order to develop the process of economet-ric estimation of the stochastic frontier, the starting point will be equation (a).
(
,)
vitit it
y = f x
β
e−(a)
Where e−vit represents the entirety of random
disturbance, and which in turn, can be decomposed in expression (b). 25 1 it i i it D v e e ψ = − + − = ∑ (b)
At the same time, we will assume that
ψ
it isa random disturbance that satisfies the hypothe-sis of white noise described by the Gauss-Markov theorem.
Finally, it should be noted that the stochastic production frontier will also be considered based on the translog functional form. Therefore, the equa-tional form to be estimated will be, in this case, equation (c).
(
) (
) (
)
(
)
(
)
(
)
(
)(
) (
)(
)
(
)(
)
0 1 2 3 2 2 2 1 2 3 11 12 25 11 1 1 1 1 2 2 2 i i i it it it it i i i it it it i i i i it it it it i i it it it i i LnI LnK LnK LnH LnH LnR LnR LnK LnK LnH LnH LnR LnR LnK LnK LnH LnH LnK LnK LnR LnR LnH LnH LnR LnR Dα
β
β
β
γ
γ
γ
γ
γ
γ
ψ
λ
= = + − + − + − + + − + − + − + + − − + − − + + − − − −∑
(c)In this case, the regression will have a residue distributed into two components. The first
compo-nent will be
ψ
it, representing the randomdistur-bance of the model and –we assume– adjusting to the hypothesis of white noise. A second component will be representing the technical inefficiency part of the model, estimated including twenty-five dum-my variables, grouped in the summation of
equa-tion (c), 25 1 i i i D
λ
==
∑
; whereD
i will take the value1 when, throughout the length of the panel, we refer to country “i”, and 0 in all other cases. These dum-my variables will report on the influence that each country has on technical efficiency in the process of innovation production.
Thus, equation (d) defines the technical efficien-cy indicator for country “i”.
25 1 25 1 1 it i i i it i i i D D TE e e ψ λ ψ λ = = − + − + ∑ = = ∑ (d)
Given the methodology composition of the indi-cator, it follows that technical efficiency will range from zero (absence of efficiency or maximum in-efficiency) to one (maximum efficiency in the pro-duction of innovation). Technical efficiency will increase while estimates of the residual parameters which collect the individual effect of each country are significantly different from zero, to the extent
that estimate λi tends to increase, and vice versa.
4. Variables and data used
In order to track innovation in Europe since 2001, the European Commission (2003, 2004, 2005, 2006, 2007, 2008, 2009 and 2010) decided to publish an an-nual report (European Innovation Scoreboard) with indicators on innovation, its determinants and eco-nomic effects. Thus, this organism issues annual re-ports with thirty indicators for each member, with the availability of data ranging from 2003 to 2010. These reports draw a comparison between the differ-ent EU countries to obtain basic information on the existing levels of innovation, creativity and techno-logical progress in each country. For a more complete assessment of national competitiveness, a synthet-ic index of the fifteen-state European Union is in-cluded in the reports, which is then extended to the twenty-seven countries of the current European Un-ion, and after that, to the thirty-two countries con-stituting geographical Europe. Thus, a study on the determinants of innovation in the area of the current European Union (27 countries) will be conducted, based on the different functional forms raised in the section devoted to developing the various theoretical models. We must also add that we lack much of the Maltese data for the set of indicators and years that make up the panel used, so this country has been excluded from the empirical analysis. Therefore, this article goes on to incorporate data from the remain-ing 26 countries of the European Union.
Each of the variables to be used in this investi-gation is methodologically broken down in Table 1. While, Table 2 presents the main statistics of the variables used.
Table 1. Structure of the indicators used
Indicator Definition Source (year)
Knowledge Number of patents per million inhabitants annually recorded by
the European Patent Office (EPO) European Commission (2003 - 2010) Technological capital Average of the % of expenditure on R&D from public and private
sectors in relation to each national Gross Domestic Product (GDP) European Commission (2003 - 2010) Human capital Average between the % of graduates in the labour force and per
thousand employed people who receive ongoing training at their workplace.
European Commission (2003 - 2010) Relational capital Average between the % of SMEs developing innovation with their
own resources and the % of SMEs developing innovation in col-laboration with other companies
European Commission (2003 - 2010) Source: Own elaboration from the European Commission
Table 2. Main statistics of the variables used in the empir-ical analysis A B a b c d Mean 93.73 0.73 3.22 10.82 Median 32.80 0.63 16.10 19.85 Maximum 366.60 2.14 32.35 34.20 Minimum 0.70 0.14 3.25 5.85 SD 103.96 0.47 6.80 6.92 P-C 1.11 0.02 2.11 0.64
Explanation: A – output; B – input; a – knowledge; b – tech-nological capital; c – human capital; D – relational capital
Source: Own elaboration
Table 2 shows the considerable relative varia-bility existing within knowledge, measured by the Pearson coefficient. This variation is surpassed only by the human capital index. Secondly, it should be highlighted that the average value of the technolog-ical capital ratio is less than 1%, which was one of the targets set by the European Commission in 2010 when these reports began. Regarding relational cap-ital, it is important to stress that it presents a mod-erate dispersion, with an average value closer to the minimum than to the maximum value of this indi-cator, which suggests that inter-enterprise collabo-rative activities are scarce throughout most of the European Union.
5. Results
The following lines present the results obtained from the estimation of the theoretical approach of technical efficiency analysis in the generation of knowledge considered previously.
Bearing in mind the theoretical content of sec-tion 3.2, an empirical study will be performed, es-timating a translog production function, from the standpoint of technical efficiency with stochastic production frontiers.
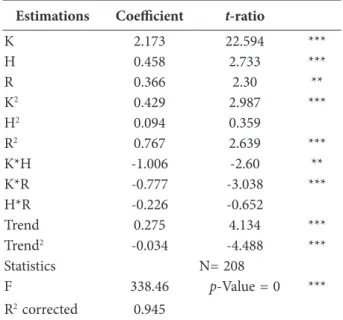
Table 3 presents the results obtained from the theoretical approach of technical efficiency specified in equation (c).
Table 3. Econometric results of the estimation of the
fron-tier of knowledge production
Estimations Coefficient t-ratio
K 2.173 22.594 *** H 0.458 2.733 *** R 0.366 2.30 ** K2 0.429 2.987 *** H2 0.094 0.359 R2 0.767 2.639 *** K*H -1.006 -2.60 ** K*R -0.777 -3.038 *** H*R -0.226 -0.652 Trend 0.275 4.134 *** Trend2 -0.034 -4.488 *** Statistics N= 208 F 338.46 p-Value = 0 *** R2 corrected 0.945
Explanation: Symbols (*), (**) and (***) refer to the signifi-cance of the variables to 10%, 5% and 1% respectively
Source: Own elaboration
Firstly, from Table 3 it is worth mentioning that it includes the relatively high first order elasticities of the inputs to the output obtained; in this order, technological capital is the factor with the greatest influence on innovation, exceeding the unit (2.17). Next, we find that human capital occupies the sec-ond place, with a significantly lower elasticity (0.46) than that obtained for technological capital. Rela-tional capital occupies the third position, with a smaller impact on innovation (0.37), although it is also a significant factor in explaining the behav-iour of innovation.
The sign of the squared regressors will inform us of the marginal rate of return of each input. In the case of technological capital, it turns out to be sig-nificantly positive, so increased public and private expenditure on R&D will lead to increases in inno-vation at a higher rate, coinciding with the elastici-ty above one. The same applies to relational capital, whose quadratic estimate is positive and statistical-ly significant.
Regarding the trend, we can say that it affects in-novation positively, but must add that the square of the trend is significantly lower than zero. This means that the increase in innovation reaches a peak over time, after which the time trend will negatively af-fect the production of innovation.
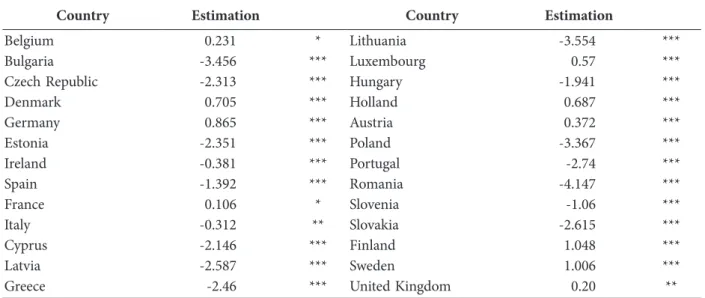
Table 4 presents the estimates of the coefficients associated with the dummy variables correspond-ing to the translog innovation production function, according to the formulation of expression (c),
ap-plying the heteroskedasticity correction methodol-ogy of White (1980).
In Table 4 we see that the individual effect of each country in terms of knowledge is very differ-ent in every country.
Table 4. Individual contribution of each country to knowledge production
Country Estimation Country Estimation
Belgium 0.231 * Lithuania -3.554 ***
Bulgaria -3.456 *** Luxembourg 0.57 ***
Czech Republic -2.313 *** Hungary -1.941 ***
Denmark 0.705 *** Holland 0.687 *** Germany 0.865 *** Austria 0.372 *** Estonia -2.351 *** Poland -3.367 *** Ireland -0.381 *** Portugal -2.74 *** Spain -1.392 *** Romania -4.147 *** France 0.106 * Slovenia -1.06 *** Italy -0.312 ** Slovakia -2.615 *** Cyprus -2.146 *** Finland 1.048 *** Latvia -2.587 *** Sweden 1.006 ***
Greece -2.46 *** United Kingdom 0.20 **
Explanation: Symbols (*), (**) and (***) refer to the significance of the variables to 10%, 5% and 1% respectively
Source: Own elaboration
Fig. 1. European Technical Efficiency
Figure 1 illustrates the ranking of technical effi-ciency in European knowledge, estimated through the stochastic frontier considered in equation (c). The results ranking obtained with the stochastic frontier is led by Sweden, Finland, Germany, Hol-land, Luxembourg and Denmark, with all of them surpassing 70% technical efficiency. The UK, Slove-nia, Spain and Hungary lie in the middle, and the classification is closed by Poland, Bulgaria, Lithua-nia and RomaLithua-nia, in that order.
6. Conclusions
From the survey conducted, we can conclude that it is important to analyse the composition and deter-minants of knowledge, as well as the degree of tech-nical efficiency in generating such knowledge. Such studies of efficiency frontiers are widely present in the literature of various sectors, such as banking, air-lines, ports, airports and agriculture, as noted in the literature review. Nevertheless, the literature on effi-ciency frontiers applied to knowledge production by European countries and regions is still very scarce.
With respect to the results, we found that the knowledge production functions yielded signifi-cant first order elasticities, with technological capi-tal having the greatest importance in the function, human capital was second and relational capital had the least influence on production knowledge, although all three factors had a significant influence.
Furthermore, adding the estimates of the first or-der parameters of the inputs with respect to output, it follows that there are economies of scale in the production of knowledge.
Regarding technical efficiency of knowledge by countries, it is noteworthy that Sweden leads the technical efficiency ratio within the estimation method of stochastic production functions. Togeth-er with Sweden, countries such as Finland, GTogeth-erma- Germa-ny, Holland, Luxembourg and Denmark are at the forefront of efficient countries; while on the other hand, Romania, Lithuania, Bulgaria and Poland are among the least efficient.
From the observation of empirical results we can state that the size (in terms of population) of a country within the European Union of the 27 does not positively influence the technical efficiency of
knowledge production. In contrast, we can observe that those countries which have joined the EU-27 most recently present lower rates of technical effi-ciency in the production of knowledge.
References
Agüeros, M., Casares, P., Coto-Millán, P. and Pesquera, M.A., 2013: A new approach on innovation and its application to European Union countries. In: Quas-tiones Geographicae, Vol. 32, 2, pp. 5-14.
Afriat, S., 1972: Efficiency estimation of production functions. In: International Economic Review, No. 13, 3, pp. 568-598. Aigner, D. and Chu, S., 1968: On estimating the indus-try production function. In: The American Economic Review, No. 54, 4, pp. 826-839.
Aigner, D., Lowell, C. and Schmidt, P., 1977: Formulation and estimation of stochastic frontier production function models. In: Journal of Econometrics, No. 6, pp. 21-37. Álvarez-Pinilla, A., del Corral, J., Pérez, J.A. and Solís,
D., 2007: Efecto de la intensificación sobre la eficien-cia de las explotaciones lecheras (Intensification ef-fect on the efficiency of dairy farms – in Spanish). In: Economía agraria y recursos naturales, Madrit, No. 7, 13, pp. 91-106.
Andrés, J. and Hueth, D., 2010: Funciones de produc-ción y eficiencia técnica en el eje cafetero colombiano: una aproximación con frontera estocástica (Produc-tion func(Produc-tions and technical efficiency in the Co-lombian coffee region: an approach using stochastic frontier – in Spanish). In: Centro de Estudios sobre de-sarrollo económico, No 21, pp. 1-33.
Badiola, A. and Coto-Millán, P., 2012: Networks and In-novation: An Economic Model for European regions (2002-2006). In: Journal of Knowledge Management, Economics and Information Technology, Vol. 5, pp. 1-22. Badiola, A., Casares, P., Coto-Millán, P. and Pesquera,
M.A., 2012: Determinants of Technical efficiency and technological innovation of European regions in the period 2002-2006. In: Journal of Business Management and Applied Economics, Vol. 5, Bucharest, pp. 1-22. Baños-Pino, J., Coto-Millán, P. and Rodríguez-Álvarez,
A., 1999: Allocative Efficiency and Overcapitalization: an Application. In: International Journal of Transport Economics, No. XXVI (2), pp. 181-199.
Battese, G.E. and Coelli, T.J., 1992: Frontier production functions, technical efficiency and panel data: with
application to paddy farmers in India. In: The Journal of Productivity Analysis, Vol. 3, pp. 153-169.
Battese, G.E. and Coelli, T.J., 1995: A model for techni-cal inefficiency effects in a stochastic frontier produc-tion funcproduc-tion for panel data. In: Empirical Economics, Vol. 20, pp. 325-332.
Cohen, W.M. and Levinthal, D.A., 1990: Absorptive ca-pacity: a new perspective on learning an innovation. In: Administrattive Science Quarterly, Vol. 35, pp. 128-152. Coto-Millán, P., Baños-Pino, J. and Rodríguez-Álvarez,
A., 2000: Economic Efficiency in Spanish Ports: some Empirical Evidence. In: Maritime Policy and Manage-ment, No. 27 (2), pp.169-174.
Coto-Millán, P., Carrera, G., Castanedo, J., Pesquera, M,A., Inglada, V. , Sainz R, and Nuñez R., 2007: Ef-ficiency Stochastic Frontiers: a Panel Data Analysis for Spanish Airports (1992-1994). In: Coto Millán P. and Inglada, V. editors, Essays on Transport Econom-ics. New York: Physica-Verlag HD, pp. 121-126. Coto-Millán, P., Casares, P., Pesquera, M,A, and De
Castro P., 2011: Serempathy: A new approach to in-novation. Application to forty-six regions of Atlantic Arc countries. In: Journal of Knowledge, Economic, In-formation and Technology, Issue 6, October, pp. 1-26. European Commission, 2010: European Innovation
Scoreboard, 2003-2010. Brussels: European Union. Farrel, M.J., 1957: The measurement of productive
ef-ficiency. In: Journal of the Royal Statistical Society, No. 120, 3, pp. 253-290.
Fodi, M., Marrocu, E., Puci, and Usai R., 2013: Knowl-edge and regional performance. In: KIT: KnowlKnowl-edge, Innovation, Territory, Applied Research2013/1/13, Draft Final Report, Chapter 3, Vol. 1, Brussels: Euro-pean Union, pp. 40-77.
Greene, W., 1980: Maximum Likelihood estimation of econometric frontier functions. In: Journal of Econo-metrics, No. 13, pp. 27-56.
Griliches, Z., 1979: Issues in assessing the contribution of research and development to productivity growth. In: The Bell Journal of Economics, Vol. 10, pp. 92-116. Jaffe, A.B., 1986: Technological Opportunity and Spill-overs of R&D: evidence from Firms, Patents , Prof-its and Market Value. In: American Economic Review, Vol. 76, pp. 984-1001.
Jaffe, A.B., 1989: Real Effects of Academic Research. In: American Economic Review, Vol. 79, pp. 957-970. Lozano, S. and Gutierrez, E., 2011: Efficiency analysis
and Target Setting of Spanish Airports. In: Networks and Spatial Economics, Vol. 11, pp. 139-157.
Marrocu, R., Paci, R. and Usai, S., 2011a: Proximity, networks and Knowledge production in Europe, WP, CRENOS, 2011/9, Sardinia: Centre for North South Economic Research.
Marrocu, R., Paci, R. and Usai, S., 2011b: The comple-mentary effects of proximity dimensions on knowl-edge spillovers, WP, CRENOS, 2011/9, Sardinia: Centre for North South Economic Research.
Moreuno, R., Paci, R. and Usai, S., 2005: Spatial spillo-vers and innovation activity in European Regions. In: Environment and Planning A, Vol. 37, pp.1793-1812. Meeusen, W. and Van Den Broeck, J., 1977: Efficiency
estimation from Cobb-Douglas production functions with composed error. In: International Economic Re-view, No. 18, 2, pp. 435- 444.
Miguelez, E., Moreano, R. and Surinach, J., 2013: Knowledge spillovers and regional knowledge crea-tion. In: KIT: Knowledge, Innovation, Territory, Applied Research 2013/1/13, Draft Final Report, Chapter 5, Vol. 1, Brussels: European Union, pp. 128-166. Ponds, R., van Oort, F. and Frenken, K., 2010:
Inno-vation, spillovers and university-industry collabora-tion: an extended knowledge production function approach. In: Journal of Economic Geography, Vol. 10, pp. 231-255.
Schmidt, P. and Sickles, R., 1984: Production frontiers and panel data. In: Journal of Business and Economic Statistics, Vol. 2, 4, pp. 367-374.
Pires, J. and García, F., 2004: Productivity of nations: a stochastic frontier approach to TPF descomposition. In: Escola de Economia de Sao Paulo, da Fundaçao Getulio Vargas,No. 14, pp. 1- 39.
Rodríguez-Álvarez, A., Tovar B, and Trujillo, L., 2007: Firm and time varying technical and allocative effi-ciency: An application to port cargo handling firms. In: International Journal of Production Economics, No. 109, pp. 146-161.
Tapiador, F. J., Mateos, A. and Martí-Henneberg, J., 2008: The geographical efficiency of Spain’s region-al airports: A quantitative anregion-alysis. In: Journregion-al of Air Transport Management, Vol. 14, pp.205-212.
White, H., 1980: A heteroskedasticity- consistent covari-ance matrix estimator and a direct test for heteroske-dasticity. In: Econometrica, No. 48, 4, pp. 817-838. Wold, H., 1938: A Study in the analysis of stationary
time series. (2nd ed 1954, with appendix by P. Whit-tle), Stockholm: Almqvist and Wiksell.