www.medigraphic.org.mx
Factorial analysis of sagittal cephalometric
measurements of the upper airways
Análisis factorial de las mediciones cefalométricas
sagitales de las vías aéreas superiores
Adrián Luna-Godoy,* Luis Cruz-Chávez,§ Ofelia Rodríguez-Anaya,|| Diana Montoya-Guzmán,¶ Sergio Sánchez-García,** Fernando Ángeles-Medina,§§Jacqueline Rodríguez-Chávez,|| || Luis Pablo Cruz-Hervert|| ||,¶¶
* Student of the Orthodontics Specialty, Odontology Faculty, Division of Post-Graduate Studies and Research of the Odontology Faculty, UNAM
§ Professor of the Orthodontics Specialty, Odontology Faculty, Division of Post-Graduate Studies and Research of the Odontology Faculty, UNAM.
|| Professor of the Orthodontics Department, UNITEC, México. ¶ Professor of the Orthodontics Department, Fundación UNICIEO,
Bogotá, Colombia.
** Chief of the Research Unit of Epidemiology and Health Services, Aging Area, Siglo XXI National Medical Center. IMSS.
§§ Physiology Laboratory, DEPeI, UNAM, Mexico.
|| || Professor of the Orthodontics Department, Universidad Autónoma de Guadalajara, Mexico.
¶¶ Center of Research on Infectious Diseases, National Institute of Public Health, Mexico.
© 2018 Universidad Nacional Autónoma de México, [Facultad de Odontología]. This is an open access article under the CC BY-NC-ND license (http://creativecommons.org/licenses/by-nc-nd/4.0/). This article can be read in its full version in the following page: http://www.medigraphic.com/ortodoncia
RESUMEN
Existen diferentes medidas cefalométricas para evaluar las dimen-siones de las vías aéreas superiores a partir del uso de la radiogra-fía lateral de cráneo. Se desconoce qué características o factores de las vías aéreas son identifi cables y posibles de estudiar a partir de las mediciones disponibles y cuáles son las mediciones más úti-les para dicho fi n. Objetivo: Identifi car los factores de las medicio-nes de las vías aéreas superiores y determinar su asociación a las dimensiones craneofaciales. Material y métodos: Estudio transver-sal. Analizamos las radiografías laterales y realizamos un análisis factorial principal para las mediciones de las vías respiratorias su-periores: N-S-Ba, Ba-S-PNS, AD1, AD2, PTV a adenoides (DPTV) y Airway% (A%). Resultados: Analizamos 151 registros, sin trata-miento de ortodoncia previo ni síndrome craneofacial. Identifi camos dos factores principales: el factor 1 (F1) incluye AD1, AD2, DPTV y A%, y el factor 2 (F2) incluye N-S-Ba y Ba-S-ENP. Conclusiones: F1 se relacionó con las dimensiones lineales y F2 con las caracte-rísticas estructurales.
Key words: Upper airways, cephalometrics, factorial analysis. Palabras clave: Vías aéreas, cefalometría, análisis factorial. ABSTRACT
There are different cephalometric measurements to evaluate the dimensions of the upper airways using a lateral headfilm. It is unknown how many characteristics are possible to study from the available measurements and which are the most useful measurements for this purpose. Objective: To identify factors of measurement of the upper airways and determine their association to craniofacial dimensions. Material and methods: Cross-sectional study. We analyzed lateral headfilms and performed a principal factor analysis for upper airways measurements: N-S-Ba, Ba-S-PNS, AD1, AD2, PTV to Adenoid (DPTV) and Airway % (A%).
Results: We analyzed 151 records, without previous orthodontic
treatment or craniofacial syndrome. We identified two principal factors: Factor 1 (F1) includes AD1, AD2, DPTV and A%, and factor 2 (F2) includes Na-S-Ba and Ba-S-PNE. Conclusions: F1 was related to linear dimensions and F2 to structural characteristics. Vol. 6, No. 2 April-June 2018
pp 72-77
Revista Mexicana de Ortodoncia
ORIGINAL RESEARCH
INTRODUCTION
In recent years, the importance of upper airway analysis and its relationship with the development of the craniofacial structures has been taken up again. This was first reported in the 1970s1 when the most commonly used analyses were developed for this purpose. Some authors have reported the usefulness of the McNamara2 and Linder-Aronson1,3,4 analyses for the study of airways and have even reported an association between a reduced airway and a reduced maxillomandibular structure. Other authors have developed and proposed the use of other cephalometric measurements, using skull base structures or the Pterygoid vertical,5,6 or even a percentage of airways,7,8 which have also demonstrated their diagnostic usefulness. However, given the wide variety of cephalometric measurements
www.medigraphic.org.mx
available, there is no consensus or clinical protocol for the systematic evaluation of upper airways. There is also a lack of consensus among specialists on the usefulness of the different airway measurements and on the information that each of them will provide, as well as on whether it is necessary to assess all the available measurements to have more diagnostic elements or whether it is possible to achieve an integral analysis of the upper airway with just a few cephalometric characteristics.
On the other hand, factor or common factor analysis is a statistical procedure for data reduction.9,10 Its purpose is to group the study variables into one or more sets of homogeneous variables, that is to say that in some way they measure the same characteristic. As far as we know, we have not identifi ed any studies that have evaluated the diversity or similarity of the characteristics or factors measured by each of the different cephalometric measurements of the airways. Therefore, this study aims to identify how many characteristics or factors of the airways exist based on the characteristics that the different cephalometric analyses measure.
MATERIAL AND METHODS
We conducted a retrolective cross-sectional study, given that this research is a secondary analysis of the information obtained from a study performed in 2013,11 in which we analyzed cephalometric information in relation to the airways and other characteristics of the craniofacial dimensions of patients who were treated at the Orthodontics Clinic of the Post-Graduate and Research Division (DEPeI) of the Faculty of Odontology (FO) of the National Autonomous University of Mexico (UNAM) during the period 2010-2011. The original clinical information was obtained from the clinical records and the cephalometric information was obtained from the cephalometric tracings of lateral headfilms prior to the beginning of orthodontic treatment. It should be noted that all the information was available in the archives of the Orthodontics Clinic. The sample selection method was by convenience. The inclusion criteria in the original study were as follows: 1) patients between the ages of 10 and 18, 2) both genders, 3) signed informed consent of acceptance of orthodontic treatment by a parent or guardian, 4) clinical history and 5) lateral headiflm. The following exclusion criteria were established in the original study: 1) the diagnosis or antecedent suggestive of the presence of any craniofacial syndrome, 2) any alteration or deformation of the X-ray that prevented proper identification of
the anatomical structures necessary to perform the cephalometric tracing, 3) patients with congenital absence of teeth or presence of included or impacted teeth, 4) presence of supernumerary teeth, and 5) the antecedent in the medical history, in the photos or in the initial x-ray suggestive of any previous treatment of orthodontics or orthopedics. The sample selection method used was by convenience.
Data collection
Since the study was a secondary analysis of information from a previous study, clinical and cephalometric information was already available. The original cephalometric information was obtained using the JOE 32 cephalometric tracing software. The tracing was performed by an orthodontic specialist with over 30 years of clinical experience (LCC). Intra-operator reliability was evaluated using an interclass correlation coeffi cient and the values were above 85% (which is considered almost perfect). The values obtained were calculated from an independent sample of 15 lateral radiographs, plotted on two occasions spaced at least two months apart between measurements.
Variable defi nition
The variables used for this study and their defi nitions are described in table I.
Sample size
According to MacCallum et al.,12 with a sample of at least 100 participants it is possible to have a statistical power of more than 80% and to obtain valid results from the factor analysis independently of the community of the variables or from the overestimation of factors. Since the sample was already defi ned, by including the information from the 151 individuals in the original sample we can obtain valid results for our factor analysis.
Statistical analysis
We performed a descriptive analysis of the cephalometric variables. For which we calculated the mean, standard deviation (SD), median, interquartile range, bias, kurtosis and evaluated the normality of each of the variables. We performed an exploratory factor analysis, which involves a series of previously structured and described steps.9,10 First, we calculated a correlation matrix for all variables associated with Upper Airway (UA) assessment and then we performed
www.medigraphic.org.mx
Este documento es elaborado por Medigraphic
a factor analysis including all those related to the UA analysis. The eigenvalues are estimated values for each characteristic or factor of the airways in which the cephalometric variables are grouped; factors with an eigenvalue greater than 1 are considered as characteristics or factors that are identifiable by one or more cephalometric variables, the higher the eigenvalue the more consistently the characteristic is defined. Subsequently, we performed a varimax orthogonal rotation and reported the correlation of factors, as well as the weights and uniqueness of variances. The weight of each variable within each factor represents the importance of each variable within its factor, the greater the value of the weight the greater the infl uence within the factor assessed. We estimated the predicted values for each of the defi ned factors; the estimated values for each individual represent a value that the greater the value the more related it is to the determined factor. In addition, we performed the Kaiser-Meyer-Olkin (KMO) test, which measures the suitability of the data for factor analysis.
RESULTS
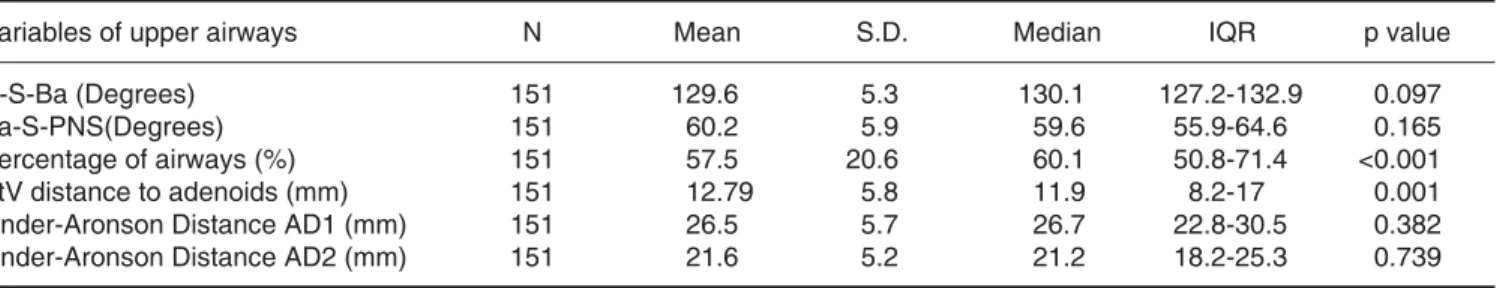
A total of 151 lateral headfi lms were studied. The mean age of the study population was 14.4 years with a standard deviation (SD) of 7.9 years. 56.5% of the sample was women. With regard to the cephalometric variables of the airways, the Ba-S-PNS and N-S-Ba angle, as well as the AD1 and AD2 measurements, were found to have a normal distribution, in contrast to what was observed with the percentage of airways (%) and PtV distance to adenoids (mm) as described in table II.
Table III describes the matrix correlation between all
variables associated with airway analysis. In relation to the N-S-Ba and Ba-S-PNS angles, a strong correlation was observed between the N-S-Ba and Ba-S-PNS angles (Pearson correlation coeffi cient [CCS] = 0.664, p < 0.001), and a slight but significant correlation between the N-S-Ba angle and the percentage of airways (Spearman correlation coefficient [SPC] = -0.160, p < 0.05). The same applies to the association
Table I. Defi nition of cephalometric variables.
Area Cephalometric measurement Defi nition
Airway Linder-Aronson Distance AD1 (mm) Distance from the Posterior Nasal Spine point (PNS) to the nearest adenoid tissue measured over the line of the Posterior Nasal Spine point to Basion point
Airway Linder-Aronson Distance AD2 (mm) Distance from the Posterior Nasal Spine point (NSP) to the nearest adenoid tissue measured on the perpendicular line from the Sella point to Basion point
Airway N-S-Ba (Degrees) Angle formed by the cephalometric points Nasion (N), Sella (S), and Basion (Ba)
Airway Ba-S-ENP (Degrees) Angle formed by the cephalometric points Basion (Ba), Sella (S), and Posterior Nasal Spine (PNS)
Airway Airway percentage (%) The nasopharyngeal area is obtained by measuring the polygon formed by the Nasion-Basion, Posterior Nasal Spine-Basion and Sella-Ramus intersection lines and airway
Airway PtV Distance to adenoids (mm) The shortest distance from a point located on the Vertical Ptery-goid Plane (PtV), 5 mm above the Posterior Nasal Spine point to the adenoid tissue
Table II. Clinical characteristics of the study sample.
Variables of upper airways N Mean S.D. Median IQR p value
N-S-Ba (Degrees) 151 129.6 5.3 130.1 127.2-132.9 0.097
Ba-S-PNS(Degrees) 151 60.2 5.9 59.6 55.9-64.6 0.165
Percentage of airways (%) 151 57.5 20.6 60.1 50.8-71.4 <0.001 PtV distance to adenoids (mm) 151 12.79 5.8 11.9 8.2-17 0.001 Linder-Aronson Distance AD1 (mm) 151 26.5 5.7 26.7 22.8-30.5 0.382 Linder-Aronson Distance AD2 (mm) 151 21.6 5.2 21.2 18.2-25.3 0.739
www.medigraphic.org.mx
between the Ba-S-PNS angle and the distances AD1 (CPC 0.273, p < 0.05) and AD2 (CPC 0.177, p < 0.05). In contrast, linear or percentage measurements had a better correlation between them, with statistically signifi cant correlation values (p < 0.005) and with a range of correlation coeffi cients between 0.403 and 0.783, which represent a medium to high correlation.
According to the estimated eigenvalues from the rotation of the Varimax type matrix, it was possible to identify that only two factors had values greater than 1.0. As shown in table IV, the value of the proportion of which Factor 1 explains 65.9% of the airway characteristics measured by the variables included in the analysis. In contrast, Factor 2 accounts for 35.0% of airway characteristics.
Table V describes the distribution of cephalometric
variables associated with the airways based on their loading values. In the table, only loading values greater than 0.30 are reported. Based on these results it is possible to identify that Factor 1 was formed by the percentage of airways, PtV-A distance, AD1 and AD2. While Factor 2, was formed from the angles N-S-Ba and N-S-Ba-S-PNS. N-S-Based on this statistical grouping, it is possible to identify that Factor 1 is associated with the dimension of the upper airways, specifi cally the nasopharynx and oropharynx, while Factor 2 describes the characteristics of the upper airways in relation to the structures of the skull base. Also, based on the loading values, it is possible to identify which cephalometric variable influences the most within its factor. In other words, for Factor 1, the variables with the greatest and least infl uence are AD2, PTV-A Distance, AD1 and Percentage of airways. For Factor 2, the variable with the greatest influence was the Ba-S-PNS angle followed by the N-S-Ba angle. Additionally, we report the value of the Uniqueness of the variance, where the maximum theoretical value is 1.0 and the minimum 0.0, which can be interpreted as the ability of a variable to explain a general characteristic of the airways that is not explained by
another variable, without considering or being related to the factors previously described.
The results of the Kaiser-Meyer-Olkin (KMO) test, which measures the suitability of data for factor analysis, show an overall value of 0.607; suitability values between 0.6 and 0.7 are considered acceptable. The internal consistency value was 0.586, which according to the Cronbach alpha value is considered with low intermeasurement reliability.
DISCUSSION
Based on the results of our study it is possible to identify that there are two sagittal cephalometric
Table III. Results of the correlation analysis between the variables associated with the airways.
Upper airway variables
N-S-Ba (degrees) Ba-S-PNS (degrees) % airway (%) PtV-A (mm) AD1 (mm) AD2 (mm) N-S-Ba (degrees) 1 Ba-S-PNS (degrees) 0.664‡ 1 % airways (%) -0.160* -0.020 1 PtV-A adenoids (mm) -0.02 -0.105 0.403‡ 1 AD1 (mm) -0.021 0.273‡ 0.520‡ 0.494‡ 1 AD2 (mm) -0.025 0.177* 0.538‡ 0.764‡ 0.783‡ 1 * = p < 0.005, p < 0.01, ‡ = p < 0.001.
Table IV. Description of the factors in which the variables
of the UA are grouped in relation to their eigenvalues. Factors or
dimensions Eigenvalue Difference Proportion
Accumu-lated proportion Factor 1 2.45 1.15 0.659 0.659 Factor 2 1.30 0.99 0.350 1.001 Factor 3 0.31 ---- 0.083 1.092
Table V. Description of the factors in relation to the loading
values and variance incidence.
Variable Factor 1 Factor 2 Uniqueness N-S-Ba (degrees) NR* 0.761 0.387 Ba-S-ENP (degrees) NR* 0.822 0.287 % airways 0.574 NR* 0.618 PtVD-A (mm) 0.792 NR* 0.258 AD1 (mm) 0.777 NR* 0.273 AD2 (mm) 0.939 NR* 0.111
www.medigraphic.org.mx
c h a r a c t e r i s t i c s t h a t a r e a n a l y z e d f r o m t h e cephalometric variables used in the study. The fi rst one according to our data is related to linear measurements or to the percentage of the upper airways, specifi cally the nasopharynx and oropharynx, so it could be called the «dimensional factor of the airways». Whereas the second factor, from our perspective, explains a relationship between the upper airways in relation to the structures of the skull base, so it could be called the «structural factor of the airways». From our perspective, the results can be compatible with a construct validity, i.e. the grouping of the factors agree with the original intention with which the authors of each measurement set as objective.
To our knowledge, there is no previous study with this approach. However, there are different studies that have evaluated the association between the airways using different cephalometric measurements with different conceptual approaches. According to our results, the «airway dimensional factor» or Factor 1, is formed by: the percentage of airways, the PtV-A distance, AD1 and AD2. Likewise, the intention of cephalometric variables is to determine the distance between the posterior and anterior wall of the pharynx at some point, which has been related as a potential indicator of space for air passage as reported by other authors.1,3-8,13 Similarly, the analysis of Linder-Aronson,1,3,4 with their measurements AD1 and AD2 were proposed to measure the dimensions for the passage of air at the nasopharynx level. In the same vein, Schulhof8 developed the analysis of the percentage of the nasopharynx occupied by adenoid tissue as a measure to suggest the level of obstruction or decrease in the dimensions of the pharyngeal space.
It is possible to identify that the percentage of airways alone explains one characteristic and the one that solely describes at least one characteristic is AD2. This does not mean that AD2 has less relevance compared to airway percentage, but only that AD2 measures one characteristic in common with the other variables and in contrast the airway percentage measures another different characteristic without this representing another factor independent of the two previously described. Our results are in the same sense as those described by Poole et al,14 who reported that the airway percentage, AD1, AD2 and PtV were statistically more signifi cant than other measures to determine the need for adenoidectomy, as they suggest a dimension of the pharyngeal space. With regard to the «structural factor of the airways» or Factor 2, it is worth mentioning that it is formed by angular measurements. Handelman and
Osborne7 used the Ba-S-PNS angle to determine the nasopharyngeal area and their results have been confi rmed by other studies.13,15,16 However, the suggestion to use the Ba-S-N skull base angle comes from a study in hominids.17
AD2 distance and Pterygoid to Adenoid distance (PtV-A) are the most clinically useful cephalometric measurements to assess the «airway dimensional factor». The results of our studies are consistent with those of other authors such as Poole et al,14 and specifi cally with those reported by De Vasconcellos et al3 and Montejano et al,18 who reported that the clinical utility for airway evaluation is greater for AD2 than for AD1. In contrast, there are no studies evaluating the overall usefulness of the Ba-S-PNS and Ba-S-N angular measurements, which conform the «structural factor of the airways». However, other studies13,15,16 report that the Ba-S-PNS angle correlates with the airway space, while the Ba-S-N angle is originally considered as a measure to evaluate the morphology of the skull base structure.
It is worth mentioning that although the measurement of the Percentage of the upper airways was identifi ed with the highest value of uniqueness of variance, it does not represent or suggest the existence of another factor, but rather the characteristic it explains is determined within the two factors identifi ed, although it is the measurement that is generally correlated with the other airway measurements used for this study.
Strengths and limitations
Since the methodology of our study was cross-sectional, the results are subject to the biases of the methodology used.19 The selection bias is one of the main limitations, since the study population represents only the population requesting orthodontic treatment in the Department of Orthodontics of the DEPeI of the UNAM, so that the characteristics associated with airway variables may be altered more frequently or intensely in the study sample than in the open population. However, the nature of this bias is not different among the participants, that is to say that all participants would have the same altered airway dimensions and the results of this study go in the same direction as reported by other studies that evaluate the association between airway dimensions and the development of the maxillofacial complex in patients who come for orthodontic treatment. For reasons related to the software license it was not possible to include the measurements from McNamara’s airway analysis, which may have helped to increase the value of the data suitability test and increase the reliability of
www.medigraphic.org.mx
intermediate data, at least for the «airway dimensional factor».
One of the main strengths of the study is the sample size, as it exceeds the minimum sample size required to perform this analysis. Another strength is that the source of the data proved to have excellent reliability, as all cephalometric measurements were performed by an orthodontic specialist with excellent intra-operative reliability value, which reduces the possibility of measurement bias (this is not reported in most previous studies). At present, three-dimensional analyses to measure the volume of the airways are already available. They were not contemplated but could represent an additional dimension to the factors identifi ed in our study.
CONCLUSIONS
Based on the lateral headfi lm measurements used to assess the airways, it is possible to identify two large fi elds of study of the airways: the dimensional factor and the structural factor.
It was also possible to identify that AD2 and the PtV-A distance are the most useful for the evaluation of the dimensional factor of the airways, while the Ba-S-PNS angle is the most important measurement to evaluate the structural factor of the upper airways. It is necessary to evaluate if the information from the current volumetric analysis of the airways, represents another dimension by itself or could be related to any of the factors previously described in our study.
REFERENCES
1. Linder-Aronson S. Adenoids. Their effect on mode of breathing and nasal airfl ow and their relationship to characteristics of the facial skeleton and the denition. A biometric, rhino-manometric and cephalometro-radiographic study on children with and without adenoids. Acta Otolaryngol Suppl. 1970; 265: 1-132. 2. McNamara JA Jr. A method of cephalometric evaluation. Am J
Orthod. 1984; 86 (6): 449-469.
3. Vilella OV, Vilella BS, Karsten A, Ianni-Filho D, Monteiro AA, Koch HA et al. Evaluation of the nasopharyngeal free
airway space based on lateral cephalometric radiographs and endoscopy. Orthodontics. 2004; 1 (3): 215-223.
4. Linder-Aronson S. Respiratory function in relation to facial morphology and the dentition. Br J Orthod. 1979; 6 (2): 59-71. 5. Ricketts RM. The cranial base and soft structures in cleft palate
speech and breathing. Plast Reconstr Surg. 1954; 14 (1): 47-61. 6. Ricketts RM. Respiratory obstruction syndrome. Am J Orthod.
1968; 54 (7): 495-507.
7. Handelman CS, Osborne G. Growth of the nasopharynx and adenoid development from one to eighteeen years. Angle Orthod. 1976; 46 (3): 243-259.
8. Schulhof RJ. Consideration of airway in orthodontics. J Clin Orthod. 1978; 12 (6): 440-444.
9. Lloret-Segura S, Ferreres-Traver A, Hernández-Baeza A, Tomás-Marco I. El análisis factorial exploratorio de los ítems: una guía práctica, revisada y actualizada. Anal Psicol. 2014; 30 (3): 1151-1169.
10. Pérez EM, Medrano L. Análisis factorial exploratorio: bases conceptuales y metodológicas. RACC. 2010; 2 (1): 58-66. 11. Sotelo-Osuna YM C-HL, Cruz-Chávez L. Frecuencia de valores
cefalométrico asociados al síndrome de APNEA del sueño en pacientes del departamento de ortodoncia de la DEPeI de la UNAM: Universidad Nacional Autónoma de México; 2013. 12. MacCallum RC, Widaman KF, Zhang S, Hong S. Sample size in
factor analysis. Psychological Methods. 1999; 4: 84-99.
13. Solow B, Siersbaek-Nielsen S, Greve E. Airway adequacy, head posture, and craniofacial morphology. Am J Orthod. 1984; 86 (3): 214-223.
14. Poole MN, Engel GA, Chaconas SJ. Nasopharyngeal cephalometrics. Oral Surg Oral Med Oral Pathol. 1980; 49 (3): 266-271.
15. Kluemper GT, Vig PS, Vig KW. Nasorespiratory characteristics and craniofacial morphology. Eur J Orthod. 1995; 17 (6): 491-495.
16. Solow B, Sandham A. Cranio-cervical posture: a factor in the development and function of the dentofacial structures. Eur J Orthod. 2002; 24 (5): 447-456.
17. Laitman JT, Heimbuch RC. The basicranium of Plio-Pleistocene hominids as an indicator of their upper respiratory systems. Am J Phys Anthropol. 1982; 59 (3): 323-343.
18. Montejano-Chavarria S, Cruz-Chávez L, Cruz-Hervert LP. Association between Linder-Aronson measurements and craniofacial structures dimensions. 2016 Annual Meeting of American Association of Orthodontics; Orlando, Florida, United States of America 2016.
19. Hernández-Ávila M, Garrido-Latorre M, López Moreno S. Diseño de estudios epidemiológicos. Salud Publica Mex. 2000; 42 (2): 144-154.
Mailing address:
Luis Pablo Cruz-Hervert