Magnetic Properties of Highly Textured Fe85Ga15
17
0
0
Texto completo
(2) https://cimav.repositorioinstitucional.mx/jspui/ including metastable equilibrium conditions among the disordered A2 and an ordered B2 and/or DO3 structure [10]. The smart material galfenol (Fe100−xGax with 15 ≤ x ≤ 28) offers a unique combination of mechanical and magnetostrictive properties that are expected to be used in sensor and actuator as an alternative and cheaper solution compared with rare earth-based magnetostrictive systems with poor mechanical properties and higher magnetic field required for saturation. The magnetostrictive properties of these alloys were already studied intensively by many research groups. However, for industrial applications, the frequency-dependent hysteresis properties are of great importance. In our previous work, we have reported a detailed investigation of the frequency dependence of the coercivity and losses analyzing hysteresis loops measured at different frequencies on ringshaped samples [11]. In this paper, we present magnetostriction measurements performed on these ring-shaped samples, in two different directions: 1) radial and 2) perpendicular to the radius of the ring due to the presence of strong textures. Based on these determined textures, the magnetic anisotropy and magnetostriction were calculated and were compared with experimental data. Experimental setup High purity iron (99.99%) and gallium (99.999%) were weighted stoichiometrically with an excess of 5 at% of Ga. The elements were melted three times in an induction furnace under argon atmosphere using a water cooled Cu crucible. Finally, four ingots were put together and remelted in a bigger water cooled Cu crucible (Hukin-Tiegel). 2.
(3) https://cimav.repositorioinstitucional.mx/jspui/ under the same conditions. From this master alloy (sample MA), cylindrical discs were machined and then two rings were cut out. These two rings together with Tantal foil as oxygen getter material were each sealed in an argon atmosphere quartz ampoule under pressure of 150 mbar. Both samples were heat treated at T = 980 °C for 100 h, however, one sample was quenched in cold water (sample Q), while the other was slowly cooled in the oven (sample SC). The X-ray diffraction (XRD) measurements were performed using CuKα radiation in a Bragg-Brentano geometry. The evaluation of the data was performed using TOPAS 4.2 (Bruker AXS) software package. Magnetization measurements were performed using a standard pulsed field magnetometer (maximum field of 50 kOe). The temperature dependence of the resistivity between 25 and 290 K was measured using a four point probe method. In general, the existence of the internal stress reflects in the value of the specific electrical resistivity at low temperature and is almost independent at higher temperatures. The magnetostriction measurements were performed with standard strain gauge method using a pulsed magnetic field magnetometer setup, which is described in more detail in [12] and [13]. The longitudinal and transverse magnetostriction were measured in two different directions: 1) radial and 2) perpendicular to the radius of the ring due to the presence of strong textures in the ring-shaped samples. Result All Fe85Ga15 samples were single phased, crystallizing in the Im3m space group with an average lattice constant of a = 2.904 Å exhibiting a disordered bcc A2 structure (Fig. 1).. 3.
(4) https://cimav.repositorioinstitucional.mx/jspui/. All estimated standard deviations are below 0.0005 Å. The Q and the SC samples were measured with and without rotation of the sample holder, however, no big difference was observed. The as cast sample (MA) was first measured in bulk. In addition, sample MA was rasped in liquid nitrogen (T = 77 K) in order to make a powder avoiding any heating effects of the filing process. Both XRD measurements of the as cast sample revealed no difference in structure, texture, stress, and strain. Applying an intensity analysis on the XRD lines, the average texture and the crystallite size of the samples were determined. In Table I, the results of the Rietveld refinements are presented. In addition, a SEM investigation was performed to confirm the stoichiometry. 4.
(5) https://cimav.repositorioinstitucional.mx/jspui/ The XRD crystallite size of sample MA is quite small, about 34 nm. This can be explained by the strong disorder of the Fe with the Ga atoms, which is also reflected by the big Gaussian strain inside the sample. This comes mainly due to the fact that this sample was simply melted four times and then Q in the cold Cu crucible, so no ordering inside the sample occurred and the coherence length is very small. After the annealing process, a significant increase of the crystallite size of the samples was obtained. The average values of crystallites are 1 and 2.5 μm for samples Q and SC, respectively. Fig. 2 shows the microstructure of the annealed ring-shaped samples. As can be seen, the mean particle size is ∼400 μm for both annealed samples and much bigger than the crystallite sizes obtained by XRD. After the annealing process of the samples, the. crystallite size increases to quite huge values, which can be understood as an ordering due to diffusion processes inside the sample (in contrast to the strong disorder of Fe and Ga in the MA sample).. 5.
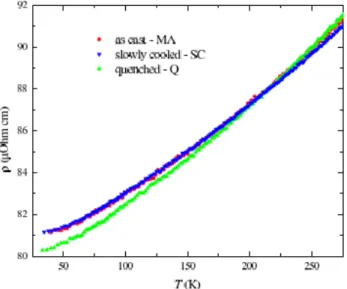
(6) https://cimav.repositorioinstitucional.mx/jspui/. In addition, the XRD patterns of the annealed samples indicated the existence of strong textures. From the Rietveld refinement, we found textures (110) in sample Q and (112) in sample SC. These textures were determined along the flat parallel surface, perpendicular to the rotational axis of the rings. We found also a strong internal stress in MA sample. With a heat treatment of the sample, the stress is partially relieved in the sample SC and became negligible in the sample Q. The Rietveld refinement data are given in Table I. Fig. 3 shows the specific electrical resistivity measured between 25 and 290 K. As can be seen in this picture, the resistivity at low temperatures of samples MA and SC is larger than that of sample Q, however, at higher temperatures, all three samples exhibit similar values of the resistivity. The excessive resistivity in samples MA and SC at low temperatures may be ascribed to the scattering of electrons by structural defects due to presence of the internal stress forming during the production of the material. These results are consistent with those results obtained from the Rietveld refinement. In 6.
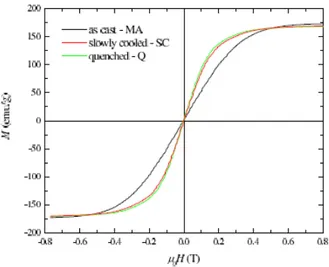
(7) https://cimav.repositorioinstitucional.mx/jspui/ general, at high temperatures, the resistivity depends mainly on phonon scattering, therefore, we found similar values of resistivity for all samples once they present similar lattice symmetry.. Fig. 4 shows the magnetization as a function of the applied field curves measured at room temperature on Fe85Ga15 in the pulsed field system. The magnetization of saturation value of all three samples is ∼170 emu/g. For the annealed samples, the external field was applied parallel to the surface of the ring-shaped. samples, which the demagnetizing factor for these samples is lower than that of MA sample, which exhibits an irregular shape. As the XRD analysis has revealed strong textures in the annealed samples (Table I), the effect of these textures on the magnetocrystalline anisotropy and magnetostriction was investigated. The magnetic anisotropy of Fe85Ga15 was determined using a general formula for a cubic system as follows [14]:. 7.
(8) https://cimav.repositorioinstitucional.mx/jspui/. where the αi are the direction cosines, defined as. with the inclination angle θ and azimuth angle φ of the spherical coordinate system (with radius of 1). K1 and K2 are the first- and second-order cubic anisotropy constants. For defining K1 and K2, we interpolated the data of [15]. With these values of K1 = 4.0 × 10⁴ J/m3 and K2 = −9.0 × 10⁴ J/m3 and the texture information obtained from the XRD data, a cut through the calculated anisotropy energy EA(θ, φ) (Fig. 5) was performed along the (112), (110), and (031) planes. In Fig. 6, the three cuts are plotted against an arbitrary parametrization angle β. The averaged value of these planes can be seen in Table II. For estimating the mean polycrstalline anisotropy energy, simply a volume average over EA(θ, φ) was made.. 8.
(9) https://cimav.repositorioinstitucional.mx/jspui/. The average values of EA for the samples Q and SC, EA(Q) and EA(SC), were calculated using the texture degree determined from XRD measurements (Table I) according to EA(Q) = 0.75·EA(110) + 0.25·EApoly = 7.0 kJ/m3 and EA(SC) = 0.74·EA(112) + 0.15·EA(031) + 0.11·EApoly = 7.4 kJ/m3. The averaged magnetic anisotropy value of sample SC is ∼6% higher than that of sample Q. These results agree with. magnetization measurements, where a steeper slope of the magnetization curve is obtained for sample Q. As the magnetization measurement shows an average over all 9.
(10) https://cimav.repositorioinstitucional.mx/jspui/ crystallites of the sample, one can compare our calculation of the anisotropy with the average magnetic behavior.. 10.
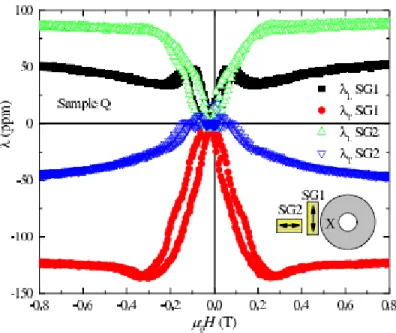
(11) https://cimav.repositorioinstitucional.mx/jspui/ Fig. 7 shows the longitudinal λL, as well as the transversal λT magnetostriction measured on sample MA at room temperature. The magnetostriction is typical for isotropic polycrystalline ferromagnetic materials, where the relation λL = −2λT is almost obeyed. This result is in agreement with that of the XRD experiment showing no texture in this sample.. The longitudinal and transverse magnetostriction measurements performed on annealed samples SC and Q samples are shown in Figs. 8 and 9, respectively. The magnetostriction was measured applying strain gauges in two different arrangements: 1) λL along the across the ring circumference, SG1 and 2) along the radius of the rings, SG2 (Fig. 8). It can be seen that the presence of hole in the middle of the samples has caused a different demagnetizing field for the two strain gauges SG1 and SG2, therefore, the beginning of the saturation of the longitudinal magnetostriction happens at magnetic fields different to that of the beginning of transverse magnetostriction 11.
(12) https://cimav.repositorioinstitucional.mx/jspui/ saturation. In addition, this hole together with annealing of the ring samples have induced appearance of textures making the materials magnetically anisotropic. This effect is also clear in magnetostriction measurements where different results for the two different arrangements (although the effect is bigger in sample Q, the magnetostriction measured with SG1 arrangement is smaller than those measured with SG2 geometry) were found and the λL is different to −2λT. It is worth noting that, as in magnetization curves, a steeper slope of both longitudinal and transverse magnetostriction curves is obtained for sample Q showing also the validity of the calculated anisotropy energy. As can be seen in Table I, the degree of textures in both samples is very high, therefore based on the magnetostriction modeling for the cubic system, we investigated the effect of these textures on longitudinal magnetostriction analytically. In a cubic system, the magnetostriction can be described with the two magnetostriction constants λ100 and λ111 [14]. where the αi represents the direction of the applied magnetic field and the βi represents the measured direction [αi and βi are defined according to (2)–(4)]. In order to simulate the magnetostrictive behavior, it was assumed that the sample is polycrystalline with a texture perpendicular to the texture planes found by XRD and inside these planes, the corresponding directions are randomly distributed. So for calculating the magnetostriction, αi and βi were set equal and the resulting formula (6) was parameterized with rotation angle β to rotate inside the demanded plane. This 12.
(13) https://cimav.repositorioinstitucional.mx/jspui/ parametrization was averaged. The resulting value represents an average linear magnetostriction. In Table II, the calculated averaged magnetostriction in the crystallographic planes (110), (112), and (031) are listed up. Neglecting λ111 [16], [17] and by using a similar way to the calculation of the anisotropy energy, i.e., λL(SC) = (0.7411/32 + 0.15419/800 + 0.112/5)λ100 and λL(Q) = (0.7511/32 + 0.252/5)λ100, the λ100 values of samples SC and Q for two different strain-gauge arrangements were determined considering experimental longitudinal magnetostriction data. The following values of λ100 were obtained: 1) for the sample SC: λ100(SG1) = 74 × 10−6 and λ100 (SG2) = 248 x 10-6. It is already well known that the large magnetostriction in Fe–Ga alloys results from Fe–Ga bonds in the vicinity of Ga–Ga pairs along specific crystallographic directions in the disordered Fe structure [4], [5], [18]. Our results show a long-range ordering during slow cooling (sample SC) and a clear evidence of local short-range ordering of Ga atoms in the disordered state in Q sample resulting in larger magnetostriction. Conclusion This paper presents magnetostriction measurements on ringshaped Fe85Ga15 alloy after different cooling conditions from high temperature. The existence of a strong texture as determined from XRD in the annealed samples allowed the calculation of the anisotropy energy and the linear magnetostriction. These results could be correlated with the slopes of the magnetization and magnetostriction curves. In addition, the analytical calculations support the observed thermal history dependence on the magnetostriction response of ring-shaped Fe85Ga15 alloy. Acknowledgment 13.
(14) https://cimav.repositorioinstitucional.mx/jspui/ This work was supported by the Austrian FWF under Grant S10406-N16. References [1] A. E. Clark, M. Wun-Fogle, J. B. Restorff, T. A. Lograsso, and J. R. Cullen, “Effect of quenching on the magnetostriction of Fe1−x Gax (0.13 < x < 0.21),” IEEE Trans. Magn., vol. 37, no. 4, pp. 2678–2680, Jul. 2001. [2] A. E. Clark, J. B. Restorff, M. Wun-Fogle, T. A. Lograsso, and D. L. Schlagel, “Magnetostrictive properties of body-centered cubic Fe-Ga and Fe-Ga-Al alloys,” IEEE Trans. Magn., vol. 36, no. 5, pp. 3238–3240, Sep. 2000. [3] A. E. Clark, J. B. Restorff, M. Wun-Fogle, D. Wu, and T. A. Lograsso, “Effect of interstitial additions on magnetostriction in Fe–Ga alloys,” J. Appl. Phys., vol. 103, no. 7, pp. 07B314-1–07B314-3, Apr. 2008. [4] C. Bormio-Nunes, R. Sato Turtelli, R. Groessinger, H. Müller, and H. Sassik, “Magnetostriction of melt-spun Fe85Ga15, Fe78Ni7Ga15 and Fe78Co7Ga15 stacked ribbon samples,” J. Magn. Magn. Mater., vol. 322, nos. 9–12, pp. 1605–1608, May 2010.. 14.
(15) https://cimav.repositorioinstitucional.mx/jspui/ [5] N. Mehmood, G. Vlasak, F. Kubel, R. Sato Turtelli, R. Groessinger, M. Kriegisch, et al., “Magnetostriction of rapidly quenched Fe-X (X = Al, Ga) ribbons as function of the quenching rate,” IEEE Trans. Magn., vol. 45, no. 10, pp. 4128–4131, Oct. 2009. [6] R. Sato Turtelli, G. Vlasak, F. Kubel, M. Kriegisch, R. Groessinger, and H. Sassik, “Effect of rapid solidification on magnetostriction and microstructure in melt-spun FeAl ribbons,” IEEE Trans. Magn., vol. 46, no. 2, pp. 483–486, Feb. 2010. [7] S. Pascarelli, M. P. Ruffoni, R. Sato Turtelli, F. Kubel, and R. Grössinger, “Local structure in magnetostrictive melt-spun Fe80Ga20 alloys,” Phys. Rev. B, vol. 77, no. 18, pp. 184406-1–184406-8, May 2008. [8] M. Ruffoni, S. Pascarelli, R. Groessinger, R. Turtelli, C. Bormio-Nunes, and R. Pettifer, “Direct measurement of intrinsic atomic scale magnetostriction,” Phys. Rev. Lett., vol. 101, no. 14, pp. 147202-1–147202-4, Oct. 2008. [9] J. R. Cullen, A. E. Clark, M. Wun-Fogle, J. B. Restorff, and T. A. Lograsso, “Magnetoelasticity of Fe–Ga and Fe–Al alloys,” J. Magn. Magn. Mater., vols. 226–230, pp. 948–949, May 2001.. 15.
(16) https://cimav.repositorioinstitucional.mx/jspui/ [10] O. Ikeda, R. Kainuma, I. Ohnuma, K. Fukamichi, and K. Ishida, “Phase equilibria and stability of ordered b.c.c. phases in the Fe-rich portion of the Fe–Ga system,” J. Alloys Compounds, vol. 347, nos. 1–2, pp. 198–205, Dec. 2002. [11] R. Groessinger, N. Mehboob, D. Suess, R. Sato Turtelli, and M. Kriegisch, “An eddy-current model describing the frequency dependence of the coercivity of polycrystalline galfenol,” IEEE Trans. Magn., vol. 48, no. 11, pp. 3076–3079, Nov. 2012. [12] R. Groessinger, E. Wittig, M. Kuepferling, M. Taraba, G. Reyne, C. Golovanov, et al., “Thermal effect limits in ultrahigh-density magnetic recording,” IEEE Trans. Magn., vol. 35, no. 6, pp. 3971–3973, Nov. 1999. [13] R. Grössinger, M. Schöenhart, M. Kriegisch, M. Haas, and H. Sassik, “High field facilities at TU Vienna,” J. Low Temperature Phys., vol. 159, nos. 1–2, pp. 394–401, Apr. 2009. [14] S. Chikazumi, Physics of Magnetism. New York, NY, USA: Wiley, 1964. [15] S. Rafique, J. R. Cullen, M. Wuttig, and J. Cui, “Magnetic anisotropy of FeGa alloys,” J. Appl. Phys., vol. 95, no. 11, pp. 6939–6941,. 16.
(17) https://cimav.repositorioinstitucional.mx/jspui/ May 2004. [16] A. E. Clark, K. B. Hathaway, M. Wun-Fogle, J. B. Restorff, T. A. Lograsso, V. M. Keppens, et al., “Extraordinary magnetoelasticity and lattice softening in b.c.c. Fe–Ga alloys,” J. Appl. Phys., vol. 93, no. 10, pp. 8621–8623, May 2003. [17] A. Kumagai, A. Fujita, K. Fukamichi, K. Oikawa, R. Kainuma, and K. Ishida, “Magnetocrystalline anisotropy and magnetostriction in ordered and disordered Fe–Ga single crystals,” J. Magn. Magn. Mater., vols. 272–276, pp. 2060–2061, May 2004. [18] R. Grössinger, R. Turtelli, and N. Mehmood, “Magnetostriction of Fe-X (X = Al, Ga, Si, Ge) intermetallic alloys,” IEEE Trans. Magn., vol. 44, no. 11, pp. 3001–3004, Nov. 2008.. 17.
(18)
Figure
Documento similar
It is worth noting that if the energy of high-angle grain boundaries (HAGB) is higher than that of LAGB (Orłowska et al., 2019), the total energy of the system rises by
The fact that the majority of topologies present different dose-response curves suggests that the effect of the initial conditions in the efficiency of a given treatment is
It is worth noting that the phase diagrams of 2H Ta-based dichalcogenides are in sharp contrast from those of other transition metal dichalcogenides such as 1T -TiSe 2 ,
(Color online) Normalized tunneling conductance curves as a function of the bias voltage obtained at 200 mK, under a magnetic field of 0.1 T and zero (left panels) and 10.6 mA
Furthermore, all these magnetization curves display low coercivity and high saturation magnetization, pointing to the fact that the temperature is probably modifying the
The curve X is said to be a Q-curve if it is isogenous to all Galois conjugates. Firstly, we consider the rational points provided by Magma. In §4, we show how the j-invariants of
The main tool used is the decomposition of any rectifiable closed curve in a sequence of Jordan curves plus some curves with null index functions and an exceptional set.. 1
Bishop proves and discusses equivalent formulations of the traveling salesman theorem expressed in terms of different multi-resolution families, (see, Appendix B in
