What explains the returns in the mexican stock market
186
0
0
Texto completo
(2) WHAT EXPLAINS THE RETURNS IN THE MEXICAN STOCK MARKET?. by Mauricio Cervantes Zepeda. Dissertation. Presented to the Faculty of the Graduate School of Business Administration and Leadership (EGADE) of the Institute Tecnológico y de Estudios Superiores de Monterrrey in Partial Fulfillment of the Requirements for the Degree of. Doctor of Philosophy in Management. Instituto Tecnológico y de Estudios Superiores de Monterrey November, 1999.
(3) WHAT EXPLAINS THE RETURNS IN THE MEXICAN STOCK MARKET?. APPROVED BY THE MEMBERS OF THE DISSERTATION COMMITTEE:. Laura T. Starks (chair): Alejandro Ibarra Yunez: Martin Javier Herrera Saizar:. DIRECTOR OF THE DOCTORAL PROGRAM. María de Lourdes Dieck Assad:.
(4) DEDICATION TO DIANA, ANDREA, AND RODOLFO.
(5) ACKNOWLEDGEMENTS This dissertation would not be possible with out the wise advice, encouragement, and friendship of my committee: Laura T. Starks, Alejandro Ibarra and Martin Herrera. Their comments, revisions, additions, and corrections forced me to give my best. I would like to add special thanks to my principal advisor, Dr. Starks. In addition to providing guidance for my proposal, Dr. Starks supported me in many ways during my stay at The University of Texas during the 1997-1998 academic year. To Dr. Ibarra for providing me with his support during the 1996-1997 academic year in Monterrey and all his advice in the use and application of quantitative methods. To Dr. Herrera for his support in data base performance and his careful revision of the implementation of the experiment and his continuous discussions. A special thanks to my friend Richard Mehl who always encouraged me to never stop and helped me by correcting and editing the writing of this document. Finally, I want to thank all my colleagues at The University of Texas at Austin, ITESM-Monterrey, and ITESM-Guadalajara. Especially important was the financial support from the "Consejo Nacional de Ciencia y Tecnologia" (CONACYT) and the ITESM, my sponsors during the program. I want to thank particularly Dr. Jaime Alonso Gómez, Dra. Maria Lourdes Dieck, Lic. Juan Carlos Enríquez, and Ing. Juan Manuel Duran who have always believed in me and encouraged my efforts..
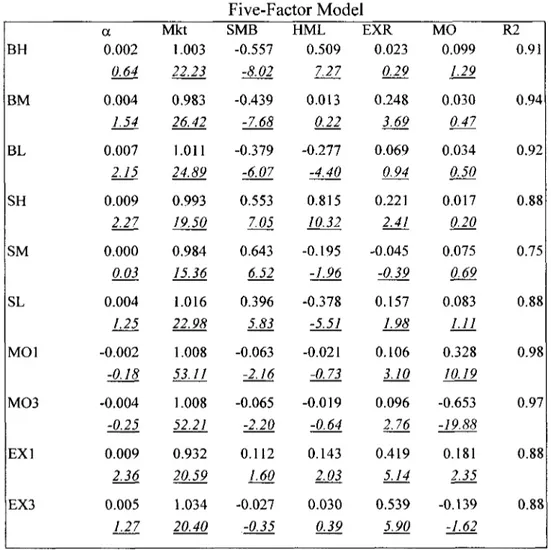
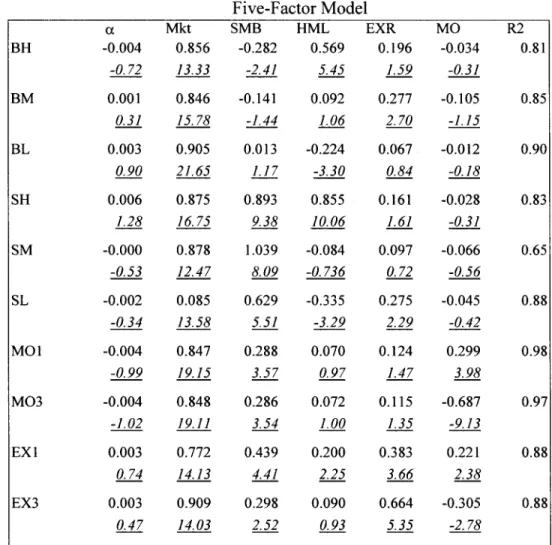
(6) ABSTRACT OF DISSERTATION GRADUATE SCHOOL OF BUSINESS AND LEADERSHIP, INSTITUTO TECNOLÓGICO Y DE ESTUDIOS SUPERIORES DE MONTERREY, CAMPUS MONTERREY. Degree: Doctor of Philosophy. Program: Doctoral Program in Administration. Name of Candidate: Mauricio Cervantes Zepeda Committee Chair: Laura T. Starks Title: WHAT EXPLAINS THE RETURNS IN THE MEXICAN STOCK MARKET?. The main objective of this paper is to develop an asset pricing model for the Mexican stock market during the period of July 1989 to December 1998. Asset pricing theory has been a topic of debate in the United States for over thirty years and consensus has not been reached. Pursuit of empirical research in pricing models is a priority in order to increase knowledge of how the market functions and to improve market regulations. Empirical research of the Mexican financial markets is scarce. The results presented in this paper suggest that the CAPM is rejected and a five-factor model is not rejected. The factors are: market index, size, book-to-market equity ratio, momentum, and peso/dollar exchange rate. The results are robust to: the use of returns in dollars or pesos; the inclusion or exclusion of the December 1994 devaluation and the economic after-shock; and the use of value-weighted or equallyweighted market indices. This may be the first study using the mimicking factor vi.
(7) approach to describe exchange rate risk. The exchange rate is also tested using the traditional macroeconomic variables as factors technique. With both techniques the beta-loadings are significant and the premium is positive and statistically significant. It is important to find if the beta-loading or the characteristic per se of the factors explain the returns. However, the low number of stocks in the Mexican stock market did not allow the test to clearly discriminate between the beta-loading or the characteristic. This dissertation opens lines of future research in portfolio evaluation, event studies, and corporate finance. The results indicate that additional investigation is required to discriminate between factor beta-loading or characteristics.. Subject Category: Finance 0508, Finance 0277 Key words: Capital Asset Pricing Models, Multifactor Models, Foreign Exchange Rate Risk, Emerging Markets, Mexico.. vii.
(8) RESUMEN ESCUELA DE GRADUADOS EN ADMINISTRACIÓN Y DIRECCIÓN DE EMPRESAS, INSTITUTO TECNOLÓGICO Y DE ESTUDIOS SUPERIORES DE MONTERREY, CAMPUS MONTERREY. Grado: Doctor en Filosofía. Programa: Programa Doctoral en Administración. Nombre del Candidato: Mauricio Cervantes Zepeda Presidente del Comité: Laura T. Starks Título: ¿QUE EXPLICA LOS RENDIMIENTOS DEL MERCADO DE ACCIONES EN MÉXICO?. El principal objetivo de esta disertación, es desarrollar un modelo de valuación de activos de capital para el mercado mexicano de acciones, durante el período de julio 1989 a diciembre de 1998. Desde hace más de treinta años la teoría de valuación de títulos financieros ha sido un tópico de debate en los Estados Unidos y aún no se ha alcanzado consenso. Esto se debe a que la investigación en modelos de valuación es una prioridad para incrementar el conocimiento sobre el funcionamiento del mercado y mejorar las regulaciones del mismo. Sin embargo, en México la investigación empírica en los mercados financieros ha sido escasa. Los resultados encontrados en la presente disertación sugieren que el CAPM es rechazado y un modelo de cinco factores no es rechazado. Los factores son: un índice del mercado, tamaño, valor libros/valor mercado, momento, y tipo de cambio peso/dólar. Estos resultados son robustos al uso de los rendimientos en dólares o pesos; a la inclusión o viii.
(9) exclusión de la devaluación de diciembre de 1994 y su subsiguiente choque económico y al uso de un índice de mercado con promedios ponderados o igualmente balanceados. Posiblemente éste sea el primer estudio usando la técnica de factores mímicos que describen el tipo de cambio como factor de riesgo. El tipo de cambio también es probado usando la técnica tradicional de factores con variables macro-económicas. En ambas técnicas las betas son significativas y el premio es positivo y estadísticamente significativo. Es importante encontrar si la beta o la característica en sí de cada factor explica los rendimientos. Sin embargo, debido al reducido número de emisiones en la Bolsa Mexicana de Valores, no es posible discriminar claramente entre la beta o la característica. La presente disertación abre avenidas para futuras investigaciones en valuación de portafolios, estudios de eventos, y finanzas corporativas. Los resultados indican que se requiere más investigación para discriminar si la beta o bien la característica en sí de cada factor explica los rendimientos.. ix.
(10) TABLE OF CONTENTS PAGE LISTOFTABLES. xiii. LIST OF FIGURES. xiv. CHAPTER 1.. 2.. INTRODUCTION AND OBJECTIVES OF THE RESEARCH. 1. I. Introduction II. Objectives and Hypotheses a. General Objective b. Specific Objectives c. Hypotheses. 1 2 2 3 3. III. Main Contributions and Limitations IV. Organization of the Dissertation. 5 6. CAPM, MULTIFACTOR AND CHARACTERISTICS ASSET PRICING MODELS. 8. I. Introduction II. The CAPM and its Related Anomalies III. The Multifactor Models IV. The Characteristic-Pricing Model a. The Nuil and Alternatives Models b. Empirical Evidence. 8 10 17 21 22 25. V. The Exchange Rate Risk a. International Parity Relations b. Stocks, Bonds and Exchange Rate c. International Asset Pricing d. Empirical Research e. Summary. 26 28 30 32 34 36. VI. Conclusión. 37.
(11) TABLE OF CONTENTS- continued. 3.. 4.. CHARACTERISITICS AND EMPIRICAL RESEARCH OF THE MEXICAN STOCK MARKET. 39. I. Introduction II. The Mexican Securities Market a. History b. Trading System c. Stock Market índex d. Information Available e. BMV Links with the Mexican Financial System f. Regulations g. Size of the Market '. h. Conclusión. 39 40 42 44 44 47 48 49 51 53. III. Empirical Research on the Mexican Stock Market a. México b. International Studies c. Conclusión. 55 56 61 65. ECONOMETRIC TESTS FOR PRICING MODELS. 68. I.- Introduction II. The Capital Asset Pricing Model (CAPM) a. TheModel b. Estimation and Testing of the CAPM c. The Multivariate Wald and Likelihood Ratio Tests d. The Size of the Test e. The Power of the Test. 68 69 69 70 73 78 79. III. The GMM and the Pricing Models a. CAPM Estimators with GMM b. GMM Tests of the CAPM. 81 81 86. IV. Multifactor Pricing Model a. Estimating Factors b. Traded Mimicking Factor Portfolios c. Macroeconomic Variables d. The GMM in Multifactor Models e. Summary XI. 88 90 92 96 100 102.
(12) TABLE OF CONTENTS- continued. V. Other Recent Approaches a. Bayesian Approach b. Genetic Algorithms. 102 102 104. VI. Conclusión. 104. ANALYSIS OF RESULTS. 106. I. Introduction II. Data III. Multifactor Pricing Models a. Size and BE/ME Factors b. Exchange Rate Factor c. Momentum Factor d. The Batteryof Tests e. Market Index f. Size, BE/ME, Momentum and Exchange Premiums. 106 107 108 110 116 118 119 121 122. IV. Additional Testing Procedures a. Foreign Investors Viewpoint b. The December 1994 Devaluation Economic Shock c. The Model with the VWMI or EWMI d. Conclusión. 126 126 132 134 134. V. The Dynamics of the Factors VI. An Additional Approach to Test the Exchange Factor VIL Characteristics Versus Multifactor Model a. Covariance Stability b. Characteristic or Beta-Loading. 136 140 144 144 146. VIII. Conclusión. 150. GENERAL CONCLUSIONS AND LINES OF FUTURE RESEARCH. 157. REFERENCES. 161. BIOGRAPHICAL SKETCH. 171. 5.. 6.. 7.. XII.
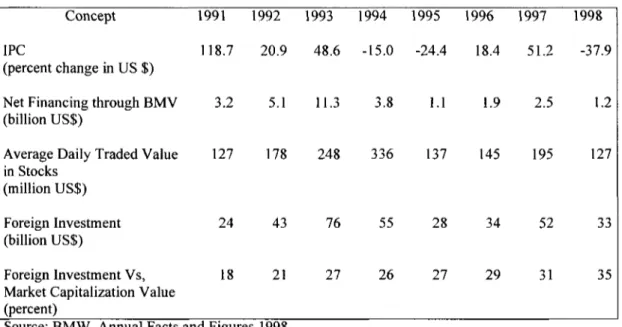
(13) LIST OF TABLES. TABLE No.. PAGE. 1. Measure of Size and Performance of the BMV. 52. 2. Statistics of Portfolios Forming the Dependent Variable. 110. 3. CAPM and Multifactor Pricing Models, July 1989 to December 1998.... 111. 4. Mean Monthly Returns, Standard Deviation and Correlation Among Factors and Market Proxies. 123. 5. Foreign Investors Viewpoint. Statistics of Portfolios Forming the Dependent Variable, the Market Proxy, and the Risk Free Rate.... 128. 6. Foreign Investors Viewpoint. CAPM and Multifactor Pricing Models, July 1989 to December 1998. 129. 7. Five-Factor Model Eliminating the December 1994 Devaluation Economic Shock. 133. 8. Five-Factor Model with the Valué-Weighted Market índex. 135. 9. Dynamics of the Five-Factors: The VAR Model. 138. 10. Market, Exchange Rate and Bond índex Factors, January 1991 to December 1998. 143. 11. Pre-Formation Monthly Return Standard Deviation of Portfolios. 146. 12. Mean Monthly Returns of the Eight Portfolios Formed on the Basis of Size, BE/ME, and the HML Factor Loading. 149. xin.
(14) LIST OF FIGURES. FIG. No.. PAGE. 1. The IPC Performance (January 1993-December 1998). 53. 2. Market Capitalization (January 1993-December 1998). 54. 3. Geometric Explanation of a Wald Test. 75. xiv.
(15) CHAPTER 1 INTRODUCTION AND OBJECTIVES OF THE RESEARCH. I. INTRODUCTION The goal of this paper is to form an asset pricing model that describes the behavior of the Mexican stock market. This is not an easy task. Since the appearance of the first pricing model in 1964, empirical tests in the U.S. market have rejected the different approaches proposed. However, recent improved pricing models provide a satisfactory description of stock return variation. The rejection of a pricing model is sensitive to the econometric method and tests that are used. The development of statistical and quantitative methods applied to financial fields has grown considerably in the last decade, developing important tools for the empirical financial researcher. Mexico's stock market history can be traced to the late 1800's. The development of the market was limited due to the Mexican revolution, World War II, and the strength of the Mexican banking system. Since 1975 several regulation changes, beginning with the consolidation of the three existing Mexican stock markets, the creation of the mutual fund industry, the introduction of electronic trading systems, the prívate pensión fund system, and the derivatives market are converting the Mexican securities market into an emerging modern market. Currently, several Mexican issues are traded abroad, and intemational companies such as Merrill Lynch, Goldman Sachs, and Bankers Trust are members of the exchange. Thirty-five 1.
(16) percent of the investors in the Mexican securities market are foreign investors (Animal Facts and Figures, BMV, 1998). Given the recent development of the financial market, a weak point of the Mexican securities market is the scarcity of formal research. This is possible due to the lack of useable databases and the small number of qualified researchers specializing in the field. The study of an asset pricing model is important to the understanding of how investors perceive risk and how economic policy, international events, or firm characteristics affect stock prices. A pricing model could shed light on regulatory questions and be a keystone in the development of portfolio performance theory and research in corporate finance studies. Empirical research can provide a more formal guide to regulatory changes.. II. OBJECTIVES AND HYPOTHESES In this section the general objective, specific objectives, and the main hypotheses that drive the investigation are described.. a. General Obiective The general objective of this paper is to develop an asset pricing model for the Mexican capital asset market. An asset pricing model describes the risk factors that explain the behavior of stock returns. It aids in understanding trading and identifies the important characteristics that influence investors. A pricing model that explains the cross-section variation of the Mexican stock market would be a useful tool to 2.
(17) evalúate portfolio performance, to analyze event studies, to evalúate projects, to calcúlate optimal investment options, and to apply to other corporate finance functions.. b. Specifíc Obiectives This dissertation studies the complete Mexican stock market during the period of July 1989 to December 1998. There are four specifíc objectives: -Prove Sharpe's (1964) CAPM as applied to the Mexican stock market. -Test Carhart's (1997) four-factor model on the Mexican stock market. -Examine whether the peso/dollar exchange rate fluctuation is a risk factor in the Mexican market. -Based on the work of Daniel and Titman (1997), an attempt is made to test whether the risk factors or the characteristic per se is the best predictor of Mexican stock returns.. c. Hvpotheses Several hypotheses are developed and tested during the research. The basic assumptions behind the hypotheses are the following: between México and the U.S. numerous barriers such as cultural shock, information-related frictions, legal restrictions, transaction costs, political risk, and exchange risk exist. Despite the barriers, the influence of the U.S. has grown due to increased trading and membership of U.S. firms in the Mexican securities market. Total foreign investment amounts to 3.
(18) 35 percent of the market equity. The assumption is that México and the U.S. markets are neither totally segmented ñor fully integrated, but instead are partially integrated.. HYPOTHESIS 1: The Sharpe CAPM is rejected in the Mexican stock market.. HYPOTHESIS 2: The four-factors that help explain stock return variation in the U.S. market: market index, market equity size, book equity-to-market equity ratio and momentum, are significant in the Mexican market.. HYPOTHESIS 3: Peso/Dollar exchange rate fluctuation is a source of risk in the Mexican stock market. It is a factor that helps to explain returns and it is priced.. HYPOTHESIS 4: In December 1994, México suffered a currency devaluation and economic shock. The pricing model developed in this dissertation is robust to the inclusión or exclusión of the effects of the devaluation.. HYPOTHESIS 5: Each factor must provide its own information to the model and the factors should be serially uncorrelated. A VAR model that includes all the factors of the pricing model should be statistically insignificant in all the leads and lags..
(19) HYPOTHESIS 6: It is expected that in Mexican stock market the characteristic describes the stock returns better than the factor beta-loading.. The previously stated hypotheses guide the research approach detailed in the methodology section.. III. MAIN CONTRIBUTIONS AND LIMITATIONS In highly developed and industrialized countries, their capital markets are a driving forcé in the economy. Because of the infiuence of these markets, the majority of academic research has centered on them. Numerous asset pricing models have been developed and applied to the major markets, but in countries with emerging capital markets, the understanding of market functioning is not clear. It is essential to perform research in these countries. The development of an asset pricing model is a fundamental step in understanding the relationship between risk and returns. How do investors perceive risk? How adverse are they to risk? Is risk perceived and priced as uni-dimensional or multi-dimensional? Which characteristics are good proxies for risk? In addition to providing a better understanding of the questions listed abo ve, an asset pricing model is indispensable in other áreas of finance. Portfolio evaluation requires an assessment of risk and returns. Corporate finance requires a pricing model to determine correct discount rates and optimum investment levéis. Event studies require a benchmark to analyze before and after returns..
(20) The main limitation to the study of the Mexican stock market is the low number of firms and the somewhat limited historical data. These conditions limit the use of some techniques that are applicable in larger markets that have extensive historical data and hundreds or thousands of firms. These conditions also constraint the robustness of the results. However, it is important that practitioners, academicians, and regulators in México understand the specific behavior of the Mexican market. This research is designed to contribute to understanding that specific behavior.. IV. ORGANIZATION OF THE DISSERTATION Chapter 2 explains the evolution of the pricing model from the Sharpe (1964) model to the characteristic-based model of Daniel and Titman (1997). The main anomalies of the Sharpe's Capital Asset Pricing Model (CAPM) are reviewed along with the model's influence on the development of the intertemporal model of Merton (1973) and the arbitrage model of Ross (1976). A discussion of advantages and disadvantages of the different approaches concludes the chapter. Chapter 3 briefiy reviews the history of the Mexican stock exchange and describes the basic framework of trading systems, market índices, and availability of information. The linkage of the securities market with the Mexican financial system and important regulations are described. Further, Chapter 3 contains a summary of previous financial empirical research conducted on the Mexican market along with a summary of international research where several countries, including México, are compared. Chapter 4 describes the methods and tests used to perform empirical research in pricing models. 6.
(21) Chapter 5 presents the methodology and results obtained in this dissertation. Finally, summary and ftiture research possibilities are presented in Chapter 6..
(22) CHAPTER 2 CAPM, MULTIFACTOR, AND CHARACERISITICS ASSET PRICING MODELS. I. INTRODUCTION Despite an early attempt by Bernoulli (1783/1954) to define a mathematical measure of risk in terms of probabilities, the twin concepts of expected return and risk have not been fully integrated. Von Neumann and Morgenstern (1947) developed the breakthrough in theoretical choice under uncertainty, but it took the developments of Markowitz (1952), and Tobin (1958) to provide a basis to solve the portfolio selection problem. Markowitz developed an analysis based on maximization of the investor's expected utility and proposed a general solution for the portfolio selection problem. He rejected the rule of maximization of discounted expected returns, showing that under this rule the investors would place all their wealth in the security with the highest expected return. Markowitz's approach to portfolio selection may be characterized as normative. Six years later, Tobin (1958) attacked the problem of liquidity preference based on tools developed by Markowitz (1952). He showed that under certain conditions Markowitz's model implies that the process of investment choice can be brokendown into phases: first, the choice of a unique optimum combination of risky assets; and second, a sepárate choice concerning the allocation of funds between such a 8.
(23) combination and a single riskless asset. An additional six years were required before the theory of capital markets appeared. The delay was possibly due to the lack of reality of the assumption required to found it, principally the homogeneity of investor expectations, which Sharpe (1964) emphasized as a necessary step to obtain equilibrium conditions in the capital market. At that time, there was no theory describing how the pricing of securities results from the basic influence of investor's preferences and the physical attributes of capital assets. Without such a theory, it was a difficult task to give any real meaning to the relationship between the price of a single asset and its associated risk. Until 1964, no one had succeeded in constructing a market equilibrium theory of asset price under conditions of risk. In this chapter, the Capital Asset Pricing Model (CAPM), Multifactor, and Characteristics asset pricing models will be briefly reviewed. Section II briefly reviews the first pricing model, the CAPM of Sharpe (1964), Lintner (1965), and Mossin (1966). In addition, several anomalies have been reported by empirical studies and a brief description of the anomalies is presented. Section III reviews some of the multifactor pricing models. Section IV summarizes the Characteristic-Pricing model developed by Daniel and Titman (1997) that is designed to rectify the limitations usually tied to the other models. Finally, empirical evidence comparing multifactor and characteristic based pricing models is presented. The goal of this paper is the formation of a pricing model that describes the behavior of the Mexican stock market. Special attention is directed to foreign.
(24) exchange rate risk. Section V presents a review of the theory and empirical research behind the exchange rate risk. Finally, conclusions are discussed.. II. THE CAPM AND ITS RELATED ANOMALIES The origin of the CAPM usually is credited to three authors, Sharpe (1964), Lintner (1965) and Mossin (1966), who independently reached it virtually at the same time. (For a more complete review of portfolio theory see Constantinides and Malliaris, 1995). Sharpe (1964) gives a verbal-diagrammatic discussion of the determination of asset prices in quasi-dynamic terms, but his lack of precisión in the specification of equilibrium conditions leaves parts of his arguments somewhat undefined. Lintner (1965) sent his article to the printers before Sharpe's article was published. His first section is quite similar in form and conclusión to Sharpe's, but he developed an original algebraic framework and included a discussion about the capital budgeting problem. As does Sharpe, he assumes a risk free asset, free transaction costs, equal active and passive interest rates, and investor risk-aversion. One year later, Mossin (1966), developed a similar model. The need for the existence of a risk-free asset is a limitation of the CAPM. In order to overeóme this limitation, Black (1972) derived a less restrictive versión of the CAPM. In his model he used the fact that all of the efficient sets of portfolios could be formed as a linear combination of any two efficient portfolios. This versión of the CAPM does not depend on the existence of a risk free asset. However, the 10.
(25) basic assumption that all investors have a common joint probability distribution for returns on the available assets is still applied. A large amount of empirical research has found persistent cross-sectional and time series patterns or anomalies in returns. The anomalies are not explained by the CAPM and it is important to remember that these anomalies reject the nuil hypothesis that the market is efficient and that the pricing equilibrium model is correct. Concluding that the market is inefficient may be incorrect since the rejection could be due to a test based on an incorrect pricing model. The fact that such anomalies have persisted for periods longer than thirty years suggests that the problem may be an inadequate equilibrium model. Some of the most relevant anomalies found in the last years will be mentioned and for a more complete description see Hawawini and Keim (1995). Banz (1981) documents the importance of the firm size (market capitalization of a common equity) for the period of 1931-1975. Regressing the returns by using beta and the firm size, his results show that the statistical association between returns and size is negative and strongly significant and the explanatory power of the beta is very low. Basu (1977) demonstrates that the price-earnings ratio (P/E) has more powerful explanatory power than the CAPM beta. He suggests that P/E ratios may explain the violations of the CAPM and concludes that there is a significant negative relation between P/E and average returns in excess of those predicted by the CAPM. By using the annual rankings during the period 1957-1975 he shows that buying the quintile of lowest P/E and selling short the highest P/E quintile, the average annual 11.
(26) abnormal return would have been 6.75% gross. Stattman (1980) documents a significant negative relationship between the price per share to book valué per share (P/B) and returns. The average monthly difference of the extreme P/B portfolios, for the 1962-1989 period, is comparable to the differential of P/E and larger than the size premium measured over the same period. The P/B ratio is equivalent to the inverse of the book equity-to-market equity ratio (BE/ME). Bhandari (1988) documented a positive relationship between leverage and returns. In addition, there are time series related anomalies in many models. One of the first studies to report time series anomalies is Fama and French (1988). The study suggests negative serial correlation in periods of three to five years. Lo and MacKinley (1988) report positive serial correlation in weekly returns, but the findings were considered economically insignificant. Jegadeesh (1990) regressed excess returns on the last 12, 24, and 36 month periods for the 1934-1987 period. He found that the one and twelve month lags are particularly high and significant at the one percent level. Later, Jegadeesh, and Titman (1993) found trading strategies, such as buying past winners and selling past losers (3 to 12 months), that realized significant abnormal returns over the 1965-1989 period. They suggest that this result is not due to additional risk or lead-lag effects from reaction to common factors, but is consistent with delayed price reactions to firm-specifíc information. After one year the excess returns begin to dissipate. Rouwenhorst (1998) obtains very similar results to Jegadeesh and Titman in a sample of 12 European countries over the period from 1980 to 1995. Hong, Lim, and Stein (1999) suggest that heterogeneity across 12.
(27) investors, who observe different pieces of prívate information at different points in time, explains momentum. They assume that information diffuses gradually across the investing public and investors cannot perform the rational-expectations trick of extracting information from prices. Momentum refiects the gradual diffusion of firmspecific information. While there is some agreement that valué strategies have produced returns superior to growth strategies, the interpretation of why this has occurred is more controversial. Basically, there are three unes of explanation for these anomalies: missing risk factor or multidimensional risk; psychological investor reaction, and methodological problems. In line with multidimensional risk, several models have been developed. The most remarkable are the Intertemporal Capital Asset Pricing Model (ICAPM) by Merton (1973) and the Arbitrage Pricing Theory (APT) by Ross (1976). In this approach Fama and French (1992, 1993) argüe that CAPM related anomalies are the result of additional risk and that additional factors should be included in the pricing model. Then, investors are fully rational, but they price risk in a multidimensional framework. Haugen (1994), DeBondt and Thaler (1995), and Lakonishok, Shleifer, and Vishny (1994) argüe that naive strategies might be extrapolated: past earnings growth is extended too far and investors overreact to good or bad news. Consequently, the naive investor overprices growth stocks and undervalues the valué stock. Low BE/ME ratio (or growth) stocks are more glamorous, attracting naive investors who push up prices and lower the expected returns. The authors suggest that contrarían investors bet against such naive investors 13.
(28) and outperform the market. This hypothesis implies that there are more naive investors than contrarían investors and the market would not be efficient or offer a lot of virtual arbitrage opportunities. Otherwise, Haugen (1994) proposes an explanation based on agency problems. Although portfolio managers are aware that valué stocks have bigger expected returns, they feel more comfortable buying growth stocks. For instance, who would fire a manager or sue a broker who bought the stock of IBM or Microsoft? The motivation behind the contrarían strategy of Lakonishok et al. (1994) is quite different from the Jegadeesh and Titman (1993) momentum strategy. Momentum-based strategies rely on the market's short-term failure to recognize a trend. In contrast, the superior returns due to valué strategies documented by Lakonishok et al., seem to be driven by the market's unwarranted belief in the continuation of a long-term trend and the gradual abandonment of that belief. However, consensus has not been reached on this point. Disagreeing with the Lakonishok et al. hypothesis, Fama and French (1996) do not accept that valué strategy verges on being an arbitrage opportunity. They show that the risk premium and standard deviation for betas, size, and valué strategies were 5.9, 4.2, and 6.3 (return premium) and 16.3, 144, and 13.1 (standard deviation), respectively, during the period of 1964-1993. They also point out that the valué strategy had negative returns for ten years that were similar to the returns of the CAPM model. The argument is that these findings are consistent with the factor risk hypothesis. However, MacKinlay (1995) suggests that the statistical distribution of the ex ante 14.
(29) Sharpe ratio from the returns of Fama and French (1993) portfolios is too high to be explained within the context of efficient-market theory. Another explanation of the CAPM anomalies is by Kothari, Shanken, and Sloan (1995). They argüe that CAPM does not provide explicit guidance on the choice of a horizon in assessing whether beta explains cross-sectional variation. The choice of monthly returns is largely a consequence of data availability and the inferenee can be sensitive to the interval used to estimate betas because true betas themselves vary systematically and nonlinearly with the length of the interval. Kothari et al. estimate betas from the time-series of annual portfolio returns on the equally-weighted market index. Their results reveal an economically and statistically significant premium (about six to nine percent per annum) for beta risk which is not influenced by the portfolio-formation (they repeat Fama and French (1993) procedures). Further, they found that the BE/ME and returns are weaker and less consistent than in Fama and French. They conjecture that this could be due to COMPUSTAT selection bias but can only provide indirect evidence. Kothari et al. present reasons for using annual data, such as problems in beta estimates due to trading frictions and non-synchronous trading, or problems in inducing systematic cross-temporal covariance in shortinterval returns. They suggest that using longer interval returns mitígate these biases. Kothari et al. suggest that an alternative approach to reduce bias in beta estimates could be the estimation of the beta as the sum of the slopes in the regression of a portfolio's monthly return on the current and prior month's market return. There appears to be a significant seasonal component to monthly returns, and the use of 15.
(30) annual retums is one way, although not necessarily the best, to minimize the statistical complications that occur from seasonality. Empirically, the betas of small firms increase and those of large firms decrease with the return-measurement interval. Kothari et al. found that the size effect was substantially reduced when annual returns are employed. Most empirical studies of the static CAPM assume that betas remain constant over time and the return on the value-weighted portfolio of all stocks is a proxy for the return on aggregate wealth. In another attempt to explain the CAPM anomalies, Jagannathan and Wang (1996) propose that these anomalies are induced because the relative risk of a firm's cash flow is likely to vary over the business cycle. Henee, betas and expected returns will in general depend on the nature of the information available at any point in time and will vary. The argument is that econometricians who ignore the time variation of beta will mistakenly conclude that the CAPM does not hold. They will find a fíat relationship between betas and returns as Fama and French (1992) did. However, Ghysels (1998) suggests that trying to capture the time variation betas could be inherently misspecified. He argües that there is a real possibility that serious pricing errors can be committed, potentially larger than with a traditional constant beta model. His results suggest that this is indeed the case, namely that pricing errors with traditional constant beta models are smaller than with conditional CAPMs. Agreement or a consensus of opinión on the argument has not been achieved.. 16.
(31) III. THE MULTIFACTOR MODELS Empirical research in the last twenty years has rejected the joint hypothesis of market efficiency and CAPM, encouraging the development of multi-factor alternative models. Merton (1973) and Ross (1976) have been the pioneers in the development of multifactor models. The ICAPM by Merton (1973), shows that investors will share out with the riskless asset the tangency portfolio in the mean-variance curve (not necessarily the market portfolio) and a hedging portfolio, with the weights being dependent on investor preference. A hedging portfolio (or portfolios) will depend on the correlation of the assets with the possible state or macro variables. The ICAPM has the simplicity and empirical tractability of the CAPM. It is consistent with the expected utility maximization and pro vides specification of the relationship among yields that is more consistent with existing empirical evidence. The model, however, has weaknesses. It uses homogeneous expectations plus the assumption that trading in assets takes place continually in time and returns are log-normally distributed. Nevertheless, ICAPM is robust enough in the sense that it can be extended to include effects other than shifts in the investment opportunity set. Ross (1976) created the Arbitrage Pricing Theory (APT). The idea behind the model is that equilibrium market prices should be rational in the sense that prices will move to rule out arbitrage opportunities. Furthermore, the APT yields an expected return-beta relationship, using a well-diversified portfolio that can be constructed from any large number of securities and avoids the unobservable market portfolio. 17.
(32) The APT implies that this relationship holds for all but perhaps a small number of securities, focusing on the no-arbitrage condition. Without the further assumptions of the CAPM, the APT cannot rule out a violation of the expected return-beta relationship for any particular asset. In the APT, some agents could disagree on the distribution of the idiosyncratic noise term, e. There is also a possible weak assumption that all the individual noise terms are mutually uncorrelated. However, APT still requires essentially identical expectations and agreement on the beta-loadings as explanatory variables if the identification of ex ante beliefs with ex post realizations is to provide empirically useful results. Grinblatt and Titman (1983) present a derivation of the factor pricing equation that describes the deviation on an asset by asset basis. The deviation is shown to be small for assets in a realistic finite economy and is arbitrarily cióse to zero for those assets with arbitrarily small size relative to aggregate wealth. This means that the linear multifactor equation provides a good approximation for the mean returns of all traded assets. Grinblatt and Titman (1987) introduced some extensions of efficient-set mathematics and offered an intuitive interpretaron of the APT model showing that there is an important distinction between the implication of mean-variance efficiency in the CAPM and local mean-variance efficiency in the APT. While the CAPM predicts that the market portfolio is mean-variance efficient, it does not give clues about which portfolios are mean-variance efficient in observable subsets of the 18.
(33) economy. Grinblatt and Titman demónstrate that the APT predicts that for subsets of the economy's assets, the proxy portfolios of factor analysis are locally meanvariance efficient. It also predicts that in any subsets of the overall market, large diverse portfolios approach local mean-variance efficiency as the number of securities becomes large. The APT is inherently more testable than the CAPM since the test does not rely on the observation of particular indexes. Grinblatt and Titman do not provide new techniques to test the APT or other multifactor equilibrium models, but provide a fresh approach for interpreting some difficulties encountered in research on these models. One of the first empirical studies of a multifactor model is Fama and French (1992). They analyzed the size effect of Banz (1981), the positive relationship between leverage and returns documented by Bhandari (1988), a BE/ME anomaly of Stattman (1980), and E/P of Basu (1983) by regressing the stock returns on all these variables. Their results suggested that beta does not seem to help to explain the crosssection of average returns, and the combination of size and BE/ME equity seems to absorb the roles of leverage and E/P in average returns, at least during their 19631990 sample period. If assets are priced rationally, Fama and French (1992) results suggest that stock risk is multidimensional. One risk dimensión is mimicked by size and another by BE/ME. It is possible that the BE/ME captures the relative distress risk factor. They conclude that two easily measured variables, size and BE/ME, provided a simple and powerful representation of the cross-section of average returns for the 1963-1990 period. 19.
(34) Fama and French (1993) expanded their research to include U.S. government and corporate bonds and identified five common risk factors in the returns on stocks and bonds. In Fama and French (1992), size and BE/ME explain the cross-sectional variation, but in time series analysis Fama and French (1993) found that these variables alone cannot explain the large difference between the average returns on stocks and one-month T-bills. In order to analyze excess returns, a market factor is necessary. Fama and French (1993) created two portfolios, based on sorting by size and BE/ME, mimicking the size risk factor or small-minus-big portfolio (SMB), and the BE/ME risk factor high-minus-low portfolio (HML). Thus, SMB is the difference between the returns on small-and big-stock portfolios with about the same weightedaverage BE/ME equity. This difference should be largely free of influence of BE/ME, focusing instead on the different return behaviors of small and big stocks. Similarly the HML portfolio returns should be largely free of the size factor, focusing instead on the different return behaviors of high-and-low BE/ME firms. However, the hypothesis that these three factors completely explain the returns, (regression intercepts are equal to zero), was rejected. Fama and French explain that the rejection comes largely from the lowest BE/ME quintile of stocks, and despite its marginal rejection, the authors believe that the three-factor model does a good job on the crosssection of average stocks. Besides, they explain that their model also captures the reversal of long term returns but recognize that their three-factor model is just a model and cannot explain the continuation of short-term returns or momentum. Fama and French (1993) suggest that one of the state variables could be related to relative 20.
(35) distress. One necessary condition for multifactor ICAPM or APT is múltiple common sources of variance, and they show that there is indeed strong covariation in returns that are not captured by the market return. Another multifactor approach is the conditional CAPM by Jagannathan and Wang (1996). The model is very different from the typical CAPM and very similar to the APT and ICAPM. They show how a one factor conditional CAPM leads to a two-factor and three-factor model of unconditional expected returns. The conditional CAPM has an undesirable feature in that econometricians have to take a stand on the nature of the information available to investors. Also, since a number of events occur at predetermined monthly and yearly frequencies, one strategy would be to use annual data over a long period. The problem is that over long periods, the economy is not stationary. Connor and Korajzcyk (1995) present a detailed review of the different versions of multifactor models.. IV. THE CHARACTERISTIC-PRICING MODEL Multifactor pricing models have been proposed as an alternative to the CAPM. However, MacKinlay (1995) suggests that multifactor models do not explain the CAPM related anomalies and that examining other alternatives may be fruitful. He shows that the evidence against the CAPM could also be interpreted as evidence that multifactor models on their own cannot explain the deviation of the CAPM. His results suggest that more can be learned by considering the likelihood of various existing empirical results using different economic models. 21.
(36) Daniel and Titman (1997) address the question of whether the return patterns of characteristic-sorted portfolios (i.e. SMB and HML portfolios) are, in fact, consistent with a factor model. They question whether there are pervasive factors that are associated with size and BE/ME and whether there are risk premia associated with these factors. They tested whether the high returns of small size and high BE/ME can be attributed to factor beta-loading. They found that there is no discernible sepárate risk factor associated with high or low BE/ME characteristic firms, and there is not a return premium associated with them. Their results suggest that high BE/ME stocks covary strongly with one another, not because they share a particular kind of risk, but because high BE/ME firms tend to have similar properties, being equally strong before firms eventually become distressed. They investigated portfolios with similar characteristics but different beta-loadings on the Fama and French (1993) factors to determine if covariance or characteristics determine expected returns. The results show that after controlling for firm characteristics, expected returns do not appear to be positively correlated to the beta-loadings on the Mkt, SMB, or HML factors.. a. The Nuil and Alternatives Models In order to demónstrate their hypothesis, Daniel and Titman propose a nuil and two alternative models. The nuil hypothesis, model 1, is similar to the models proposed by Fama and French (1993) or Carhart (1997) among others, where a distress factor exists. Formally:. 22.
(37) r1>t = E[rI>t] + Zj)ftj / j > t + 0i>t-i / D , I + £¡,t. E U ->• T](0, a e ¡ 2 ). where. (1). / j>t -> r|(0,. yffy is the beta-loading of firm i on factor7 and fjtl is the return on factor7 at time t. In this model #,,is the beta-loading on the distress factor, and/*£>,, the return on the distress factor at time t. In this factor pricing model, expected returns are linear functions of all factor beta-loadings: E t_, [rI>t] = r f>t + I j pi¿ X j + 0,,,-j X D. (2). In equation (2) the BE/ME ratio proxies for 0, and X is the premium associated with the factors. Note that 0it varíes over time as firms move in and out of distress. If there are no firms that continually load in these factors, a purely statistical factor analysis will fail to detect whether the premium of the high BE/ME portfolio could be explained by the beta-loadings on these factors. The first alternative, model 2, is one with time varying factor risk premium:. r¡,,= E[r¡>t] + I j # i / / j > t + 6i>t. where. e¡,t -> r|(0, a e i 2 ). /j st -> r)(0,. 23. (3).
(38) In this model, the variance-covariance matrix is time-invariant and there is no separated time-variant distress factor:. E [r,,t]= ru+Iifij. ^j,t-i. (4). but the risk premium on the factors varíes through time. As a second alternative, model 3, they propose their characteristic-based pricing model where the main assumption is that high BE/ME stocks realize a return premium that is unrelated to the underlying covariance structure:. r¡,t_= E[r1>t] + Zj fia /j,t+ e¡,t. where. si;t -» r\(0, a e ¡ 2 ). (5). /j,t-> T|(0, 1). Covariancies are stationary over time and can be described by a factor structure.. E [r¡jt]= a + bi ei>t-i. (6). However, factor beta-loadings do not describe expected returns. Daniel and Titman assumed expected returns are a fiinction of the observable, slowly varying firm attribute 0it. They present empirical evidence that is inconsistent with all but the characteristic based model. 24.
(39) b. Empirical Evidence Fama and French (1993) found that the stocks in the high BE/ME portfolio strongly covary with one another and have high returns. Their conclusión is that these stocks load in a factor that has a high premium. This intuition is consistent with the two first models. Daniel and Titman (1997) argüe that if a factor has negative realizations, all the firms that load in that factor will be, on average, distressed. This is the reason why distress firms covary with one another, and it appears that all distressed firms load in a distress factor. In order to discriminate between model 1 and 3 it is necessary to see whether the return standard deviation of a portfolio increases if they all become distressed simultaneously. An increase is consistent with model 1. Model 3 also indicates that all firms with a distress characteristic will earn high returns and the returns are independent of whether or not there is a distress load factor. To analyze this question Daniel and Titman made a five year "backward looking" and "forward looking" study of the size and BE/ME based portfolios comparing the standard deviation of the monthly excess return. Their findings suggest that the high standard deviation did not disappear as predicted by model one. If the factor model is correct, then a high (low) BE/ME stock with a low (high) beta-loading in the distress factor (BE/ME factor) should have a low (high) average return. The characteristic model predicts that a high (low) BE/ME should have a high (low) average return independent of its beta-loadings. In order to perform this test, Daniel and Titman (1997) formed portfolios based on characteristics (size and BE/ME), and then sorted these into subportfolios based on the firm's preformation 25.
(40) factor beta-loadings. The results were portfolios with very similar size and BE/ME stocks but different beta-loadings on the BE/ME factor HML. These portfolios allowed examination as to whether characteristics or factor beta-loadings generated the average returns. They found a small difference (0.07 percent per month) between the portfolios with high and low beta-loadings on the BE/ME factor HML. The explanation for the results is likely due to the fact that when they sorted on the HML factor beta-loading, they picked up variation in the BE/ME ratio within relatively broad categories. Daniel and Titman results open alternative Unes of explanation to the missing risk factor of Fama and French (1993). The Daniel, Hirshleifer, and Subrahmanyam (1998) paper proposes a theory of stock market under/over reactions based on the psychological biases of investor overconfidence and biased self-attribution. In the next years more varied and complex pricing models will appear helping to achieve better knowledge of stock market behavior.. V. THE EXCHANGE RATE RISK Up to this point an ICAPM or APT framework analyzes the possibility that stocks are multidimensionally priced. This dissertation is designed to analyze the Mexican stock market. If the market is not completely segmented and a large percentage of its investors are foreign, it is important to analyze or determine what role the exchange rate may possess as a potential source of risk. This section briefly reviews the exchange rate literature and current empirical research. 26.
(41) International investment is rapidly growing throughout the world. U.S. investors are attracted to foreign markets due to the possibilities of better performance and risk diversification. Solnik and Noetzlin (1982) results suggest that spreading investments over major foreign markets reduces risk while enhancing returns. Thus, a passive diversification along the Unes of the Morgan Stanley Capital International World Stock índex has less risk than a purely domestic U.S. portfolio and provides a higher expected return, even though U.S. stocks make up more than half of this index. Papers defending the benefits of international asset allocation are Grauer and Hakansson (1987), Levy and Lerman (1988), or Jorion (1989) among others. However, international investment implies various problems. Investors encounter cultural shock, different structures of financial institutions, lack of sources of information, and different trading rules, to ñame just a few. In addition, transaction costs, discriminatory taxation, and political risk must be considered. Prices of foreign assets and their distributions must be converted into domestic prices distributions using exchange rates, and exchange rate fluctuations add another dimensión of risk and uncertainty in international capital markets. Not only returns in domestic currency are affected by exchange rate fluctuation, but foreign returns are impacted by exchange rate adjustments. Asset prices, interest rates, and foreign exchange rates are interrelated in a complex manner. Following Solnik (1991) a synthesis of the main variables that affect the exchange rate and its interrelations are presented in the rest of this section.. 27.
(42) a. International Parity Relations Fluctuation in exchange rates can be generated by a variety of sources and economic events. Basically, the theoretical parity relations of intemational finance are: purchasing power parity, intemational Fischer parity, foreign exchange expectation parity, and interest rate parity. Purchasing power parity (PPP) states that exchange rates adjust perfectly to inflation differentials and in accordance with this theory the exchange rate at any moment should be:. (7). where S is the spot exchange rate in number of foreign currency units per domestic units, IF is foreign inflation, and ID is domestic inflation. When the PPP holds, the real retum on an asset is identical for investors from any country. Exchange rate fluctuations have no influence on an intemational asset pricing theory since the rates only mirror inflation differentials and equalize real returns across countries. The intemational Fisher relation proposes that differences in nominal interest rates are caused by different inflationary expectations and real returns, formally:. rr,Xl + £ [ / ] ) 28.
(43) where r is the nominal interest rate and rr the real interest rate. This international Fisher relation is an important international portfolio tool for managers because if real interest rates are stable, the interest rate differential is caused by different expectations of national inflation rates. The difference between two countries in real interest rates should be in equilibrium with the country risk. Otherwise, international investors would arbitrage the difference. Foreign exchange expectation relation states that the forward exchange rate quoted at time zero for delivery at time t is equal to the expected valué of the spot exchange rate at time t. This parity relation depends strongly on the certainty assumptions. It is claimed that the forward exchange rate should be an unbiased predictor of the future spot exchange rate, but other researchers claim the existence of a risk premium. If the foreign exchange expectation relationship holds, there is no reward for bearing foreign exchange uncertainty. Interest rate parity states that in free money markets, the interest rate differential must equal the forward discount or premium, mathematically:. The four parity relationships should be combined in several ways linking the four variables: the interest rate differential, the inflation differential, the forward discount premium, and the exchange rate fluctuation. They indicate that interest rate 29.
(44) differentials reflect expectations about currency fluctuation and exchange risk is reduced to inflation uncertainty. This means that an investor interested in real returns would not be influenced by exchange rate uncertainty. The parity relationships described are a useful framework to analyze intemational monetary variables, but rely on restrictive assumptions about the perfection of trade in money and capital markets. In actuality, future inflation and exchange rates are uncertain, goods cannot be transferred immediately without cost, and there are import/export regulations, discriminatory taxes, and possible restrictive laws for intemational investors that result in frictions. Adler and Dumas (1983) suggest that deviations from parity of individual commodities are a phenomenon in which existing microeconomics research is scarce and inconsistent. Segmentation of the goods market can induce segmentation of capital markets. Foreign exchange market reaction to PPP deviations can be analyzed only when physical events which are being anticipated by the market are made explicit. On the empirical side, tests and measures of the degree and specific sources of segmentation of the intemational capital markets are becoming essential.. b. Stock. Bonds and Exchange Rate The major question is if exchange rate fluctuations affect domestic equity prices, and if so, in what way. Intemational investors who use domestic currency to valué a portfolio measure total return as the sum of returns on the assets in local currencies, plus any exchange rate fluctuation. The investors accept market and 30.
(45) exchange rate risk and the exchange rate fluctuation should be a matter of prime concern for international investors. A primary question is whether stocks and bonds provide a hedge against exchange rate fluctuation. If PPP holds, exchange rate fluctuation simply mirrors relative inflation and international investors do not hold any exchange risk. However, many studies indicate that in the short term the PPP does not hold. This means that real exchange rate fluctuation is a relevant variable to study. Various economic theories have been proposed to explain the influence of real exchange rate fluctuations on domestic economies. Dornbusch (1980) explains that a decline in a currency's real exchange rate tends to improve competitiveness, which creates additional domestic inflation, reduces real income, domestic demand and production. The initial reduction of GNP should be offset by an improvement in international competitiveness and export demand until PPP is restored. The stock market should immediately discount the overall influence on the economy of an exchange rate fluctuation and could be positively or negatively affected depending on whether the short or long-term effect dominates. Lucas (1982) proposes a model where real growth in the domestic market leads to increased demand for the domestic currency. This increase in currency demand causes a rise in the relative valué of the domestic currency. Because domestic stock prices are strongly influenced by real growth, the model justifies a positive association between real stock returns and domestic currency appreciation.. 31.
(46) In the case of bond prices, which are directly linked to long-term interest rates, pnces are explained by the relationship between changes in long-term interest rates and exchange rates. However, Cholerton, Pieraerts, and Solnik (1986), in a study applied to different countries, found both positive and negative correlation between bond prices and exchange rate fluctuations. This could be explained by different monetary policies adopted by different governments. In conclusión, theoretically the relationship between exchange rate fluctuations and stock and bond returns is not clear at this moment.. c. International Asset Pricing A main concern for international investors is what determines asset prices. One main point in this issue is the efficiency of international capital markets. Could active asset allocation among countries consistently outperform the world market index? There is less competition among countries than within a single market and at this point, there is little empirical evidence exploring international efficiency. This issue is analyzed in terms of integration or segmentation. An integrated world financial market would achieve international efficiency, in the sense that arbitrage across markets would not exist. On the other hand, international markets could be segmented. Although each national market could be efficient, numerous factors might prevent international flows from taking advantage of arbitrage opportunities. The main factors on frictions could be: psychological barriers, legal restrictions, transaction costs, discriminatory transactions, political risk and exchange risk. All 32.
(47) these factors tend to reduce intemational capital flows and lead to partial or completely segmented markets. However, the flow of foreign investment has been rapidly growing through the years and it seems that the intemational markets are not fully segmented. The degree of intemational market efficiency is an empirical question that has not yet been answered. Solnik (1974a) is pioneer in intemational asset pricing models. He proposes an equilibrium model of the intemational capital market with the hypothesis that security price behavior is consistent with a single world market concept. He suggests that investors will be indifferent between choosing portfolios from three funds: a portfolio of the world stock market, a portfolio of intemational bonds, and a risk free portfolio of their own country. However, he assumes perfect capital markets, and no constraints on intemational flows. Similarly, the Stulz (1981) model allows differences in consumption opportunity sets across countries. He suggests that real expected excess retums on a risky asset are proportional to the covariance of the retum of that asset with changes in the world real consumption rate. His model also has no barriers to intemational investment. In contrast, several authors have developed intemational equilibrium asset pricing models taking into account different imperfections. Among them are: Black (1974), Errunza and Losq (1985a, 1989), Stapleton and Subrahmanyam (1977), and Eun and Janakiramanan (1986). All the models are complex and so far consensus has not been reached. The risk premium has a more complex function than in the traditional CAPM and depends on the form of market imperfections, relative wealth 33.
(48) of the country investors, the consumption opportunity set, and the parameters of their utility function.. d. Empirical Research Jorion (1991) states that until his study, no one had addressed the problem of empirically measuring whether currency exposure commands a risk premium in the stock market. He performed his test on samples of industry portfolios. He found different exposures to the exchange rate fluctuation within different industries. First he runs a model with two factors: a U.S. market index and an orthogonal component of innovations in a trade-weighted exchange rate. The orthogonalization is essential to avoid spurious pricing of the exchange rate factor because of a possible correlation with a priced market. Jorion also uses the six economic factors postulated by Chen, Roll, and Ross (1986) and the orthogonal component of the exchange rate as a seventh factor. In both models the exchange rate premium is statistically insignificant. In contrast Dumas and Solnik (1995) work with four countries, Germany, the United Kingdom, Japan, and the United States. They use returns in dollars and the U.S. T-bill as a reference for excess returns portfolios for the 1970-1991 period. They conclude that foreign-exchange risk premium is a significant component of secunties rates of return in the intemational financial market and that the intemational APT dominates the classic APT. They suggest that the foreign exchange rate factor is necessary to explain rates of retum on currencies. To check the robustness of their 34.
(49) results they include a bond factor. The reason for the inclusión of the bond factor is that the significance of foreign exchange risk premium in the international APT could be an artifact linked to the large outstanding amount of government bonds which have nominal denominations in dollars. These bonds are in investors' portfolios and should, perhaps, have been included in the market portfolio. It is at least conceivable that the foreign-exchange risk premium is a proxy for a missing bond factor. However, their results suggest that the foreign exchange risk premium cannot be interpreted as a proxy for missing bonds in the market portfolio. Other authors that include the bond factor with the exchange factor are Oexelheim and Wihlborg (1987) and Prasad and Rajan (1995). Early studies (Solnik, 1974b; Stehle, 1977; and Jorion and Schwartz, 1986) shed light on issues of market segmentation between pairs of nations, but they are inconclusive about international market segmentation and neglect the role of exchange risk. Choi and Rajan (1997) made a joint test of market segmentation and exchange risk premium in Canadá, France, Germany, Italy, Japan, Switzerland, and the U.K. for the period of January 1981 to December 1989. They perform a joint test of the segmentation of the world capital markets and the presence of the exchange risk factor along with a multifactor asset return model. In contrast to former papers, they used individual stock price data and jointly consider the role of market segmentation and exchange rate risk. Their findings suggest that: the factor structure of asset returns is generally heterogeneous internationally; many national capital markets can be described as partially segmented or partially integrated rather than the 35.
(50) polar case of complete segmentation or integration; and exchange risk is a significant factor affecting asset returns in addition to the domestic and world market factors in select international capital markets. Hamao (1988) and Brown and Otsuki (1990) examine the Japanese stock market and find that the exchange risk is not priced. Contrasting, Choi, Hikari, and Takezawa (1998) find that exchange rate fluctuations are generally priced in Japan. Using an unconditional model, they prove that the yen/dollar exchange is priced. In addition, they include the bond interest factor and a conditional model to improve the robustness of their experiment. The exchange factor remains significant with all these variants.. e. Summarv There is no clear consensus in the existing published literature about exchange risk. Results depend on the country and the period, since exchange rate fluctuations are sensitive to numerous market frictions and monetary policies. However, recent work of Dumas and Solnik (1995), Choi and Rajan (1997), and Choi, Hikari, and Takewaza (1998) have found that exchange rate risk is priced in several countries using different approaches. It appears that stocks do not correct real exchange rate fluctuations and are therefore a bad monetary hedge. It seems that real exchange rate fluctuations are unpredictable and not short-term adj usted and foreign investors are subject to foreign exchange as well as domestic risks.. 36.
(51) VI. CONCLUSIÓN Asset pricing theory begun in 1964 with Sharpe's CAPM. Several anomalies related to the CAPM were detected in the following years. The size, P/E, BE/ME, leverage, and momentum are the most relevant. So far, asset pricing theory is a topic where no consensus has been reached. Several authors propose that these anomalies are due to risk when priced in a multidimensional framework. The ICAPM of Merton (1973), the APT of Ross (1976), and the empirical work of Fama and French (1992,1993, and 1996) are on this line. Some researchers still defend the CAPM by explaining the anomalies as bias, sample, period used, methodology problems, or conditional versions with time varying betas or time varying premium. There is another line of authors that propose that the market has not been efficient and offered a lot of virtual arbitrage opportunities due to investors' overreactions, fads and irrational behaviors (See Haugen, 1994; De Bond and Thaler, 1995; and Lakonishok, Shleifer and Vishny, 1994). Along a different line of research, the characteristic-based pricing model does not depend on the covariancies matrix, which is the foundation of all the multifactor versions. Daniel and Titman (1997) suggest that the characteristic matters and not the factor beta-loading. A stock earns the "stock" premium even if its return pattern is similar to a bond. This demonstrates that there is no evidence of a sepárate distress factor and that stocks with similar factor sensitivities tend to become distressed at the same time. It appears that characteristics and not factor beta-loadings determine expected returns. The fact that characteristics predict expected returns better than risk 37.
(52) is striking for portfolio analysis, performance evaluation, and corporate finance. Daniel and Titman explain that the reason for their findings could be that investors consistently believed that size and BE/ME ratio were proxies for systematic risk and as a result they demanded higher discount rates on stocks with these characteristics. If this is the case, the patterns observed (1973-1993) will not be repeated in the future. The goal of this paper is to form a pricing model to describe the Mexican stock market in the 1989-1998 period. If international capital markets are completely integrated and peso/dollar exchange rate perfectly correlate with the inflation differential (PPP is always the same in both countries) international financing and investment decisions are essentially the same as domestic ones. México suffered a strong devaluation shock in December 1994 and there are signs of under/over valuation of the peso vs. dollar during this period. The peso/dollar exchange rate is a product of a flexible exchange rate system that suffers short term economic shocks (government controls, restrictions on international capital flows, political risk, transaction costs, information costs, accounting imperfections, and differences in culture and practices of business institutions) that deviate the spot exchange from a fundamental valué that equalizes PPP between both countries. The recent empirical evidence mentioned in this chapter suggests that it is important to consider the exchange rate fluctuation as a source of risk independently of the variant of the pricing model used.. 38.
(53) CHAPTER 3 CHARACTERISTICS AND EMPIRICAL RESEARCH OF THE MEXICAN STOCK MARKET. I. INTRODUCTION The goal of this paper is to explain the return behavior of Mexican stock market. The objective is not to analyze the overall importance of the Mexican stock market in the development of the country. Social contribution, regulatory aspects of the stock market, and other additional factors are not addressed or evaluated. To the reader interested in these topics, the following authors are recommended; for a detailed history of the Mexican stock exchange see Caso (1971, 1986), Aspe (1981), Ortiz (1993a). For a structural analysis see Castaings (1984), and Ejea (1987). For economic development and the emerging capital markets, see Ortiz (1993b), and Errunza (1992). Globalization and NAFTA's influence on the stock market is explored in Ortiz (1993c), and Cabello and Ortiz (1993); inflation and fiscal effects in the securities markets are explored by Gil (1981) and González (1982), and a complete description of the Mexican financial system is in Blanco and Verma(1996). The Arturo Alonso Cassini Library, the library of the Mexican Stock Exchange, contains more than a thousand titles in the fields of economics, finance and securities markets. It also contains a collection of all the works published by the Mexican 39.
(54) Securities Market "Bolsa Mexicana de Valores" (BMV), since 1968. Unfortunately electronic data is only available (depending on the specific information) for shorter periods. Section II pro vides a framework of the history, trading systems, market Índices, and availability of information. The linkage of the securities market, with the Mexican financial system, the limited statistics of the market and regulations are briefly detailed. Section III describes the research conducted on México and the international research that compares México with other countries.. II. THE MEXICAN SECURITIES MARKET The BMV is a prívate institution that operates under a concession from the Minister of Finance and Public Credit (Secretaría de Hacienda y Crédito Público, or SHCP) and is governed by the Securities Market Act. Shareholders consist exclusively of authorized brokerage firms, each of which owns a single share. As of December 1998, there were 33 share-holders. Among them are Merrill Lynch México, Goldman Sachs México, Bankers Trust, and the two huge Mexican financial groups, Bancomer and Banamex. The main purpose of the exchange is to provide the infrastructure and necessary service to effectively process the offering, issuing, and trading of securities. Functions of the BMV are: to provide the physical, administrative and technological infrastructure necessary for the securities market to function properly; and to publish 40.
(55) securities information including information from the trading floor, electronic trading, and any relevant event along with financial information on Usted companies. Administratively, the BMV is responsible for processing securities transactions and transmitting the information to the central securities depository. The BMV is also responsible for overseeing the activities of issuing companies and brokerage firms and insuring compliance with the bylaws and professional code of ethics of the exchange. Lastly, the BMV is to encourage the expansión and competitiveness of the Mexican securities market. The most relevant of these functions for financial researchers is concerned with information processing. Unfortunately, this is one of the weakest points in the Mexican exchange. Hakim (1992) argües that this is the main cause of the scarcity of financial literature on the Mexican market. For instance, the electronic access to stock prices are only available from 1992, foreign investor holdings from 1994, and mutual fund holdings from 1997. With respect to the goal of encouraging the expansión and competitiveness of the Mexican security market, some actions that have been taken on this line are mentioned below, but in fact, in December of 1998, the market capitalization in dollars is less than half of that of December 1993. Therefore, it is not clear whether the Mexican exchange is achieving the goal of expansión and competitiveness. BMV is the headquarters of the organized securities market in México. As such, it does not participate directly in trading or in setting prices but coordinates and regulates the process. Transactions are carried out through the electronic trading, 41.
(56) transaction, registry, and allocation system for equities (SENTRA-CAPITALES). Two business days after a transaction is completed, México's central securities depository (S.D. Indeval) transfers the securities from the selling broker to the buying brokers' firm account. Throughout its development, the BMV has played a key role in México's economic development by channeling savings to productive investments. In this decade, more than 32 billion dollars (Annual Statistics Report, BMV, 1997) in prívate sector financing has been issued through the BMV. As of June 1999, 168 stocks are Usted with a market capitalization of over 137 billion dollars and the valué of stock trading surpassed 34 billion dollars in 1998 (Facts and Figures, BMV, 1998). However, in proportion, the overall importance of the stock market channeling savings to the firms is less than in developed countries such as the U.S., Japan, and Germany.. a. History In 1867, due to the great mining boom, authorities issued the securities brokerage regulatory law. However, the first organized security market in the country, the "Bolsa Nacional de México," did not appear until 1894. Between the original and the current BMV, a succession of institutions have provided facilities for trading securities, but interruptions occurred due to the Mexican revolution and the First World War.. 42.
Figure
+7
Documento similar
This paper adopts a versatile multivariate conditional correlation model to estimate daily seasonality in the returns, the volatility, and the corre- lations between stocks, bonds,
To determine the dendritic and/or axonal nature of the plaque-associated dystrophic neurites in our PS1/APP model, we have performed light and electron microscopy studies in 4-
In order to confirm that the aggregates formed in toluene are compatible with the size expected for a dimer model (about 5 nm in diameter), DOSY NMR experiments were carried out in
By accounting for ANA, using either the stated or inferred approach, model fits are improved compared to the uncorrected model, suggesting that both approaches
The expression ((having become common since the spring)) -the French original reads ((etant devenues populaires des le printems»- refers to the spring of 1708 and is
A catchment model for river basins and a hydrodynamic model were combined in order to simulate the spreading of the turbidity plume produced by sediment discharges from the
The time-varying risk- return relation uncovered using the Markov switching model is in accordance with the state of the economy being positively autocorrelated, cf.. Backus and
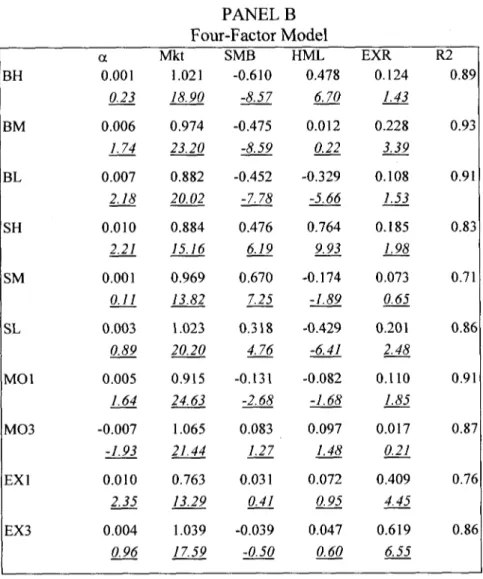
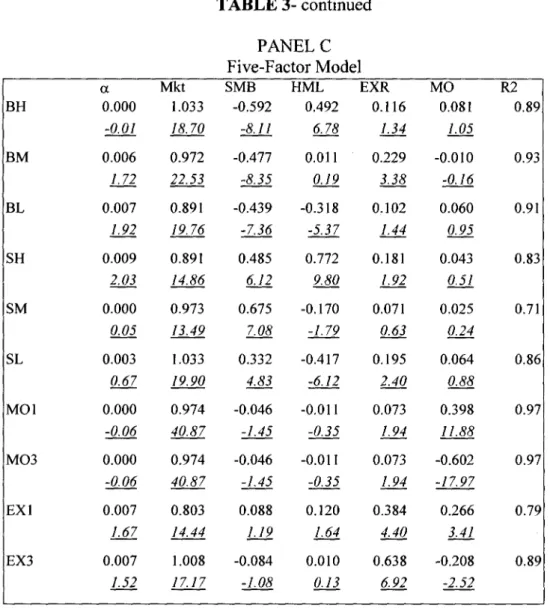
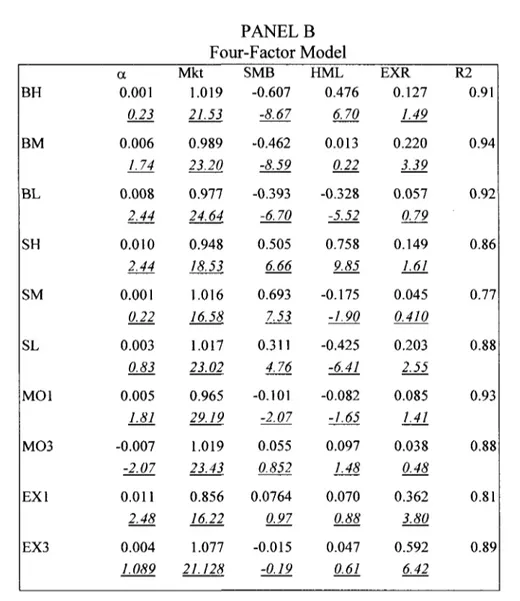
Betas of the market premium factor, the market capitalization factor and the one-year momentum factor are statistically different from cero in the Fama French and Fama French
