four electrons transferred per oxidized 5-HT molecule, agreeing with the mechanism proposed for the dominant electrochemical oxidation reac-tion.16 In NEB cells, the average ( SEM) quantal charge of secretory events during hypoxia was 33.1 2.4 fC [n ¼ 157 events from six cells, range 2.3–183 fC (Fig. 7)]. This value was obtained from the time integral of selected spikes with the fast-rising phase and slow decay typical of secre-tory events occurring at the membrane facing the amperometric electrode. Assuming that one 5-HT molecule contributes an average of four electrons, it is estimated that a single synaptic vesicle or quantum in NEB cells re-leases an average of 13,000 971 (n ¼ 157; six cells) molecules of 5-HT.13 High extracellular Kþ (50 mM) induced a secretory response similar to that elicited by severe hypoxia. Exocytosis was stimulated in normoxic NEB cells after exposure to tetraethylammonium (20 mM) or 4-aminopyridine (2 mM). Hypoxia-induced secretion was abolished by the nonspecific Ca2þchannel blocker, Cd2þ(100M). Secretion was also largely inhibited by the L-type Ca2þchannel blocker, nifedipine (2M), but not by the N-type Ca2þchannel blocker,!-conotoxin GVIA (1M). The 5-HT3 receptor blocker, ICS 205 930, also inhibited secretion from
NEB cells under hypoxia. These results suggest that hypoxia stimulates 5-HT secretion from intact NEBs via the inhibition of Kþchannels and cal-cium entry through L-type Ca2þchannels, as well as by positive feedback activation of 5-HT3autoreceptors.
13
[3] Role of Glutathione Redox State in Oxygen Sensing
by Carotid Body Chemoreceptor Cells
By Constancio Gonzalez, GloriaSanz-Alfayate,
AnaObeso, and MariaTeresa Agapito
Introduction
This article first presents some basic structural traits of the carotid body (CB) arterial chemoreceptors to understand the relationship between the arterial blood PO2 and the activation of chemoreceptor cells, which are
the O2 sensing structures of the CB. Some considerations in relation to
the intensity of CB blood flow and O2consumption of the organ would
allow us to define the threshold for the detection of the hypoxic stimulus, which would lead us to the cardinal theme of the article, namely whether at the PO2levels detected by the CB there alterations in the genesis of
re-active oxygen species (ROS). An alteration in the rate of ROS production [3]
would impinge on the glutathione system [reduced glutathione (GSH) and oxidized glutathione (GSSG)], causing modifications in the GSH/GSSG ratio that are detected by direct measurement; the GSH/GSSG system rep-resents the quantitatively most important mechanism to dispose ROS and to maintain the overall redox status or redox environment in mammalian cells.1The relationship between GSH/GSSG and oxygen chemoreception is approached from two different points of view. We will measure GSH/ GSSG levels and calculate the redox environment of the cells and correl-ation with the activity of chemoreceptor cells in normoxia and in hypoxia. We will also present data on pharmacological manipulation of the redox environment of the cells, as assessed by GSH/GSSG quotients, and pos-sible correlations with the level of activity of chemoreceptor cells. The possible mechanisms of coupling between ROS and the GSH/GSSG system to the cellular effector machineries have been reviewed.2,3
Structure, Blood Flow, Oxygen Consumption, and PO2of Carotid Body Tissue
Carotid bodies are small paired organs, round to pear shaped, located in the proximity of the carotid artery bifurcation, which weigh500g in the cat and50g in the rat; in humans it is estimated that each CB weighs1 and 2 mg. The CB receives sensory innervation via the carotid sinus nerve (CSN), a branch of the IX cranial nerve, by its cephalic pole. The parenchy-matous cells of CB are organized in cluster-separated connective tissue converging on the surface of the organ to form the CB capsule4(Fig. 1). The size of the clusters varies considerably, some have 5–8 cells and others up to 20–30 cells; in any case, chemoreceptor cells, located toward the center of the clusters, exceed glial-like sustentacular cells by a factor of 3–5. In the connective tissue of the organ there is a dense net of capillaries with tortuous trajectories and variable diameters (8 to 20m). This ample vascularization of the CB constitutes the most prominent feature in a section of a well-perfused CB, being 25–33% of the surface of the section occupied by the capillary lumens5 (Fig. 1). The endothelium is thin,
1F. Q. Schaffer and G. R. Buettner,Free Radic. Biol. Med.30,1191 (2001).
2V. J. Thannickal and B. L. Fanburg,Am. J. Physiol. Lung Cell. Mol. Physiol.279,L1005
(2000).
3C. Gonzalez, M. T. Agapito, A. Rocher, G. Sanz-Alfayate, and A. Obeso,in‘‘Oxygen
Sensing: Responses and Adaptation to Hypoxia’’ (S. Lahiriet al.,eds.), p. 489. Dekker, New York, 2003.
4A. Verna, in ‘‘The Carotid Body Chemoreceptors’’ (C. Gonzalez, ed.), p. 1. Springer
Verlag, New York, 1997.
5C. Gonzalez, L. Almaraz, A. Obeso, and C. Gonzalez,Physiol. Rev.74,829 (1994).
sometimes fenestrated, and partially surrounded by pericyte processes. The capillaries resume into venules that emerge from the organ to form a dense venous plexus in the surface of the CB. This rich vascularization determines that the distance from the center of most chemoreceptor cells to capillaries is between 10 and 20m with a median distance of 15.77m from the center of CB cell clusters to the nearest capillary in the adult cat CB.6 Paralleling this ample vascularization, the CB is the organ with the highest blood flow of the organism, 1417 ml/min/100 g tissue, although with discrepancies it is estimated that the O2consumption
in basal conditions is 1.3 ml/min/100 g tissue at a perfusing pressure and PO2in the perfusates (whether blood or saline) of 100 mm Hg.7,8 These
basic data on the vascularization, blood flow, and O2consumption show
that the blood supply and distribution inside the CB have important physiological roles beyond the nutritional requirement. The aforemen-tioned data and in vitrostudies with the saline-superfused preparation of the CB show that the organ can survive, sense, and transduce O2 and
CO2levels just with O2dissolved at a PO2of 100 mm Hg. However, despite
the apparent excess of blood flow in normal CB, there is a further increase Fig. 1. Histological sections near the equator of a rat carotid body. The section was first immunostained using a monoclonal antibody against tyrosine hydroxylase (TH) and a secondary antibody labeled with fluorescein isothiocyanate to label the TH-containing chemoreceptor cells that are grouped in clusters. The section was later counterstained with cresyl violet to show the great density of capillaries in the CB tissue.
6D. W. Lu¨bbers, L. Teckhaus, and E. Seidl, in ‘‘Chemoreception in the Carotid Body’’
(H. Ackeret al.,eds.), p. 62. Springer Verlag, Berlin, 1977.
7W. J. Whalen and P. Nair, in‘‘Physiology of the Peripheral Arterial Chemoreceptors’’
(H. Acker and R. G. O’Regan, eds.), p. 117. Elsevier, Amsterdam, 1983.
8A. Obeso, A. Rocher, B. Herreros, and C. Gonzalez,in‘‘The Carotid Body Chemoreceptors’’
(C. Gonzalez, ed.), p. 31. Springer Verlag, New York, 1997.
in the vascularization of the CB with increased diameters and neoforma-tion of the capillaries in situaneoforma-tions of chronic hypoxia.4 This increase in capillarity reduces the mean distance from capillaries to the border of cell clusters from 3 to 1.8m.4
What is the purpose of this high blood flow? The high blood flow and the increase in vascularization that occurs during chronic hypoxia (acute hyp-oxia produces an important vasodilatation) guarantee that the arteriove-nous difference of O2is very small and, therefore, that CB tissue PO2is
the optimal of the organism at any arterial PO2. Although there are
incon-sistencies in the actual tissue PO2in the CB,8Lu¨bberset al.6calculated that
only about 4% of the PO2values in the CB would be below 40 mm Hg (in
fact, the PO2should be higher because Lu¨bberset al.6used data for the O2
consumption that were four to five times higher than those obtained in more recent studies). In line with those calculations, Whalen and Nair (reviewed in Refs. 7 and 8) found that mean CB tissue PO2 is around
65 mm Hg when perfusing the CB with blood equilibrated at normal PO2
(above 85 mm Hg). Perfused with blood at normal PO2, these authors
found tissue PO2 values below 40 mm Hg in some studies and, when
perfused with blood at PO2in the range of 30–49 mm Hg, the mean CB
tissue PO2 was 20 mm Hg with very few values below 5 mm Hg. Using
air-equilibrated saline solutions to perfuse, they found normal tissue PO2,
validating the empirical observation that the CB functions normally in the saline-superfused preparation. Whalen and Nair7found that the hypoxic threshold for CSN discharge is a CB tissue PO2 oscillating between 50
and 65 mm Hg, the P50 for discharges oscillates between 10 and 32 mm
Hg, and the peak CSN discharge is reached at tissues PO2of 3–5 mm Hg.
These values correspond to arterial PO2 of 70–75 mmHg (threshold),
40 mm Hg (P50), and 10 mm Hg (peak CSN discharges).5 To conclude,
and giving an answer to the question formulated at the beginning of this paragraph, we consider that the high blood flow of the CB and the neovas-cularization occurring in chronic hypoxia tend to show that the CB (which constitutes the origin of a regulatory loop aimed to secure the availability of O2to the organism) receives an adequate O2supply to support its activity.
Activity, however, increases in parallel to the decrease in arterial PO2.
Genesis of ROS and Tissue PO2
From the aforementioned data we can state that the entire range of ac-tivity of chemoreceptor cells occurs at PO2in their near environment at
about 65 mm Hg in normoxia and above 5 mm Hg in situations of extreme hypoxia hardly compatible with life. At lower PO2, CBs are still able to
after the death of experimental animals (the CB has been considered the ‘‘ultimum moriens’’). Questions to be asked include (1) is there a modifica-tion in the rate of ROS producmodifica-tions in the range of PO2where the CB is
activated, (2) what is the mechanism responsible for the modification in the rate of ROS production, and (3) is the modification a cause or conse-quence of chemoreceptor cell activation? At the outset we must state that published experimental data related specifically to chemoreceptor cells are not available.
The first question does not have an univocal answer as evidenced by the dual hypothesis put forward by Joneset al.9referring to hypoxic pulmonary vasoconstriction: ‘‘vasoconstrictive ROS are produced under hypoxia’’ and ‘‘a reduced production of vasodilatory ROS occurs under hypoxia.’’ We3,10 have summarized information on the putative relationship between PO2
and the rate of ROS production. The classical view11,12is that ROS pro-duction occurs in proportion to the available O2, except in situations of
ischemia–reperfusion when xanthine dehydrogenase might be converted into xanthine oxidase by oxidative or proteolytic processes; the new enzyme transfers electrons from the purines directly to O2to form O2.
According to this view, the first hypothesis on O2 sensing in
chemo-receptor cells in considering the participation of ROS assumed that hyp-oxia decreased the rate of ROS production (the same occurred in pulmonary artery smooth muscle cells, which like CB cells are stimulated by hypoxia). A decreased ROS would increase the GSH/GSSG ratio and determine that the O2sensor and additional proteins involved in the
gener-ation of the response to hypoxia were in reduced form (Prot-SH). The re-duction of these proteins would produce activation of the cells and generate the hypoxic responses. Semiquantitative data giving support to this hypothesis were provided by Cross et al.13 using dihydrorodamine 123 fluorescence in the CB and by Archeret al.14 and Weir and Archer15 using lucigenin chemiluminescence in the lung. The decreased ROS pro-duction during hypoxia would result from a putative decrease in the flow of electrons in the mitochondrial respiratory chain and from a decreased
9R. D. Jones, J. T. Hancock, and A. L. Morice,Free Radic. Biol. Med.29,416 (2000). 10C. Gonzalez, G. Sanz-Alfayate, M. T. Agapito, A. Gomez-Nin˜o, A. Rocher, and A. Obeso,
Respir. Physiol. Neurobiol.132,17 (2002).
11B. Chance, H. Sies, and A. Boveris,Physiol. Rev.59,527 (1979).
12B. Halliwell and J. MC. Gutteridge, ‘‘Free Radicals in Biology and Medicine.’’ Oxford
Univ. Press, Oxford, 1999.
13A. R. Cross, L. Henderson, O. T. G. Jones, M. Delpiano, M. A. Hentschel, and H. Acker,
Biochem. J.272,743 (1990).
14S. L. Archer, J. Huang, T. Henry, D. Peterson, and E. K. Weir,Cir. Res.73,1100 (1993). 15E. K. Weir and S. L. Archer,FASEB J.9,183 (1995).
velocity of superoxide (O2 ) formation by a NADPH oxidase similar to the
one present in phagocytes. Consistent with the classical view, it was also observed that the production of ROS in HepG-2 cells decreased with PO2in a very ample range of oxygen pressures.16 More recently Archer et al.17 found that hypoxia (36 mm Hg) decreased ROS production in endothelium-free rings of resistance rat pulmonary arteries from appar-ently two different sources: as hypoxia decreased the production of ROS and diphenylene iodonium (DPI; used as an inhibitor of NADPH oxidase) caused a further decrease in ROS production, ROS would be originated in mitochondria and at the level of NADPH oxidase. The same group18also reported that hypoxia (40 mm Hg) decreased ROS production in pul-monary artery rings, but increased ROS production in renal artery rings (measured as lucigenin chemiluminescence, but measured as 2,7-dichloro-fluorescein fluorescence or by the peroxidase-based AmplexRed kit, hyp-oxia did not alter the production of ROS in renal artery rings). As in the previous study, rotenone (but not myxothiazol) and DPI also inhibited the production of ROS, but curiously enough, antimycin A, which blocks the respiratory chain distally to the quinone pool (the step in the respira-tory chain where most ROS appear to be generated10), also inhibited the production of ROS in pulmonary rings but cyanide did not alter the rate of ROS production in either pulmonary or renal artery rings (in Archer et al.,14 cyanide increased and antimycin A decreased the production of ROS in the lung).
In the opposite view, where hypoxia increased ROS production, Marshall and co-workers19 found that an NADPH oxidase-like enzyme increased ROS production in lung tissue. More recently, the view that hypoxia increases ROS production has been marshaled by Chandel and co-workers who, in different preparations, such as cardiomyocytes,20pulmonary artery smooth muscle cells,21 or alveolar epithelial cells,22 found that hypoxias of intensities in the range of PO2 of 20–30 mm Hg (1.5–3.0%
oxygen-equilibrated solutions) produced increases in ROS levels, measured as
16J. Fandrey, S. Frede, and W. Jemkelmann,Biochem. J.303,507 (1994).
17S. L. Archer, H. L. Reeve, E. Michelakiset al., Proc. Natl. Acad. Sci. USA96,7944 (1999). 18E. D. Michelakis, V. Hampl, A. Nsair, G. Harry, A. Haromy, R. Gurtu, and S. L. Archer,
Cir. Res.90,1307 (2002).
19C. Marshall, A. J. Mamary, A. J. Verhoeven, and B. E. Marshall,Am. J. Respir. Cell Mol.
Biol.15,633 (1996).
20J. Duranteau, N. S. Chandel, A. Kulisz, Z. Shao, and P. T. Schumacker,J. Biol. Chem.273,
11619 (1998).
21G. B. Waypa, N. S. Chandel, and P. T. Schumacker,Circ. Res.88,1259 (2001).
22L. A. Dada, N. S. Chandel, K. M. Ridge, C. Pedemonte, A. M. Bertorello, and J. I. Sznaider,
increased fluorescence due to the oxidation of 20,70-dichlorofluorescein,
ranging from about 30 to 500–1000% above control (perfusion with 15–16% O2). However, the origin of ROS according to Chandel and
co-workers is mitochondrial, being produced mainly at the level of the quin-one pool, because inhibitors of the respiratory chain proximal to this level (exemplified by rotenone and myxothiazol) abolished the hypoxic in-crease of ROS, as well as the responses elicited by hypoxia (but see Refs.
3 and 10), whereas inhibitors distal to the quinone pool (antimycin A, cyanide, azide) augmented ROS levels and mimicked hypoxia. Many of the findings of Chandel group have been contested by other groups23(see Gonzalezet al.3for additional references). Using 20,70-dichlorofluorescein
fluorescence computed from the cells or the tissue sections, Kummer and co-workers also found that hypoxia increased mitochondrial ROS produc-tion in PC12 cells,24decreased ROS in neurons of the nodose ganglion,25 and increased them in pulmonary artery smooth muscle cells,26being also this increase of mitochondrial origin. With a similar method, Killilea and co-workers27reported a 500% increase in ROS production in pulmonary artery smooth muscle cells exposed to25 mm Hg for 1 h.
To the unbiased reader, the collection of data presented in previous paragraphs must seem unintelligible. If it is difficult to accept that hypoxia acting at the mitochondrial level affects the rate of ROS production differ-ently in one cell typevs another, then it is impossible to understand that hypoxia and inhibitors of the proximal vs the distal complexes of the re-spiratory chain decrease ROS production in some laboratories, whereas in other laboratories they act conversely. Where are the pitfalls? Available literature would indicate that the main problems may relate to the methods used to detect ROS. Serious doubts on the meaning of the infor-mation obtained with 2,7-dichlorofluorescein fluorescence have been cast by many authors.28–33 Similar criticisms have been made as to the use of
23N. Enomoto, N. Koshikawa, M. Gassmann, and K. Takenaga, Biochem. Biophys. Res.
Commun.297,346 (2002).
24W. Kummer, B. Hohler, A. Goldenberg, and B. Lange, Adv. Exp. Med. Biol. 475,371
(2000).
25Y. Yamammoto, M. Henrich, R. L. Snipes, and W. Kummer,Brain Res.961,1 (2003). 26R. Paddenberg, B. Ishaq, A. Goldenberg, P. Faulhammer, F. Rose, N. Weissmann, R. C.
Braun-Dullaeus, and W. Kummer, Am. J. Physiol. Lung Cell. Mol. Physiol.284, L710 (2003).
27D. W. Killilea, R. Hester, R. Balczon, P. Babal, and M. N. Gillespie,Am. J. Physiol. Lung
Cell. Mol. Physiol.279,L408 (2000).
28C. Rota, Y. C. Fann, and R. P. Mason,J. Biol. Chem.274,28161 (1999). 29C. Rota, C. F. Chignell, and R. P. Mason,Free Radic. Biol. Med.27,873 (1999). 30W. Jakubowski and G. Bartosz,Cell Biol. Int.24,757 (2000).
31M. j. Burkitt and P. Wardman,Biochem. Biophys. Res. Commun.282,329 (2001).
lucigenin34(see Janiszewskiet al.35for additional references). In addition to those critiques, there is solid evidence that time-dependent light-induced production of ROS may affect the findings enormously.36–38With the use of 2,7-dichlorofluorescein, we have experienced the pitfalls mentioned earlier. The increase in fluorescence detected in short-term cultured chemoreceptor cells was mostly dependent on the parameters of stimula-tion (intensity of the lamp, the time of illuminastimula-tion per frame, and the number of frames per minute), and we could not detect any clear signal that could unequivocally be assigned to hypoxic stimulation. Those findings recommended a turn in our experimental approach to measure GSH/ GSSG as the main determinant of the redox environment of the cells.
The answer to the first question is that we do not know if hypoxia in-creases or dein-creases the rate of ROS production. Regarding the second question, that is, the mechanism responsible for the alteration in ROS pro-duction, we must make a double assumption. The initial assumption would be that hypoxia decreases the rate of ROS production both at the level of mitochondria, because ROS production parallels PO2 at the respiratory
chain,10,39 and at the level of NADPH oxidase, because the decrease in PO2and the Km of the enzyme would make the oxidase work at a lower
rate and to produce less ROS.13Using dihydrorodamine 123 fluorescence, Crosset al.13found a decrease in fluorescence during hypoxia and favored the notion that the decrease in ROS levels was due to a decrease in the ac-tivity of NADPH oxidase. However, data from our laboratory showed that inhibition of this oxidase does not prevent the detection and the genesis of a normal response to hypoxia in chemoreceptor cells of the rat or rabbit.40 However, a minor modulatory role for NADPH-derived ROS could not be excluded from our study. Our second assumption would be that hypoxia in-creases ROS. The authors concluded that the weight of the literature sup-ports the notion that mitochondria cannot be the source of those increased levels of ROS production. In the ranges of PO2 (and probably even at
32S. I. Liochev and I. Fridovich,J. Biol. Chem.276,35253 (2001). 33J. L. Brubacher and N. C. Bols,J. Immunol. Methods251,81 (2001). 34S. I. Liochev and I. Fridovich,Arch. Biochem. Biophys.337,115 (1997).
35M. Janiszewski, H. P. Souza, X. Liu, M. A. Pedro, J. L. Zweier, and F. R. Laurindo,Free
Radic. Biol. Med.32,446 (2002).
36P. E. Hockberger, T. A. Skimina, V. E. Centonze, C. Levin, S. Chu, S. Dadras, J. K. Reddy,
and J. G. White,Proc. Natl. Acad. Sci. USA96,6255 (1999).
37M. Afzal, S. Matsugo, M. Sasai, B. Xu, K. Aoyama, and T. Takeuchi,Biochem. Biophys.
Res. Commun.304,619 (2003).
38P. Bilski, A. G. Belanger, and C. F. Chignell,Free Radic. Biol. Med.33,938 (2002). 39L. E. Costa, S. Llesuy, and A. Boveris,Am. J. Physiol.264,C1395 (1993).
40A. Obeso, A. Gomez-Nin˜o, and C. Gonzalez,Am. J. Physiol.276,C593 (1999).
lower PO2) where the CB works, there is no limitation in the availability
of O2to accept the electrons flowing through the respiratory chain due to
the great affinity for O2of cytochrome oxidase.38–43As stated explicitly by
several authors, mitochondria with the physiologically available substrates for oxidation do not release measurable levels of ROS (even less than the 1–3% of the consumed O2as classically suggested
11
) unless the respiratory chain is inhibited to build up reduced forms of the initial mitochondrial complexes and unless there is O2available. The most plausible explanation
of the observed increased rate of ROS production by mitochondria would be the result of unspecific interactions between the dyes used to measure ROS and mitochondria.41,43The proposal made by Staniek and Nohl41that mitochondrial respiration seems not to be required as permanent sources of ROS for physiological activities, such as cell signaling, gains full support from studies of several groups showing that hypoxia-inducible factor-dependent gene expression23(see Gonzalezet al.3for additional references), as well as acute membrane-linked O2chemoreception in a model of airway
chemoreceptors,44 takes place in cells lacking functional mitochondria (o cells). It is of special relevance for this article that the observation of the first known effector in the oxygen chemoreception cascade, represented by specific Kþ currents, is inhibited in an identical percentage and with an identical time course in control and o H146 cells. Staniek and Nohl41 also proposed that it is more likely that any ROS involved in the physio-logical function of cell signaling is produced in specific compartments in the vicinity of the effector molecules. This microdomain-centered produc-tion of ROS would have two purposes: (1) to avoid inflicting unnecessary damage and activation of alternative pathways and (2) to be effective in reaching the target before the ROS are inactivated by the scavenging mechanisms of the cells.
Excluding mitochondria as the source of ROS at the hypoxic levels, which activate the CB chemoreceptors physiologically, where could ROS be generated if we stay with the assumption that hypoxia increases ROS production? Potential sources of ROS during hypoxia in mammalian cells include smooth endoplasmic reticulum-oxidizing enzymes that use the cyto-chrome P450 andb5electron transport chain, microsomal cyclooxygenases
and cytoplasmic lipooxygenases, and the leucocyte-type NADPH-oxidase system.10,12 Although some suggestions have been made regarding the
41K. Staniek and H. Nohl,Biochim. Biophys. Acta1460,268 (2000).
42E. Gnaiger, G. Mendez, and S. C. Hand,Proc. Natl. Acad. Sci. USA97,11080 (2000). 43J. St-Pierre, J. A. Buckingham, S. J. Roebuck, and M. D. Brand,J. Biol. Chem.277,44780
(2002).
44G. J. Searle, M. E. Hartness, R. Hoareau, C. Peers, and P. J. Kemp,Biochem. Biophys. Res.
Commun.291,332 (2002).
potential role of cytochrome P450-dependent systems in hypoxic signaling, they were based on the use of inhibitors of this cytochrome that later proved to be direct inhibitors of Kþchannels. Phospholipase A2, the arachidonic
acid-releasing enzyme, is Ca2þdependent and thereby the entire process of prostaglandin, thromboxane, and leukotriene synthesis by cyclooxy-genases and lipooxycyclooxy-genases also becomes Ca2þdependent. Therefore, it is possible that the primary activation of chemoreceptor cells occurs by a mechanism unrelated to ROS, leading to an increase in [Ca2þ]iand to an
increase in formation of the lipidic second messengers and ROS, both capable of modulating the ongoing chemoreceptor cell activity. The case for prostaglandin has been proved by Gomez-Nin˜o et al.45,46 by showing that hypoxia increases the production of PGE2and that this prostaglandin
inhibited, in a dose-dependent manner, the Ca2þcurrents and the release of neurotransmitters elicited by hypoxia in chemoreceptor cells. Finally, NADPH oxidase, a multienzymatic complex responsible for the oxidative burst and the genesis of ROS used by phagocytes to destroy bacteria and fungi, has been found to be a very ubiquitous enzymatic complex with several isoforms in many tissues.47,48The phagocytic multienzymatic com-plex has two subunits (gp91phoxand p22phox) located in the plasma mem-brane and three cytoplasmic subunits (p67phox, p47phox, and p40phox) that, with the concurrence of two low molecular weight GTP-binding proteins, assemble in the membrane to form the active enzymatic complex. Interestingly, several isoforms of the enzyme are activated by Ca2þand, con-trary to the phagocytic enzyme, they exist already as preassembled enzymes associated with the cytoskeleton, providing a means to produce ROS in par-ticular microdomains of the cells.49Available data suggest that an isoform of NADPH oxidase could modulate, but not trigger, CB chemoreceptor activity, as knockouts of p47phoxsubunits exhibit a greater ventilatory and CSN response to hypoxia than wild-type animals.50These findings suggest that the NADPH oxidase-mediated generation of ROS is activated during hypoxia and that ROS modulate the chemoreception process negatively.
The third question formulated at the outset of this section was if the pre-sumptive alteration of ROS during hypoxia was a cause or consequence of CB chemoreceptor activation. As mentioned in the preceding paragraphs,
45A. Gomez Nin˜o, L. Almaraz, and C. Gonzalez,J. Physiol.476,257 (1994).
46A. Gomez Nin˜o, J. R. Lopez-Lopez, L. Almaraz, and C. Gonzalez,J. Physiol.476,269
(1994).
47K. K. Griendling, D. Sorescu, and M. Ushio-Fukai,Circ. Res.86,494 (2000). 48J. D. Lambeth,Curr. Opin. Hematol.9,11 (2002).
49J. M. Li and A. M. Shah,J. Biol. Chem.277,19952 (2002).
50K. A. Sanders, K. M. Sundar, L. He, B. Dinger, S. Fidone, and J. R. Hoidal, J. Appl.
data of Obesoet al.40and Sanderset al.50indicate that ROS could be modu-lators, but not triggers, of the CB chemoreceptor response to hypoxia. In the same direction, data of Sanz-Alfayateet al.51showed that the GSH precur-sor and the ROS scavenger N-acetylcysteine did not affect normoxic nor hypoxic activity in chemoreceptor cells, implying that intracellular ROS levels, whether increased or decreased by hypoxia, do not participate in setting the response of chemoreceptor cells.
ROS and the GSH/GSSG System
Except for their role in phagocytes, ROS have classically been con-sidered damaging by-products of the metabolism; therefore, research has been oriented to characterize the defense mechanisms against the oxidative damage produced by ROS. Along these lines have been described3,10,12 (1) the metabolic processes producers of ROS; (2) many toxic-damaging reactions of ROS with lipids, proteins, and nucleic acids, and (3) several en-zymatic systems and a group of small molecules that serve a protective function against oxidative damage in vivo,that is, they act as scavengers of ROS. The recognition of ROS as presumptive physiological signaling molecules has expanded the inventory of reactions produced by ROS. It is evident, however, that if ROS have to function as second messengers, a competition between scavengers and physiological targets of ROS must occur, although the compartmentalized production (and scavenging) of ROS would reduce such competition. Finally, if ROS function as second messengers, they must be disposed to terminate signaling; presumably, the same systems controlling the oxidative damage are responsible for the disposal of ROS to terminate the signal. These considerations demon-strate the need to know the metabolic pathways of ROS to understand the role of ROS in cell signaling and to make predictions on the modifications in cellular responses mediated by ROS when the redox environment of the cells1is altered experimentally.
ROS species derived directly from normal metabolism are basically limited to O2 (oxygen transport, respiratory chain, cytochrome
P450-using enzymes, NADPH oxidase, cyclooxygenase, and lipooxygenase), H2O2(in reactions catalyzed by peroxixomal oxidases and monoamino
oxi-dase), and NO(synthesized by several isoforms of nitric oxide synthase), plus some OH(hydroxyl radical) generated on the surface of the organism by the homolytic action of UV light on H2O2(H2O2!2 OH) or in any
part of the organism by the radiolysis of water by high-energy radiation
51G. Sanz-Alfayate, A. Obeso, M. T. Agapito, and C. Gonzalez,J. Physiol.537,209 (2001).
(H2O!OHþH). The superoxide radical, O2, is no doubt the
quanti-tatively most relevant primary ROS capable of reacting with many molecules to generate altered structures and new secondary ROS; specific enzymatic systems (superoxide dismutases) have been developed to dis-pose O2 by transformation into H2O2, which is considerably less reactive
(see later). However, H2O2 can be decomposed by ultraviolet light in 2
OHand can react with transition metals in their reduced form (Fenton reaction) to yield OHþOHþoxidized metal. OHis the most harmful ROS due to its high oxidizing power (reduction potential ¼ 1900 mV), which makes it cable of attacking and removing one electron from many molecules (e.g., lipids), transforming the attacked molecules in radicals, which in turn are capable of continuing a destructive chain reaction until some scavenger molecule is capable of reacting with the radical and stops the reaction. In many of these secondary reactions, new ROS species, in-cluding H2O2, can appear. The Fenton reaction in healthy biological
systems is kept to a minimum: transition metals are at very low concentra-tions as free molecules; they are usually complexed with proteins to limit their reactivity. The potential harm of H2O2explains the existence of
sev-eral enzymes aimed to dispose H2O2. This article does not deal with NO.
The physiologically more relevant protective molecules, or ROS scav-engers, include vitamin E, ascorbic acid, and lipoic acid. All of them are able to react with several ROS species, including lipid peroxides, being transformed in molecular species that are either radicals with low reactivity or molecules lacking redox reactivity that may be degraded or recycled back to active scavengers by the action of enzymes systems. For example, ascorbate can react with O2 or with Prot-TyrO radicals to form the
poorly reactive semidehydroascorbate capable nonetheless of transferring an additional electron to another more oxidant radical, inactivating it, and becoming dehydroascorbate, which is unreactive. Dehydroascorbate can be degraded and lost, implying a depletion of ascorbate, or can be re-cycled enzymatically by the GSH-dependent dehydroascorbate reduc-tase.12 Comparable reactions occur with vitamin E, probably the most important antioxidant, physiologically speaking, and with lipoic acid. All three antioxidants can react among them and regenerate each other: for example, a deficit of vitamin E can be covered partially by vitamin C (ascorbate), and glutathione reductase and thioredoxin reductase can act on lipoic acid to reduce it back into dihydrolipoic acid.
The enzyme systems devoted to eliminate ROS include superoxide dis-mutases, peroxidases, and catalase. Being O2 the most important ROS
This cytoplasmic form is located not only free in the cell cytoplasm, but in various organellae, including lysosomes, nucleus, peroxisomes, and the in-termembrane space of the mitochondria. This last location would represent a mechanism of defense against a fraction of O2 produced in the
mito-chondria and released to this space.43In extracellular fluids, there is a se-creted form of copper-zinc dismutase with a higher molecular weight and with a tetrameric composition instead of the dimeric of the cellular enzymes. In the reaction that they catalyze, the metal (copper or manganese; zinc serves a noncatalytic enzyme-stabilizing function) acts sequentially as an acceptor and as a donor of one electron with the final result of the elimin-ation of two molecules of O2 and the genesis of a molecule of O2 and
another of H2O2, as shown for the manganese superoxide dismutase:
Enz-Mn3þþO2 !Enz-Mn2þþO2 Enz-Mn2þþ2HþþO2!Enz-Mn3þþH2O2
(1)
Having transformed O2 into H2O2, which somehow represents the
common final path of all ROS,3,10 we need to know how cells prevent H2O2-damaging effects. Cells rely on two different enzymatic systems,
namely catalases and peroxidases, with variable relative significance in dif-ferent tissues. In animal cells, catalases are enzymes that are located mainly in peroxisomes, where many oxidases are also located and H2O2is
gener-ated physiologically. It catalyzes the decomposition of H2O2into water and
molecular O2(2H2O2!2H2OþO2). Catalases are tetrameric
hemopro-teins with the ferric hemogroup buried in a pocket like that of hemoglobin capable of limiting the accessibility of large molecules. The enzymatic reaction occurs in two steps with a similar rate constant: in the first step, the ferric ion of hemo is oxidized by H2O2to Fe5þ(being H2O2itself
re-duced to H2O) and the entire catalase subunit, called compound I in this
oxidized state, acquires spectral absorbance characteristics that allow measurement of the catalase-catalyzed reactions in intact cell systems. In the second step, compound I oxidizes a second H2O2to H2O þ O2 and
ferric catalase is regenerated.12,52Peroxidases catalyze the decomposition of H2O2by oxidizing another substrate (SH2þH2O2!Sþ2H2O). Aside
from tissue-specific peroxidases,12glutathione peroxidase and thioredoxin peroxidase are present in essentially all mammalian cells and serve a homeostatic role in the maintenance of their redox environment. Thiore-doxin, a small cysteine-rich protein molecule with several isoforms ranging from 12 to 32 kDa, is a cofactor for ribonucleotide reductase that catalyzes
52M. S. Wolin,Arterioscler. Thromb. Vasc. Boil.20,1430 (2000).
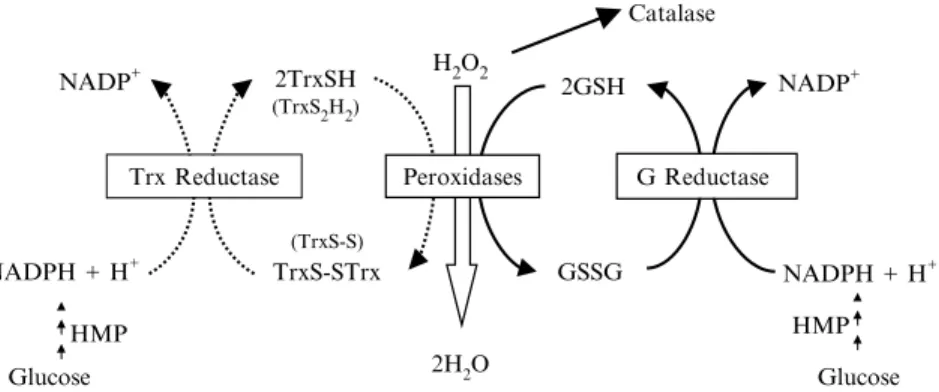
the conversion of ribonucleotides to deoxyribonucleotides, regulates the activity of several transcription factors, and acts as a growth factor.53 Add-itionally, it also plays an antioxidant role by being the substrate of a cycle of redox reactions catalyzed by thioredoxin peroxidase and thioredoxin re-ductase. The glutathione couple, GSH/GSSG, and the correspondent per-oxidase and reductase constitute the main antioxidant system of cells responsible for the maintenance of a reduced intracellular environment1 (Fig. 2). Both peroxidases react with H2O2, but they can also react with
other peroxides, such as fatty acid hydroperoxides. Although the intimate mechanisms of reaction are different (in the reaction catalyzed by glu-tathione peroxidase, a selenium located in the active center participates, and thioredoxin peroxidase does not contain a catalytic selenium), both peroxidases reduce the peroxides to alcohols and two SH groups from two reduced molecules of glutathione or thioredoxin are oxidized to form a SSbond that, in the case of thioredoxin, can be intra- or intermo-lecular. The resulting oxidized forms of the two redox pairs are back reduced to restore their capacity as antioxidants by the action of the corres-pondent reductases that use NADPH þHþ(as donors of equivalents of reduction) provided by the hexose monophosphate pathway (Fig. 2). The glutathione and thioredoxin antioxidant systems are interrelated through the correspondent NADPHþHþ-dependent reductases so that a thermo-dynamic connection exists among the three redox couples in the cells. Thus, the redox status of the cells is defined by the three interrelated redox pairs. It should be noted that despite the parallelisms between GSH and
53G. Powis and W. R. Monfort,Annu. Rev. Pharmacol.41,261 (2001).
H2O2
Catalase
2GSH
GSSG
NADP+
NADPH + H+
Glucose HMP 2TrxSH
NADP+
NADPH + H+ TrxS-STrx
2H2O Glucose
HMP
G Reductase (TrxS2H2)
(TrxS-S)
Trx Reductase Peroxidases
Fig. 2. Glutathione and thioredoxin peroxidase and reductase systems. TrxSH and TrxS2H2, reduced thioredoxin; TrxS-S and TrxS-STrx, oxidized thioredoxin with
intra-and intermolecular disulfide bonds. GSH intra-and GSSG, reduced intra-and oxidized glutathione, respectively; HMP, hexomonophosphate pathway.
thioredoxin antioxidant systems and despite the fact that they have similar reducing ability (similar standard redox potential), the limited availability of thioredoxin, (about 6 nMin plasma and 2–12Min tissues), in compari-son to the GSH/GSSG system (about 1–5 Min plasma and 0.5 to 10 mM in tissues), makes the thioredoxin system a relatively small significance in the overall maintenance of the reduced environment of the cells.1
The redox potential of any redox pair in the cells depends on its stand-ard redox potential and on the ratio of the concentrations of the reduced and oxidized forms of the pair following the Nernst equation. However, the reducing capacity of a redox pair depends on the concentration of the reduced form of this particular redox pair. The standard redox poten-tial of a redox pair defines the easiness or intrinsic tendency of the reduced form to donate equivalents of reduction (the more negative the standard redox potential, the greater the tendency to donate electrons), but if the concentration of the reduced form of a particular redox pair is small, its capacity to reduce is very small because it will be exhausted in a few cycles of reduction. The product of the standard redox potential times the concentration of the reduced member of a redox pair in the cells deter-mines the ‘‘quality’’ (qualityability to maintain the cell interior in a re-duced form) of the redox pair in any cell system. Then, the redox state of all the interrelated redox pairs of the cells, calledthe redox environment of the cellsby Schafer and Buettner,1would be
Redox environment¼E1 ½reduced form pair 1 þ. . .
of the cell response to the stimulus activates the production of ROS and the subsequent oxidation of GSH with the decrease in its redox potential. The converse would also be true. These considerations also imply that the glu-tathione peroxidase/gluglu-tathione reductase system, together with catalase, is responsible for the elimination of H2O2, which represents the common
final path of all ROS in the cells. It should be recalled, however, that the congenital absence of catalase does not cause serious clinical problems,12 indicating that the glutathione peroxidase system may suffice to eliminate H2O2 when produced at normal physiological rates. The necessity for
catalase only becomes evident when there is an extra production of H2O2.
Another consideration of relevant physiological and pathophysiological significance is that all the enzyme systems involved in the disposal of ROS (superoxide dismutase, glutation and thioredoxin peroxidases and reduc-tases, and catalase and thioredoxin itself) are up- and downregulated as a function of the rate of production of ROS.38,54–56Additionally, in general terms, the level of activity of these enzymes in some species or strains of animals versus others or in different developmental periods correlates directly with their resistance to the oxidative insults.57
Finally, the definition of a correct correlation between GSH levels measured experimentally and any given cellular function needs some more considerations.Figure 2shows a 2:1 molar ratio in the utilization of GSH per mole of H2O2removed. Knowing that cells consume O2at a rate of 1 mmol/kg/min or less, that ROS production is around 0.01–0.03 mmol/ kg/min (i.e., 1–3% of the O2 consumed), and that the concentration of
GSH in the cells is >1 mmol/kg, it follows that to decrease GSH levels significantly in a scale of minutes, a large burst of ROS production would be required. This decrease would even be minimized by the NADPH-dependent cycling of GSSG back to GSH produced by glutathione reduc-tase. In other words, the high redox buffer power of GSH tends to prevent large changes of the redox environment of the cells to preserve the func-tionality of the cells. This in turn implies that when stimulation of a cell system alters the ‘‘redox status’’ or redox environment of the cells, the stimulus causes a dramatic change in the rate of production of ROS in the cells. If in a situation of increased ROS production, glutathione reduc-tase is unable of cycling back to GSH the extra amount of GSSG produced, we would assist a time-dependent decrease in GSH and a tendency of
54L. Frank,Fed. Proc.44,2328 (1985).
55D. Mustacich and G. Powis,Biochem. J.346,1 (2000).
56S. Hoshida, N. Yamashita, K. Otsu, and M. Hori,J. Am. Coll. Cardiol.40,826 (2002). 57M. A. Hass and D. Massoro,Am. J. Physiol.253,C66 (1987).
GSSG to increase, and therefore, to a decrease of the redox environment of cell according to the equation (at 37):
Redox environmentðmVÞ EGSH¼ 24030:75 log½GSH2=½GSSG
(3) However, as soon as GSSG starts to increase, cells export GSSG1; this release or leak of GSSG aims to avoid an intracellular accumulation of high concentrations of GSSG and therefore intends to maintain an adequate GSH/GSSG ratio and a redox environment as constant as possible inside the cells. Of course the cost of this is a loss of redox buffer capacity with a net tendency to decrease in GSH. Additional information to consider for the correct evaluation of the correlation between GSH and ROS signal-ing is that the turnover of GSH seems to be rather slow, as it is required to inhibit glutathione synthesis for long periods of time to deplete GSH levels significantly in the cells. For example, the inhibition of glutamylcysteine synthetase (the first enzyme in glutathione biosynthesis) with buthionine sulfoximine at concentrations of 100 and 200M reduced in 24 h the GSH content by the same percentage (75%) in lens cells in culture,58 and at 200 M depleted at a constant rate of about 10%/h during 5 h.59 This in turn reflects the fact that the rate (mole/min) of ROS production by cells is small. In sum, these considerations would suggest that under physiological stimulation of any cell system it should not be surprising to see only minor changes or no measurable changes in the GSH/GSSG system and in the redox environment of the cells. Additionally, imposed experimental alterations of the GSH/GSSG system aimed at mimicking a strong stimulation should not produce very dramatic changes, otherwise we would bring the redox environment of the cells to levels only observed in pathologic situations.
The presumable existence of compartmentalized microdomains in the production of ROS induced by specific stimulus in the near vicinity of sensing and effector molecules41would impose a completely different set of considerations. Under this scope, it would be conceivable that the stimu-lus produces a dramatic increase in ROS production in a specific cell com-partment, and therefore that there is a local dramatic alteration of the redox environment of the cells without a large change in the overall intra-cellular redox environment. In these physiological circumstances, we should expect only minor changes (or no changes) in the bulk levels of the GSH/GSSG pair or in its redox potential as measured, for example,
58F. Shang, M. Lu, B. Dudek, J. Reddan, and A. Taylor,Free Radic. Biol. Med.34,521 (2003). 59S. Sinbandhit-Tricot, J. Cillard, M. Chevanne, I. Morel, P. Cillard, and O. Sergent,Free
Radic. Biol. Med.34,1283 (2003).
in a tissue homogenate. Additionally, experimental maneuvers aimed to alter the GSH system, and through it the redox environment of the cells to mimic physiological stimulation, would tend to be rather unspecific because they would alter the entire redox environment of the cells without the precise spatial (and temporal) coordinates of the physiological stimulus.
Experimental Methods
Measurement of Glutathione
In the present study we measured GSH and GSSG in quarters of rat diaphragm in all experimental conditions here. A previous study51 meas-ured GSH/GSSG in calf CB, but the experiments proved to be enormously time-consuming and inconvenient because around 40–50 mg of tissue equivalent to four to five calf CBs was needed and, in addition, the crisis of mad cows restricted access to the slaughterhouse. Selection of the rat diaphragm as the test tissue to evaluate the effects of hypoxia and other ex-perimental treatments is due to the fact that the diaphragm is a sheet of tissue comparable in thickness to the rabbit CB (<1 mm), therefore pre-senting no problems for gas and drug diffusion to the interior of the tissue. Therefore, most of our experiments compare data on GSH/GSSG content in the diaphragm with data on the activity of chemoreceptor cells obtain-ed in the rabbit CB treatobtain-ed identically to diaphragms. In some occasions, we also used liver and brain tissue to test the effects of specific drugs and compared findings in the diaphragm.
Removal and Incubation of Tissues. Wistar rats with a 250- to 300-g body weight are anesthetized with sodium pentobarbital (60 mg/kg; ip). After an incision in the abdomen, the entire diaphragm is removed care-fully, clamping as needed to avoid bleeding. Animals are killed by an intra-cardiac overdose of sodium pentobarbital. All measures are taken to prevent distress in the animals. The Committee for Animal Care and Use at the University of Valladolid approved the protocols. The diaphragm is freed of blood by washing in ice-cold 100% O2-saturated Tyrode (in mM:
NaCl, 140; KCl, 5; CaCl2, 2; MgCl2, 1.1; glucose, 5.5; HEPES, 10; pH 7.40
with 1NNaOH). Under a dissecting microscope, small pieces of fat, small vessels, and phrenic tendon are eliminated, and the diaphragm is cut in to four quadrants of comparable size.
bubbled constantly with water-saturated 5% CO2-containing gas mixtures.
All pieces are incubated for 30 min while bubbling with 21% O2/5% CO2
to allow the tissues to recover from the trauma of the surgical proced-ures60; thereafter the incubating solutions are renewed every 10 min for up to 40 min. In control tissues, the renewing solution is 21% O2/5%
CO2-equilibrated bicarbonate Tyrode, in hypoxic tissues the last 10-min
incubating period the solution is equilibrated, and the vials are bubbled continuously with 7% O2/5% CO2. In drug-treated tissues the solutions are
equilibrated and the vials are bubbled continuously with 21% O2/5%
CO2and contain (from 0 to 40 min) 0.050 mM p
-chloromercurybenzosul-fonate (PCMBS) sodium salt, 0.5 mM carmustine [1,3-bis(2-chloroethyl)-nitrosourea; BCNU], 2 mM N-acetylcysteine (NAC), or 0.2 mMdiamide (DIA). Incubation time does not modify GSH or GSSG levels for up to 80 min (Fig. 3). At the end of the incubation the tissues are transferred to new vials kept at 0–4 containing 10 ml of Tyrode equilibrated with 100% O2 for 5 min, dry blotted by touch on filter paper, weighed, and
placed in Eppendorf tubes containing a solution of 5-sulfosalicylic acid (SSA) at 5% and 0.25 mM EDTA (at 4 it is stable for months) whose volume is adjusted to five times the weight of the tissue. The tissues are stored at80 until the day of the assay or are immediately glass-to-glass homogenized at 0–4 and centrifuged in a microfuge (4, 10 min) and the supernatant is used to measure GSH/GSSG. The assay can be performed
60A. Obeso, L. Almaraz, and C. Gonzalez,Brain Res.371,25 (1986).
0 0.1 0.2 0.3 0.4 0.5 0.6 0.7 0.8
GSt GSSG GSH
m
mol/g tissue
10 min
20 min
40 min
80 min
−190
−180
−170
−160
−150
−140
Potential
mV
Fig. 3. Effects of duration of incubation on levels of GSt (total glutathione), GSSG, GSH, and GSH/GSSG redox potential.
immediately or the supernatant can be stored at80C until assay. No dif-ferences have been observed whether the tissues or the supernatants are stored for up to 1 month at80 (Table I).
Assay for GSH and GSSG. The measurement of GSH and GSSG is made by the method of Griffith.61 GSH reacts spontaneously with 5,50
-dithiobis-(2-nitrobenzoic acid) (DTNB) to generate GSSG and 5-thio-2-nitrobenzoic acid (TNB; peak absorbance at 412 nm). The GSSG formed is reduced enzymatically to GSH by glutathione reductase coupled to NADPH oxidation. In this cycling assay, concentrations of DTNB, NADPH, and glutathione reductase are chosen so that the rate of color for-mation followed with a spectrophotometer is linear with time for 2–3 min and the slope of the line relating the increase of absorbance and time (
absorbance/time, min;A/t, min) is directly proportional to the con-centration of total glutathione (GSH þ GSSG; GSt) in the sample. The plot of the slopes of these lines as a function of the concentration of GSt in the samples is also linear for an ample range of concentrations and de-fines the standard curves used to determine the concentrations of GSt in the problem samples by interpolation. GSSG is measured identically, but first the GSH present in the samples is masked by derivatization with 2-vinylpyridine. The size of the sample is higher due to the usually much lower concentration of GSSG than GSH. In all instances (construction of standard curves and tissue homogenates), the assays are made by tripli-cate. The assay is highly specific, due to the enzymatic step, and is highly sensitive due to cycling; the sensitivity of this colorimetric method is in the range of 1010mol/assay.
TABLE I
GlutathioneLevels inSupernatants ofHomogenates ofRatDiaphragmAssayed Immediately orafterStorage for1 Month at80a
Supernatant conditions
Total glutathione (M/g tissue)
GSSG (M/g tissue)
GSH (M/g tissue)
Gltutathione redox potential (mV)
Assayed immediately 0.5330.014 (n¼41)
0.0440.002 (n¼41)
0.4890.014 (n¼41)
179.91.1 (n¼41) Assayed after frozen
(80) for 1 month
0.5490.018 (n¼23)
0.0480.002 (n¼23)
0.5000.015 (n¼23)
179.10.8 (n¼23)
aThe 41 samples of tissue used for the assay immediately after obtaining came from 20
different animals, whereas those used to be frozen were obtained from 11 rats. GSSG levels are expressed as GSH, i.e., the actual concentration of GSSG is half because each molecule of GSSG yields two molecules of GSH (see calculations in the text).
61O. W. Griffith,Anal. Biochem.106,207 (1980).
Solutions. The description that follows corresponds to a typical
working day that includes 12–16 tissue samples to be determined by tripli-cate plus the standard curves for GSt and GSSG, also in triplitripli-cate. Some stock solutions can be prepared and, if stored conveniently, can be used for months. Stock solutions include
. A stock buffer solution of 125 mM sodium phosphate buffer containing 6.30 mMdisodium EDTA (pH¼7.50) is maintained at 4 (1 liter).
. A stock solution of 100 mMof GSH in distilled water is aliquoted (0.1 ml) in Eppendorf tubes and maintained at20.
. A stock solution of 6 mMDTNB in stock buffer and maintained at
20 is aliquoted in 5-ml plastic tubes.
. 2-Vinyl pyridine (Aldrich) is stored at 20 as provided by the supplier and can be used (usually by several months) until it starts to acquire a yellow tinge (5 ml).
. Triethanolamine (Sigma) undiluted is maintained at room tempera-ture (100 ml).
The rest of the solutions are prepared daily and include
. 4.31% SSA solution by diluting with water the 5% SSAþ0.25 mM EDTA solution used to homogenate the tissues (2 ml of SSA at 5%
þ0.32 ml water).
. 0.3 mMNADPH (Sigma) in the stock buffer (100 ml).
. GSH standard solution: the 100 mMGSH stock solution (100 l) is diluted to 0.5 mMwith the 5% SSAþ0.25 mMEDTA solution to construct the standard curves for GSt.
. GSSG standard solution: the 100 mMGSH stock solution (100 l) is diluted to 0.1 mMGSH with the 5% SSAþ0.25 mMEDTA solution to construct the standard curves for GSSG; alternatively, it can be prepared from a solution 0.05 mMGSSG in identical conditions.
. 1 unit of GSSG reductase (GR; Sigma)/5l in stock buffer (1 ml). Procedure. The assay of GSt in the test samples is performed as
follows. For the first sample of the run, the cuvette of the spectrophotom-eter is placed in a bath at 37 before addition of the assay mixture (700l of the NADPH solutionþ100 l of DTNB solutionþ195l of H2O þ
Additional samples are prewarmed in Eppendorf tubes, and the enzyme is added on transference of the assay mixture to the cuvette immediately prior to starting the recording of absorbances. During this warming period, the assay mixture acquires a yellowish tinge due to the reduction of a small fraction DTNB produced by the GSH present in the sample that is transformed into GSSG, but the real development of color occurs when the reductase is added and GSSG is cycled back to GSH with many cycles during the 2-min reading period. The assay of GSSG in the test samples involves an additional preparative step: to derivatize (destroy) GSH. To a 100-l aliquot of supernatant of tissue homogenate is added, under vigorous vortexing, 2l of 2-vinyl pyridine, and the pH of the mixture is adjusted to between 6.8 and 7.2 with triethanolamine (4l, but due to its high viscosity, the precise volume can vary with experimenter) that should be added while vortexing, preferably to the side of the tube wall to avoid sharp peaks of pH locally in the solution that will destroy GSSG. If the pH (measured with narrow-range pH paper) is higher than 7.2, derivatization should be repeated. The derivatization reaction is allowed to proceed at room temperature for 1 h and then the assay is performed with an identical assay mixture used for GSt, except for the water aliquot (175l) and the size of the sample and enzyme solution (20l each).
volumes of homogenate. To correct the possible interference, standard curves are constructed containing the drug at concentrations equivalent to those present in the usual 5l of the tissue supernatant used to measure GSt and in the 20l used to measure GSSG. These equivalent concentra-tions are determined empirically as those concentraconcentra-tions producing an in-hibition comparable to that observed with use of the internal standard. The assay mixtures for control tissues (that have not been treated with the drug under study) should also be supplemented with the drug at the concentration used in the standard curves.
Note that the standard curve to assay GSSG can be made with standard solutions of GSH or GSSG. The reason for that is when the reading of the absorbance starts, all glutathione in the assay mixtures is in an oxidized form as GSSG due to the spontaneous reaction with DTNB. It is in the cycling process initiated by the addition of glutathione reductase where all GSSG is first transformed into GSH, which in turn reduces new mol-ecules of DTNB generating color and becoming newly oxidized into GSSG, and so on. Therefore, it does not matter whether the construction of the standard curves is initiated with one or another form of glutathione.
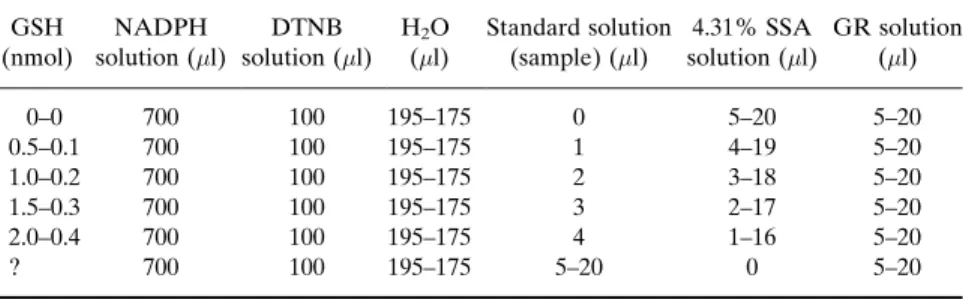
TABLE II
AssayMixtures used toConstructStandardCurves forGStand GSSGa GSH
(nmol)
NADPH solution (l)
DTNB solution (l)
H2O
(l)
Standard solution (sample) (l)
4.31% SSA solution (l)
GR solution (l)
0–0 700 100 195–175 0 5–20 5–20
0.5–0.1 700 100 195–175 1 4–19 5–20
1.0–0.2 700 100 195–175 2 3–18 5–20
1.5–0.3 700 100 195–175 3 2–17 5–20
2.0–0.4 700 100 195–175 4 1–16 5–20
? 700 100 195–175 5–20 0 5–20
aNote that GSH solutions are used for both the standard curve to GSt and the standard
curve to GSSG in the samples (see text for explanation). A single figure means that the same volume of that component is used for both standard curves; when there are two figures, the first one is for the GSt standard curve and the second for the GSSG standard curve. In the last row, figures correspond to the components used in the assay of the test samples. SSA is added to standard curves to maintain the same concentration of SSA that is in the test samples due to the fact that SSA tends to inhibit glutathione reductase. Note that the SSA solution used to add to the assay mixture in the standard curves is 4.31%: tissue water represents80% of tissue weight and thereby when we homogenize in a volume of 5% SSA equivalent to five times the tissue weight, we end up diluting the SSA solution with water contained in the tissue. The final volume in the supernatant would be 5.8 volumes with a reduced concentration of SSA to 4.31%: 5 vol.5%¼5.8 vol.x%; x%¼4.31%.
However, it should be kept in mind that each molecule of GSSG would yield two molecules of GSH, and this would affect the calculations of the concentration of glutathione in the tissue.
Calculations ofTissueConcentration ofGSt, GSSG,and GSH. It
should be realized that GSt in the tissue equals GSHþGSSG. Because each molecule of GSSG yields two molecules of GSH and our standard curve is made against GSH concentrations, our GSt in tissues equals GSH þ 0.5 GSSG concentration in the tissue. Referring to the calculations for GSSG concentrations, two different standard curves can be used. If a standard curve made with GSH is used, we are expressing the GSSG as GSH molar units, and therefore the actual GSSG molar concentration is half the one obtained by in-terpolation in the standard curve. If the standard curve is made with GSSG, the actual molar concentrations in the tissues are those given directly by inter-polation in the standard curve. Usually, the GSSG is expressed as GSH be-cause it facilitates the calculation of the actual GSH concentration in the test samples obtained as a difference: GSH¼GStGSSG.
The concentration of either GSt or GSSG in the tissue is obtained according to the following equation:
GSt or GSSGðmol=g tissueÞ
¼A ½tissue weightðgÞ 5:8=assay volume of the test sample ðmlÞ
tissue weightðgÞ
(4) whereAis the amount obtained by interpolation in the standard curve, but expressed in micromoles. Simplifying the equation
GSt or GSSGðmol=g tissueÞ ¼ A 5:8
assay volume of the test sampleðmlÞ
(5) The GSH/GSSG redox potential is calculated as inEq. (3).
Assessment of CB Chemoreceptor Cell Function
To assess the functionality of chemoreceptor cells of the CB, we have used anin vitropreparation of intact CB of rabbit. The rabbit CB weighs
400g, and our group has provided ample experimental evidence of its normal functioningin vitrowith the ability of chemoreceptor cells to detect a great variety of stimuli (including the natural ones hypoxia and hypercap-nia/low pH) and to respond with a neurosecretory response best monitored as the release of catecholamines (CA).62 The procedure used to monitor
62C. Gonzalez, L. Almaraz, A. Obeso, and R. Rigual,Trends Neurosci.15,146 (1992).
the neurosecretory response varies from one laboratory to the next. In our laboratory, two alternative methods are used: a radioisotopic method, which monitors the release of [3H]CA synthesized from the natural precursor [3H]tyrosine, which is described in some detail later, and a voltametric method that monitors continuously the release of CA from chemoreceptor cells as concentrations of endogenous CA in the extracellular space of the CB tissue. Any variation in the CA concentration associated with CB stimu-lation implies a response of chemoreceptor cells to such stimulus (see Rigual et al.63for a description of the method).
Surgical Procedures. Rabbits are anesthetized with sodium pentobar-bital (40 mg/kg, iv through the lateral vein of the ear) and, after a longitu-dinal incision in the ventral face of the neck, the carotid arteries are dissected past the carotid bifurcation. After convenient clamping, a block of tissue containing the carotid bifurcation is removed and placed in a lucite chamber filled with ice-cold/100% O2-equilibrated Tyrode (see
earlier discussion) to dissect the CB free of surrounding connective tissue. Animals are killed by an intracardiac overdose of sodium pentobarbital. The Committee for Animal Care and Use at the University of Valladolid approved the protocols. Animals did not suffer any distress in all the experimental procedure.
Labeling of CA Stores, Synthesis of [3H-]CA from [3H-]tyrosine, and Release of [3H-]CA. The CA stores of CBs are labeled by incubating the organs in small glass vials (eight CBs/vial) and are placed in a shaker bath at 37 containing 0.5 ml of a 100% O2-preequilibrated Tyrode solution.
The incubating solution contains [3,5-3H]tyrosine (30 M; 20 Ci/mmol), 100 M 6-methyl-tetrahydropterine, and 1 mM ascorbic acid, cofactors for tyrosine hydroxylase and dopamine--hydroxylase, respectively.64The incubation to label [3H]CA stores lasts 2 h. After labeling the [3H]CA stores, the CB are transferred individually to glass scintillation vials, con-taining 4 ml of precursor-free bicarbonate-buffered Tyrode solution (see earlier discussion) and are kept in a shaker bath at 37 for the rest of the experiment. Solutions are bubbled continuously with 20% O2/5% CO2/
75% N2saturated with water vapor. When hypoxia is applied as the
stimu-lus, the solutions are bubbled with a hypoxic gas mixture (containing 0–21% O2), which in these experiments was 7% O2/5% CO2/balance N2.
During the first hour, incubating solutions are renewed every 20 min and discarded. During the rest of the experiment, incubating solutions are col-lected every 10 min and are saved for ulterior analysis in their [3H]CA con-tent. Stimulus to CBs consisted in their incubation during a 10-min period
63R. Rigual, L. Almaraz, C. Gonzalez, and D. F. Donnelly,Pflug. Arch.439,463 (2000). 64S. Fidone and C. Gonzalez,J. Physiol.333,69 (1982).
with the hypoxic (7% O2-equilibrated) solution. In some experiments we
also stimulated the CBs by incubation for 10 min with a solution containing 35 mMKþ(balanced osmotically by the removal of NaCl). Collected solu-tions are acidified with glacial acetic acid to pH 3 and are maintained at 4 to prevent degradation of the [3H]CA released until analysis. At the end of the experiments, CB tissues are homogenized in 0.4N perchloric acid and centrifuged in a microfuge (4 10 min) and the supernatant is stored for analysis in [3H]CA.
Analytical Procedures.The analysis of [3H]catechols present in the col-lected incubating solutions and the supernatants of the CB homogenates included adsorption to alumina (100 mg) at alkaline pH (by the addition, under shaking, of 3.6 ml of 2.0MTris buffer, pH 8.7), extensive washing of the alumina with distilled water, bulk elution of all catechols65 with 1 ml of 1N HCl, and liquid scintillation counting. When identification of the synthesized or released [3H]catechols was needed, only 100l of the alumina eluates was counted and the remaining 900l was used for identification of the labeled [3H]catechols by HPLC-ED.66
Quantification of the Release of [3H]CA.The basal normoxic release of [3H]CA in the sequential 10-min periods is obtained from the scintillation counter as dpm. It can be transformed easily in [3H]CA molar units by taking into account that their specific activity is half of the precursor [3H]tyrosine because the label in position 3 is lost in the first step of [3H]CA synthesis. Either as dpm or as mole units it can be referred to CB or to mg of CB tissue. Alternatively, it can be expressed as a fraction of the total [3H]CA synthesized by each CB. The [3H]CA synthesized amounts to the [3H]CA present in the tissue plus those released present in the sequentially collected incubated solutions. Basal release can also be normalized by referring as 100% the release obtained in a given col-lected fraction in the experiment: this allows following the normal decay of the basal release as the percentage of that obtained in the indicated period of time of the experiment. The stimulus-evoked release of [3H]CA is first calculated as the dpm above basal normoxic release. It can be ex-pressed as dpm, as mole units, or as percentage of tissue content and re-ferred as per CB or per milligram of CB tissue; the evoked release in a experimental group of CBs can also be expressed as a percentage of that obtained in the correspondent control group of CBs. Alternative forms of expressing the release are also possible.51
65H. Weil-Malherbe,in‘‘Ana´lisis of Biogenic Amines and Their Related Enzymes’’ (D. Glick,
ed.), p. 119. Wiley, New York, 1971.
66I. Vicario, R. Rigual, A. Obeso, and C. Gonzalez,Am. J. Physiol. Cell. Physiol.278,C490
Results and Discussion
The experiments performed were aimed to disclose the relationship between the GSH/GSSG system and oxygen chemoreception. We have measured glutathione in rat diaphragm in several experimental conditions, including control or normoxic, 40-min incubation with 21% O2/5% CO2;
hypoxic, 30 min 21% O2/5% CO2 þ 10 min 7% O2/5% CO2;
BCNU-treated, 40-min normoxic incubation in the presence of 0.5 mM BCNU; diamide (DIA)-treated, 40-min normoxic incubation in the presence of 0.2 mM diamide; PCMBS-treated, 40-min normoxic incubation in the presence of 50M PCMBS; and NAC-treated, 40-min normoxic incuba-tion in the presence of 2 mM NAC (Fig. 4). The control levels of GSt, GSSG, and GSH, as well as the control redox potential shown in Fig. 4, correspond to the mean of all control groups and correspond to the arith-metic mean of 50 samples of tissue. Figure 4 presents this mean control value rather than the individual controls for each experimental group (8–12 pieces of tissue each) to simplify the figure, but the statistical signifi-cances shown have been calculated by comparing each experimental group with its corresponding control group. It is evident that hypoxia did not alter any of the parameters significantly. Carmustine (BCNU) and DIA de-creased GSt and GSH levels significantly; in addition, DIA also inde-creased GSSG levels significantly. Both agents, acting by completely different mechanisms (see Discussion), lowered the redox environment of the diaphragm similarly and significantly. However, NAC increased GSt and GSH and produced a very significant increase in the redox environment of the tissue. Identical results with NAC treatment were obtained in a
Fig. 4. Levels of GSt, GSSG, GSH, and GSH/GSSG redox potential in the experimental conditions shown. Data are meansSEM of 8–12 individual data.
previous study51 with calf CB and in the present study with rat liver (not shown).
BCNU, DIA, PCMBS, and NAC were tested for their effect on the basal normoxic release of [3H]CA from rabbit CB chemoreceptor cells at the same concentrations used to measure glutathione in rat diaphragm. The findings are shown inFig. 5. Note that the basal normoxic release of [3H]CA in the 100–120 min of duration of the experiments follows a mono-tonic slow decay. If the basal release for each CB in the second 10-min col-lection is normalized to 100%, at the end of the experiments the release in a 10-min period of incubation has decayed to 60–75% of that at the initi-ation of the experiment. When at the end of the experiment a depolarizing stimulus (35 mMextracellular Kþ) or a hypoxic stimulus is applied, there is a burst release during application of the stimulus that continues during two or three additional 10-min periods. This apparently delayed release of [3H]CA represents the washout of [3H]CA, which, upon release, has been taken up again by all the structures of the CB and catabolized, leaving the tissue very slowly.67The basal release during a 10-min period in the rabbit CB represents from 0.1 to 0.4% of the [3H]CA synthesized in the 2-h period of loading with [3H]tyrosine, which is equivalent to 400–1600 dpm/ CB. Among the tested agents, only DIA (0.2 mM) altered the normoxic re-lease of [3H]CA. The release elicited by DIA at this concentration in most
67E. Gonzalez, R. Rigual, S. J. Fidone, and C. Gonzalez,J. Auton. Nerv. Syst.18,249 (1987).
PCMBS 0.05 mM
NAC 2 mM
10 100 1000 10,000
0 20 40 60 80 100 120 Time (min)
Basal release (% control)
Normoxia BCNU 0.5 mM
DIA 0.2 mM
35 mM K+
Fig. 5. Effects of several agents on the basal or normoxic release of [3H]CA by the intact rabbit CB. As indicated by arrows, drugs were applied during 40 min. At the end of the experiments, a pulse (10 min) of high external Kþwas added to test the viability of the preparations. Data are means SEM of 6 to 10 individual data. Standard error bars are omitted (except for DIA) for clarity.


![Fig. 5. Effects of several agents on the basal or normoxic release of [ 3 H]CA by the intact rabbit CB](https://thumb-us.123doks.com/thumbv2/123dok_es/5512987.728928/28.648.169.485.108.333/fig-effects-agents-basal-normoxic-release-intact-rabbit.webp)
![Fig. 6. Effects of the several agents on the release of [ 3 H]CA induced by hypoxia. (A and B) Single experiments obtained in individual CBs that show the experimental protocol in control CBs subjected to hypoxic stimulation and in an experimental CB treat](https://thumb-us.123doks.com/thumbv2/123dok_es/5512987.728928/30.648.86.563.107.392/effects-experiments-obtained-individual-experimental-subjected-stimulation-experimental.webp)
