TítuloContinuous bioremediation of phenol polluted air in an external loop airlift bioreactor with packed bed
6
0
0
Texto completo
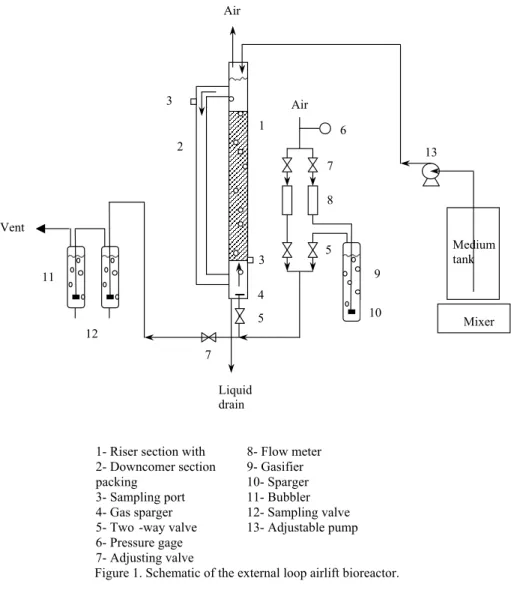
(2) 212. H. NIKAKHTARI AND G.A. HILL. 2 MATERIALS AND METHODS 2.1 Microorganism and Media Pseudomonas putida (ATCC 17484) was used for all microbial growth experiments. It was maintained on nutrient broth agar and stored at 4 °C. The growth media consisted of (mg in 1 L reverse osmosis water; analytical reagent grade chemicals, BDH, Toronto): K2HPO4, 850; KH2PO4, 840; (NH4)2SO4, 474; NaCl, 60; CaCl2, 60; MgSO4, 60; Fe(NH4)SO4, 20; and 1 ml of trace mineral solution. The trace mineral solution consisted of (mg in 1 L reverse osmosis water): ZnSO4.7H2O, 200; MnCl2, 60; H3BO3, 300; CoCl2, 400; CuCl2, 20; NiCl2, 40; Na2MoO4, 60. The pH of this solution was 6.97. 2.2 Bioremediation procedure The same ELAB that was used in earlier work for oxygen and VOC mass transfer studies (Nikakhtari and Hill 2005a, b) was used in this study. A schematic diagram of the ELAB with the packed bed is shown in Figure 1. Riser section diameter, liquid height above sparger and riser to downcomer cross-sectional area ratio were 89 mm, 1.42 m and 3.57, respectively. The sparger included six, 1.6 mm diameter orifices. The height and porosity of the packing were 1.2 m and 99.0%, respectively. Air was introduced to a gasifier containing 1 liter of a saturated phenol solution. The concentration of phenol in the gasifier effluent stream was measured by introducing the gas stream to a series of two bubblers. As long as the second bubbler showed zero concentration of phenol, the accumulated concentration in the first bubbler can be used to determine the phenol concentration in the air phase. Using this method, the phenol concentration in the inlet gas stream was found to remain at the saturated concentration at room temperature and pressure (0.8 mg/l, at 23 oC and 0.932 × 10⁵ Pa) over all the air flow rates used in this study. The outlet air from the gasifier was introduced to the ELAB through the sparger. For all bioremediation experiments, the air flow rate was maintained by a calibrated rotameter at a constant value of 9.23 × 10⁻⁵ m3/s which provided a gas superficial velocity of 0.0148 m/s in the riser section of the ELAB. The size of the gasifier limited the maximum air flow rate that could be used in this study. Fresh sterilized medium was pumped into the ELAB at the top and liquid was drained out of the bottom of the ELAB riser section. One batch run and three continuous runs at different dilution rates (0.05, 0.20, and 0.50) were performed. Then the conditions used for the lowest dilution rate were repeated for an extended duration to test the stability of the bioreactor..
(3) CONTINUOUS BIOREMEDIATION OF PHENOL POLLUTED AIR IN AN EXTERNAL LOOP AIRLIFT BIOREACTOR …. 213. Air. 3. Air 1. 6. 2. 13. 7 8 Vent 3. Medium tank. 5 9. 11 4 5. 10. 12. Mixer. 7 Liquid drain. 8- Flow meter 1- Riser section with 9- Gasifier 2- Downcomer section 10- Sparger packing 11- Bubbler 3- Sampling port 12- Sampling valve 4- Gas sparger 13- Adjustable pump 5- Two -way valve 6- Pressure gage 7- Adjusting valve Figure 1. Schematic of the external loop airlift bioreactor.. 2.3 Analysis A syringe was used to take samples from one of two ports in the riser (10 cm above downcomer inlet or 20 cm below downcomer outlet). Biomass concentrations were measured at 620 nm wavelength using a spectrophotometer (model Mandel 1240, Shimadzu, Kyoto, Japan). Optical density was converted to cell dry weight using a previously prepared calibration curve. For measurement of phenol, samples were filtered and analyzed immediately using the same spectrophotometer at 247 nm. Then absorbance was converted to phenol concentration using a prepared calibration curve. 3 RESULTS AND DISCUSSION All phenol is absorbed in the water phase at all operating conditions. The outlet air from the ELAB does not have any phenol due to complete absorption of this hydrophilic chemical..
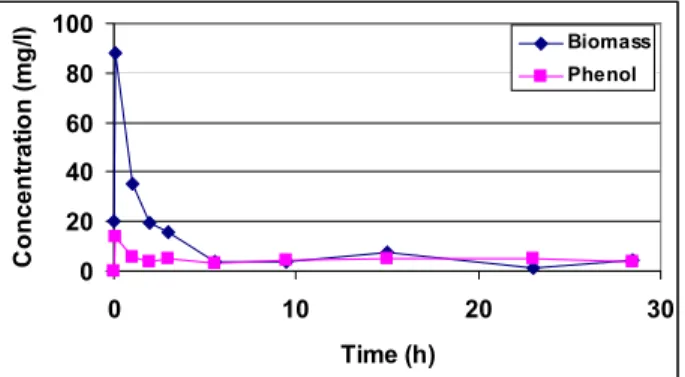
(4) 214. H. NIKAKHTARI AND G.A. HILL. The developed biofilm on the stainless steel packing and a micro-photograph of detached biofilm are shown in Figure 2. The released biofilm particles were generally of the size and shape shown in Figure 2b, about 25 microns long by 5 microns wide.. (a). (b). Figure 2. (a) Developed biofilm on the stainless steel packing, (b) Micro-photograph of detached biofilm.. Concentration (mg/l). Variation of phenol and free biomass concentrations during a fed-batch run are shown in Figure 3. These profiles are similar to those reported by Ritchie and Hill (1995) without a packed bed, except they used lower air superficial velocities (maximum of 0.0118 m/s) and achieved slower biodegradation rates. They achieved a maximum phenol loading rate of 16200 mg/h.m3. In Figure 3, the experiment phenol loading rate was 22160 mg/h.m3 (30% improvement in bioremediation rate). In their fed-batch experiments, the phenol concentration reached a negligible value after 14 hours of operation but in the present experimental work negligible phenol concentrations were achieved after only 6 hours in spite of the higher loading rate. This is believed to be due to the contribution of the biofilm to phenol capture and biodegradation. 120. Biomass. 100. Phenol. 80 60 40 20 0 0. 20. 40. 60. 80. Time (h). Figure 3. Phenol degradation during a fed-batch run.. The suspended biomass concentration shows an increase right after starting the air flow, which is because some of the biofilm is released from the steel mesh when the turbulent, air-liquid two phase fluid flow commences. The suspended biomass concentration shows some fluctuation with time, but appears to remain fairly constant at 60 mg/L. Ritchie and Hill (1995) reported a steadily increasing suspended biomass concentration, however in this study it is believed the bulk of the phenol consumption.
(5) CONTINUOUS BIOREMEDIATION OF PHENOL POLLUTED AIR IN AN EXTERNAL LOOP AIRLIFT BIOREACTOR …. 215. Concentration (mg/l). goes into maintaining and increasing the biofilm which was not present in the work of Ritchie and Hill. After about 40 hours, the medium ran out of nutrients (at that time a total of 886 mg/L of phenol had been metabolized), and the phenol concentration started to increase. This demonstrates that continuous feed of nutrients is necessary to operate this bioreactor over extended periods of time, in spite of the negligible build up of suspended biomass. To prove this, three continuous runs at different dilution rates (0.05, 0.20, and 0.50 h-1) were done. The liquid flow rates were 0.6, 2.4, and 6 l/h resulting in residence times of 20, 5, and 2 h, respectively. Experiments were continued at each flowrate until steady concentrations were achieved, which resulted in durations over four residence times in each case. Figure 4 shows results of one of these continuous experiments (0.20 h-1 dilution rate). Again, right after start-up of the air, an increase in suspended biomass concentration was observed due to biomass being released from the biofilm. After that, because suspended biomass loss in the effluent is higher than its production rate due to growth and re-entrapment in the biofilm, its concentration falls rapidly. Steady state is reached in 40, 5, and 2 h for dilution rates of 0.05, 0.20 and 0.50 h-1, respectively. Phenol concentrations increase during the early transient phase, then fall to low concentrations (below measurement accuracy) prior to achieving the steady state conditions. The maximum transient phenol concentrations reached were 14.9, 13.6, and 5.4 mg/l for dilution rates of 0.05, 0.20, and 0.50 h-1, respectively. It is notable that the highest dilution rate used in this study, 0.50 h-1 is above the maximum growth rate of the cells, and yet a steady state condition is still achieved due to the growth activity of the fixed biomass. 100. Biomass. 80. Phenol. 60 40 20 0 0. 10. 20. 30. Time (h). Figure 4. Continuous run at a dilution rate of 0.20 h-1 (liquid flow rate of 2.4 l/h).. The last experiment was a replication of the 0.05 h-1 dilution rate for an extended period of time to show stability of the steady state condition in the column. This final run was continued for 17 residence times, a total of 340 h, and the phenol concentration stayed below 10 mg/L. In spite of negligible amount of phenol in the water phase, which remains constant over a long period of time, no measurable amounts of phenol occur in the effluent air phase, and the polluted air problem has been completely removed. It seems that this novel packed bed, ELAB is capable of long term steady state operation with biofilm removal due to sporadic detachment caused by the turbulent bubble flow through the packing and then continuous removal of detached biofilm in the bioreactor effluent..
(6) 216. H. NIKAKHTARI AND G.A. HILL. 4 REFERENCES Edwards, F. G. and Nirmalakhandan, N. (1999) Modeling an airlift bioscrubber for removal of airphase BTEX. J. Environ. Eng. 125: 1062-1070. Harding, R. C., Hill, G. A. and Lin, Y.-H. (2003) Bioremediation of toluene contaminated air using an external loop airlift bioreactor. J. Chem. Technol. Biotechnol. 78: 1-6. Wen, J., Chen, Y. Chen, D. and Jia, X. (2005) Removal of ethyl acetate in air streams using a gas-liquid-solid three phase flow airlift loop bioreactor. Biochem. Eng. J. 24: 135-139. Lo, C.-S. and Hwang, S.-J. (2004) Dynamic behavior of an internal-loop airlift bioreactor for degradation of waste gas containing toluene. Chem. Eng. Sci. 59: 4517-4530. Nikakhtari, H. and Hill, G. A. (2005a) Hydrodynamic and oxygen mass transfer in an external loop airlift bioreactor with a packed bed. Biochem. Eng. J. (Submitted). Nikakhtari, H. and Hill, G. A. (2005b) Volatile organic chemicals mass transfer in an external loop airlift bioreactor with a packed bed. Ind. Eng. Chem. Res.(Submitted). Ritchie, B. J. and Hill, G. A. (1995) Biodegradation of phenol polluted air using an external loop airlift bioreactor. J. Chem. Technol. Biotechnol. 62: 339-344. Wei, V. Q., Hill, G. A. and Macdonald, D. G. (1999) Bioremediation of contaminated air using an external-loop airlift bioreactor. Can. J. Chem. Eng. 77: 955-962..
(7)
Figure

Documento similar
The integration having been carried out along the real axis, the lowest eigenvalues jump from family to family when crossing the points where the potential is purely
At the same time, higher values of the quantum efficiency were found in the photocatalytic degradation of phenol, methyl 4-hydroxybenzoate and 4-chlorophenol with P25, whereas in
98 In 2013 an interesting method for the generation of isolated attosecond pulses with circular polarization was reported, 99 based on HHG in a molecular medium driven by an
In the evaluation of pipes of carbon steel used for the supply of potable water are detected structural problems in the SAE 1018 carbon steel, with which were manufactured
The validation of the temperature drop and cooling efficiency of the cooling pad numerical model is the main objective of this paper, and, in order to get this
The validation of the temperature drop and cooling efficiency of the cooling pad numerical model is the main objective of this paper, and, in order to get this
13 evaluated 8 patients with INHs initially treated by debridement and placement of a circular external fixator, and in a second stage, with the addition of an autologous bone
Furthermore, two predictive models have been developed (an ARIMA Time Series and an LSTM recurrent neural network) to study how time series models adapt to this type of data..
