TítuloCharacterization of Polymeric Materials by Thermal Analysis, Spectroscopy and Microscopic Techniques
14
0
0
Texto completo
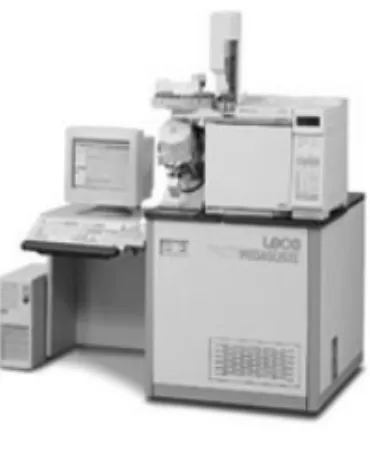
(2) 142. NATHAN WHITELY, WEIBING XU, SEN LI AND WEI-PING PAN. Figure 1. TG-MS and TG-FTIR Systems The alternate sampling technique called intermittent or batch mode collects the gaseous sample at low temperatures or traps the gas sample within an absorbent chamber then releases all of the volatiles into the detector system at the same time. A typical instrument demonstrating an intermittent sampling mode is Pyrolysis/GC-MS. MS offers a very sensitive system that gathers large quantities of structural data specific to each evolved gas species, see Figure 2.. Figure 2. GC/MS System By far, the major advantage of the TG/MS and TG/FTIR systems is the ability to continuously and simultaneously gather both quantitative and qualitative information about the evolved gases; however, disadvantages exist that must be kept in mind such that information collected is not misinterpreted. Overlapping peaks within both the TGA and FTIR data is a major contributor to erroneous analysis. Weak signals are no less significant than stronger signals, but can be masked when located in close proximity to the stronger signals. The use of Hi-Resolution TGA offers an alternate method in separating weak signals hidden by overpowering signals; however, FTIR peaks typically cannot be resolved further from either stronger signals or signal noise. Diatomic molecules, which contain no permanent dipole due to their symmetric geometry, go undetected by FTIR. When determining stereoisomerism is important, MS is not the appropriate instrument. The major disadvantage of both the TG/FTIR and TG/MS systems is the incapability to detect the presence of high molecular weight.
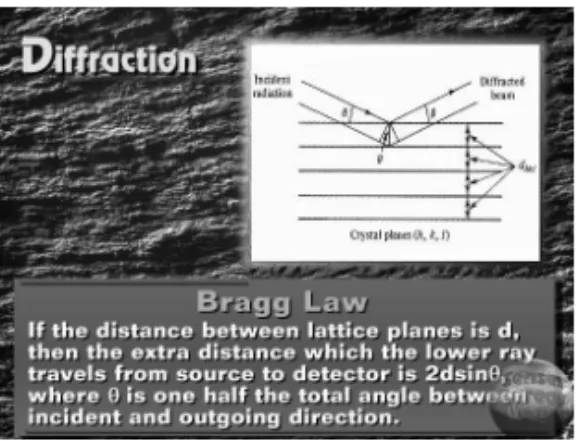
(3) CHARACTERIZATION OF POLYMERIC MATERIALS BY THERMAL ANALYSIS, …. 143. compounds. It is important to note the disadvantages in order to properly choose a complimentary analysis technique that will provide the desired information. The Pyrolysis/GC-MS system helps alleviate the problem with detection of high molecular weight compounds that must be sacrificed with TG/FTIR and TG/MS. On the other hand, Pyrolysis/GC uses an intermittent sampling method that prevents any time and/or temperature dependent gas evolution profiles. The previous section dealt with techniques typically used for analysis of organic materials; the forthcoming section will deal with XRD a technique reserved for the analysis of crystalline or inorganic materials. XRD can be used to either identify a sample by its unique “fingerprint” of its X-ray powder pattern or X-ray crystallography can be used to provide data that is able to provide structural data, specifically how the atoms are packed together in crystalline form, the interatomic distance and angle. Bragg’s Law shown in Figure 3 is the relationship used to interpret XRD data.. Figure 3. Bragg’s Law Coals containing high sulfur and chlorine contents are often blended with municipal solid wastes (MSW) in order to make combustion less environmentally damaging. Common MSW include PVC, newspaper, and cellulose, but the addition of MSW may provide an environment that leads to alternate reaction pathways that may be equally harmful to the environment. TG/FTIR/MS can be used to accurately determine the nature of gas evolution to predict what will happen with coal-MSW blends in industrial-sized combustion chambers. Using a 100oC/min-heating rate, the TGA curve of the blend seen in Figure 4 shows three apparent weight losses, which appear to be the weight losses of individual components..
(4) 144. NATHAN WHITELY, WEIBING XU, SEN LI AND WEI-PING PAN. Figure 4. TGA Curve of Coal, MSWs, and Blend The first weight loss is due to moisture, the second due mostly to the decomposition of PVC, newspapers, and cellulose, and the third is from the combustion of the coal and carbon residue of PVC. The combustion of the coal can be followed by the CO2 (2230, 670 cm-1) and H2O (3851, 1652 cm-1) FTIR peaks shown in Figure 5, which correspond, to the second weight loss.. Figure 5. TG-FTIR Curve for PVC Figure 6 shows that the MS data agrees with trends developed in the analysis of the FTIR results. Sulfur dioxide appears around 280°C and reaches a maximum at 340°C and another maximum at 420°C corresponding to the third weight loss..
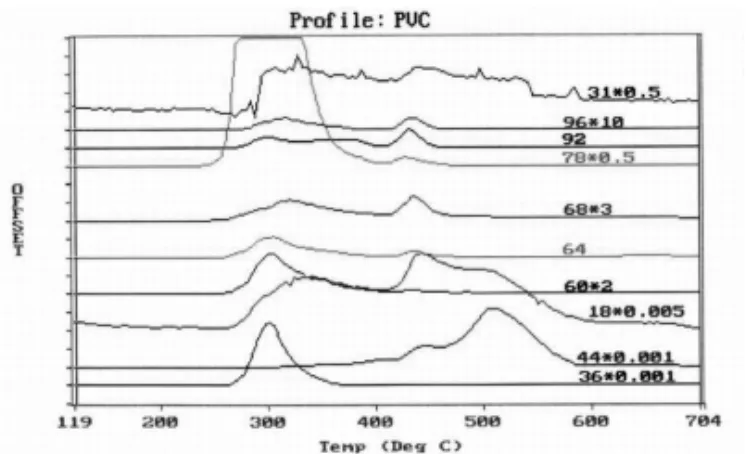
(5) CHARACTERIZATION OF POLYMERIC MATERIALS BY THERMAL ANALYSIS, …. 145. Figure 6. TG-MS Curve for Coal-MSW Blend Only moisture (m/z = 18) is evolved at 100°C. At approximately 300°C the fuels begin to decompose noted by the presence of small organic and inorganic molecules such as HCl, benzene and toluene (m/z = 92) from PVC, acetic acid and/or carbonyl sulfide(m/z = 60), furan (m/z = 68), phenol (m/z = 94), and furfural (m/z = 96) from newspaper and cellulose, while carbonyl sulfide (m/z = 68) and sulfur dioxide (m/z = 64) are released from the coal. The maximum rate of this region occurs at 320°C and ends around 370°C agreeing with both the TGA and FTIR data for the second weight loss. Sulfur dioxide and carbon dioxide show a maximum at 420°C, which is the third weight loss. With the evolution of gases such as HCl, chlorine, phenol, furan, and other hydrocarbons during the same temperature range, there may exist a possibility that chlorinated hydrocarbons can be formed. This hypothesis is supported by the presence of chloro-benzene (m/z = 112). Polymers provide a wide range of applicability due the large span in physical properties. The vast extent of the properties of polymers is further enhanced by the addition of inorganic fillers. An unknown polymer sample can be analyzed with multiple methods in order to determine the amount and identity of both the polymer and any inorganic fillers if present. The TGA curve shown in Figure 7 shows that the polymer has a single, broad weight loss due to the degradation of the polymer occurring at 470 oC.. Figure 7. TGA Curve of Unknown Polymer.
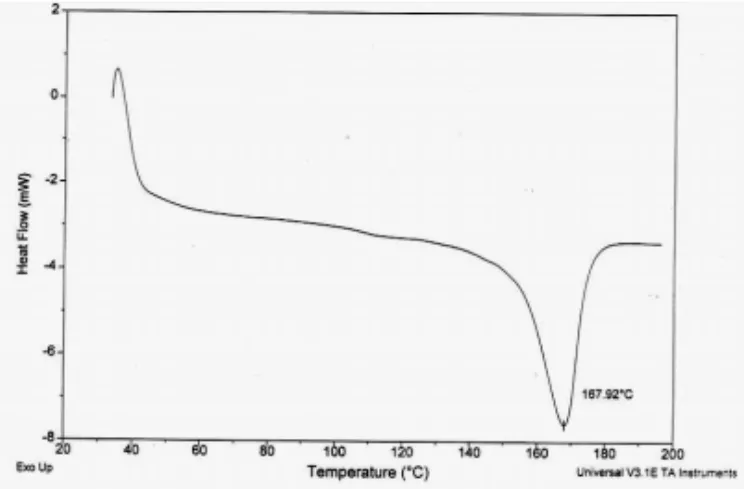
(6) 146. NATHAN WHITELY, WEIBING XU, SEN LI AND WEI-PING PAN. The polymer’s residual amount of 37.94% after exposure to 1000 oC shows that the polymer has been filled with some inorganic filler. Using the Hi-Resolution TGA the single, broad peak of the normal TGA can be resolved into two separate weight losses occurring at 367°C and 391°C shown in Figure 8.. Figure 8. Hi-Resolution TGA Curve of Unknown Polymer Because Hi-Resolution TGA separates the peaks by exposing the sample to an isotherm while a weight loss is taking place, the degradation temperatures are actually lower than what would typically be expected. Figure 9 is the DSC curve indicating that the polymer’s melt occurs at 168°C.. Figure 9. DSC Curve of Unknown Polymer The polymer’s identity can be determined by comparison with standard values to most likely be polypropylene. The melt temperature of the sample falls well within the typical melting range of polypropylene and the degradation temperature of the sample is slightly lower than the temperature expected due to the use of Hi-Resolution TGA. XRD was used to analyze the sample so the identity of the inorganic filler could be determined. The peaks from the XRD analysis show that the inorganic filler is Mg(OH)2. The known decomposition reaction of Mg(OH)2 can be used to determine what amount of Mg(OH)2 exists in the initial sample. The largest part of the sample’s residue is MgO. From Figure 7, the residual amount of MgO 37.94% can be used to estimate that the initial sample was 55% Mg(OH)2. This approximation is too high.
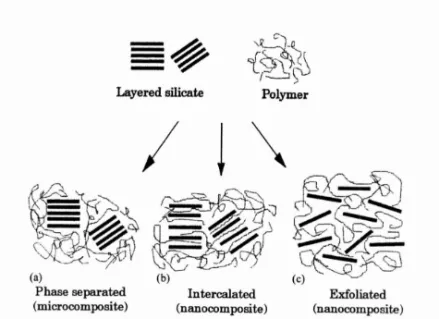
(7) CHARACTERIZATION OF POLYMERIC MATERIALS BY THERMAL ANALYSIS, …. 147. because a fraction of the residue is from the decomposed polypropylene. From the HiResolution TGA, the single broad decomposition can be resolved into two peaks; the first being the decomposition of Mg(OH)2 and the second being the decomposition of the polymer. The weight loss due to the decomposition of Mg(OH)2 is approximately 15.2%. This loss due to the evolution of water can be used to calculate that the initial sample was approximately 49.3% Mg(OH)2. This estimate is too low, because the overlapping decomposition regions of the Mg(OH)2 and the polymer cannot be entirely resolved; thus, from the two estimations it can be noted that the initial sample was polypropylene filled with 49-55% Mg(OH)2. Nanocomposite Materials are a new class of state-of-the-art materials with numerous applications one such being as use as flame-retardants. Nanocomposites are materials in which a polymer chain is intertwined with an inorganic layered silicate, or clay. Three typical structures occur for a nanocomposite. The first is the phase separated in which the clay’s layered structure is intact and the polymer chain simply surrounds the clay particles. The second is the intercalated composite where the clay’s structure is maintained though slightly separated and the polymer winds itself through the many layers of the clay particles. The last possible nanocomposite structure is the exfoliated where the clay’s structure is completely lost and the layers are completely separated dispersed homogeneously throughout the polymer matrix. Figure 10 shows the three general structures of nanocomposites.. Figure 10. General Structures of Nanocomposites One of the most common clays used is montmorillonite. The crystal structure of montmorillonite consists of two-dimensional layers formed by fusing two silica tetrahedral sheets with an edge-shared octahedral sheet of either alumina or magnesia. The unique sheet-geometry of the clay shown in Figure 11 makes it an ideal choice as an inorganic filler..
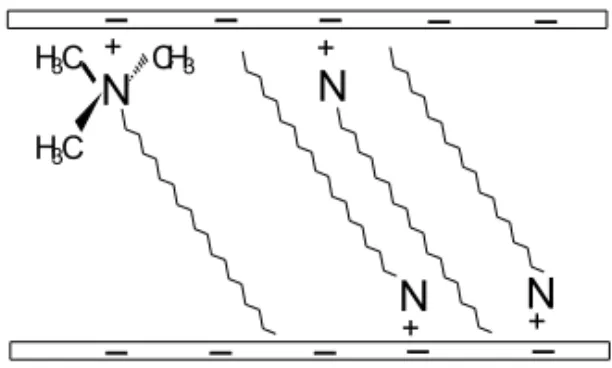
(8) 148. NATHAN WHITELY, WEIBING XU, SEN LI AND WEI-PING PAN. Figure 11. Layered Structure of Clays As depicted above these layers stack forming sheets and galleries containing net negative charges due to isomorphous substitutions. These net negative charges are usually balanced by Na+ and Ca2+ ions that are not part of the structure, thus these ions can be exchanged by other positively charged atoms or molecules. Because the clay is hydrophilic and the polymer is hydrophobic the surface of the clay must be modified for successful synthesis to occur. This is carried out by exchanging cationic surfactants for the free cations within the clay sheets as seen in Figure 12.. -. H3C + CH3. -. -. -. +. -. N. N. H3C. -. -. -. N. N. -. -. +. +. Figure 12. Surfactant Confined by Clay Layers The aforementioned process also serves another purpose of increasing the interlayer distance. The layers of the clay are typically on the order of 1nanometer, which is smaller than the diameter of the polymer; therefore, the clay layers must be separated to enable the polymer to be inserted between the clay layers. The clays containing cationic surfactants between their layers are known as organically modified layered silicates (OLS). Regardless of the fabrication method used, elevated temperatures will be utilized to form the polymer layered silicate nanocomposite (PLSN); as a result, the thermal stability of the OLS is vital. If the temperature required to fabricate the PLSN is higher than the degradation temperature of the OLS the interface between the polymer and clay is altered leading to unsuccessful synthesis. The TGA curve of the PLSN can be divided into four regions. Water and physiabsorbed CO2 and N2 are evolved below 180.
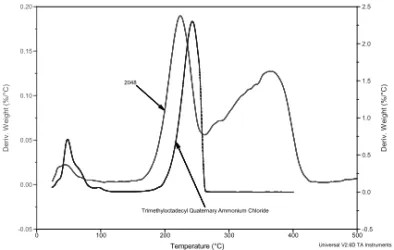
(9) CHARACTERIZATION OF POLYMERIC MATERIALS BY THERMAL ANALYSIS, …. 149. o. C, from 180-500 oC small organic gases are emitted, region III is attributed to the dehydroxylation of clay layers, and above 700oC is the result of carbonaceous residue. The four regions are depicted in the TGA curve, see Figure 13.. Figure 13. DTG Curve of Nanocomposite Many surfactants were studied all showing single step degradation although at numerous onset temperatures. The onset temperatures of the OLS most closely resemble that of the parent surfactant although lowered by 15-25 oC. The decrease in the thermal stability of the OLS is contributed by the Lewis acid sites of the aluminosilicate layers of the clays that catalyze the Hoffman elimination. One notable difference is that the degradation is now multi-stepped as seen in Figure 14. 0.20. 2.5. 2.0. 1.5. 2048. 0.10. 1.0. 0.05. Deriv. Weight (%/°C). Deriv. Weight (%/°C). 0.15. 0.5. 0.00 0.0 Trimethyloctadecyl Quaternary Ammonium Chloride. -0.05 0. 100. 200. 300. Temperature (°C). 400. -0.5 500 Universal V2.6D TA Instruments. Figure 14. DTG Curve of OLS and Parent Surfactant The absence of CH2 and CH3 stretching from the Thermal-IR shows that at temperatures above approximately 500 oC no alkyl chains are present directly correlating to the decomposition of the surfactant. Note that he hydroxyl stretching seen at 3675 cm-1 in Figure 15 begin to decrease at 250 oC and disappear at approximately 500 oC associated with the dehydroxylation of the octahedral layer..
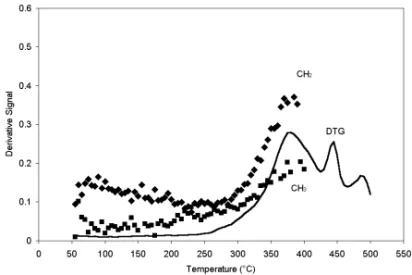
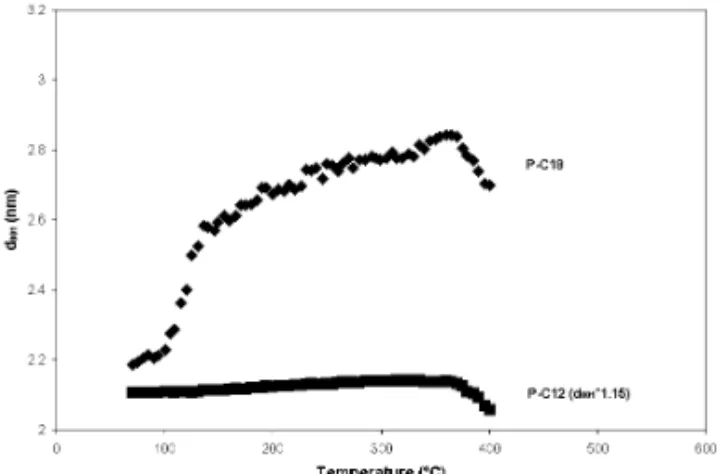
(10) 150. NATHAN WHITELY, WEIBING XU, SEN LI AND WEI-PING PAN. 3.5. 3. Relative Intensity. 2.5. 2. 1.5. 1. 0.5. 600°C 550°C 500°C 450°C 400°C 350°C 300°C 250°C 200°C 150°C 100°C 50°C 25°C. 0 5000. 4500. 4000. 3500. 3000. 2500. 2000. 1500. 1000. 500. 0. Wavenumber (cm-1). Figure 15. Thermal IR of Nanocomposite The relative change in the intensity of the IR spectrum is directly proportional to the amount of relative concentration for the group responsible of the IR absorption. The area must be compared rather than the maximum absorption because the IR peaks broaden with increased temperature. Figure 16 shows the correlation between the time rate of change in peak area of the CH2 and CH3 vibrations and the DTG signal, signifying that the weight loss can definitely be attributed to the decomposition of the surfactant.. Figure 16. DTG Curve and Time Rate of Change Dependent IR Integrations The XRD results as a function of temperature shown in Figure 17 show that the interlayer spacing increases at constant rate from 100-370 oC, which is closely related to the maximum rate of mass loss seen in the TGA and FTIR results..
(11) CHARACTERIZATION OF POLYMERIC MATERIALS BY THERMAL ANALYSIS, …. 151. Figure 17. d-Spacing as a Function of Temperature This suggests that the initial degradation products are trapped within the layers of the OLS causing the layers to expand and gases are released as the as the interlayer gallery begins to collapse. Isothermal Pyrolysis/GC-MS experiments were performed on the OLS and the parent surfactants at temperatures of 250, 300, 350, and 400 oC. By thoroughly studying the exact identities of gases evolved as a result of exposure to various temperatures a nearly exact, step-by-step degradation pathway can be devised. The reason a multistepped degradation process is seen for the OLS, but is absent in the parent surfactant is due to the confinement of the surfactant within the layers of the clay. This unique geometry retards gas evolution and keeps the products bond very tightly together making the likelihood of further reactions much greater, whereas with the parent surfactant the degradation gases are immediately released. Whether confined or free the initial step of the degradation is a Hoffman elimination of the Į-carbon with respect to the surfactant head group. A summary of the four regions of the thermal degradation of OLS is as follows. Region I occurs from room temperature to approximately 70 oC where the surfactants exist as paraffinic in nature. Region II occurs until about 200 oC where the surfactants melt resulting in a much more mobile liquid-like interlayer. Region III occurs until approximately 350 oC where initial surfactant degradation occurs via a Hoffman elimination reaction. As a result the interlayer expands with gases as well as other long chain molecules not associated with the aluminosilicate layer. Region IV occurs above approximately 380 oC and shows first signs of the interlayer gallery collapsing and the presence of carbonaceous char. Micro-Thermal Analysis (Micro-TA) has the major advantage over standard thermal analytical techniques by providing localized thermal imaging. Typical techniques such as DSC and DMA provide the bulk signal, whereas Micro-TA can provide the thermal information specific to small regions within a single sample. The first mode of analysis provided by Micro-TA is conductivity imaging where the thermal conductivity at regions between 100-10,000 square microns can be differentiated. However, this mode of analysis can become immensely difficult to understand the results when the topography of the sample contains many valleys and peaks. The conductivity signal is proportional to the amount of mass in close proximity to the probe; therefore, the peaks and valleys can produce large anomalies in the thermal.
(12) 152. NATHAN WHITELY, WEIBING XU, SEN LI AND WEI-PING PAN. conductivity data. Another mode of analysis is making localized MDSC and TMA measurements. This allows the thermal properties of various positions on the sample’s surface to be compared. A polypropylene (PP) resin was filled with glass bead of different sizes and different relative amounts. Micro-TA was used to characterize the samples. Thermal conductivity imaging was not an appropriate mode of analysis because of the topography of the polymer matrix; instead, Micro-TMA curves shown in Figure 18 were compared.. Figure 18. Micro-TMA Curves of Filled Polypropylene Resin The general shape of the majority of the curves shows a transition around 130°C. Curves 1, 3, and 9 show a more gradual transition. This is a result of the probe being in close proximity to a bead. The glass bead acts as a thermal sink requiring more energy to effectively raise the temperature of the surrounding polymer. Consequently, the sample’s temperature lags behind the temperature of the probe. Curve 4 is an example of the probe resting directly on a glass bead noted by the gradual expansion at high temperatures. The sharp penetration at the end of this curve occurs because the glass bead and surrounding polymer have acquired enough energy to raise the temperature, so the bead sinks into the polymer. Curve 5 penetrates the polymer sharply, then has a gradual expansion followed by a second penetration. This signal occurs because the probe initially has no contact with any glass beads, but upon penetration comes in contact with a glass bead. The second penetration is the result of either the bead sinking into the polymer or the probe slipping off the bead. Curves 6, 7, and 8 show no evidence of any contact with the glass beads, while Curve 2 has an entirely different appearance and no evident explanation of its behavior. A hydrogenated nitrile rubber (HNBR) from a refrigerator’s compressor lipseal was analyzed to determine whether or not the seal was degraded. DSC was chosen as the analysis technique of choice, but the signal from the small portion suspect to degradation (the outer portion of the seal) is lost in the predominant signal of the undegraded sample. Using the thermal imaging was unsuccessful due to the extreme topography of the seal; therefore, Micro-TMA as seen in Figure 19 was used for positional sampling of the undegraded and degraded regions as seen by the naked eye..
(13) CHARACTERIZATION OF POLYMERIC MATERIALS BY THERMAL ANALYSIS, …. 153. Figure 19. Micro-TMA Curves of Compressor Lipseal Five positions in each the undegraded and degraded regions were analyzed and the results compared. The TMA curves from the undegraded region expanded uniformly, but the TMA curves from the degraded region varied from slight expansion to contraction. This figure does show that the two regions are unique, but does not show that the sample contains degraded rubber. To verify whether that the proposed “undegraded” region was actually completely undegraded the seal was compared to control samples of unused rubber. Assuming that oxidation lowers the coefficient of thermal expansion (CTE) the polymer’s different morphologies can be explained. The unused rubber has the highest CTE, while the undegraded region has a slightly lower CTE, but the general shape of the TMA curves is very similar. The TMA curves of the degraded region show that the CTE is significantly lowered and in most case contracts rather than expands upon heating. A corroded stainless steel sample was analyzed using the thermal conductivity mode. Because the surface of the stainless steel sample was machined to eliminate excessive topography, the sample is suitable for the thermal conductivities to be differentiated. The results from SEX-EDX shown in Figure 20 look very much like the Micro-TA results in Figure 21.. Figure 20. SEM-EDX Surface for Corroded Stainless Steel Sample.
(14) 154. NATHAN WHITELY, WEIBING XU, SEN LI AND WEI-PING PAN. Figure 21. Micro-TA Surface for Corroded Stainless Steel Sample The Micro-TA results actually show a more clear definition between the boundaries. Without the EDX function, SEM is incapable of determining whether or not the layers have a different identity or simply a higher concentration of material. The major advantage that Micro-TA possesses over SEM-EDX is the amount of sample preparation. For Micro-TA the stainless steel samples can be analyzed relatively as is, while with SEM the sample preparation is tedious and the working condition are very critical. The previous case studies show significant evidence for the importance of using multiple analytical techniques to study the same systems. Using a single technique limits the ability and increases the difficulty in successfully interpreting the data with respect to explaining the nature of the sample. Using two or more techniques ensures that all assumptions made are valid and resolves any uncertainties gathered from a single set of data. Taking advantage of multiple modes of analysis allows the systems being analyzed to be completely understood with minimal uncertainty. References 1. X. Wie, W.-P. Pan, “Thermal Characterization of Materials using Evolved Gas Analysis,” J. of Thermal Analysis and Calorimetry, 2001, 65, 669-685. 2. Wei Xie, R. Xie, W.-P. Pan, D. Hunter, B. Koene, L. Tan, R. Vaia, “Thermal Stability of Quaternary Phosphonium Modified Montmorillonites”, Chemistry of Materials 2002, 14(11), 4837-4845. 3. Wei Xie, Zongming Gao, Wei-Ping Pan, Doug Hunter, Anant Singh, Richard Vaia, “Thermal Degradation Chemistry of Alkyl Quaternary Ammonium Montmorillonite,” Chem. Mater: 2001, 13, 2979-2990. 4. Wei Xie, Brian Sisk, Wei-Ping Pan, “Micro-Thermal Analysis and Its Applications in Material Science,” NATAS Notes, 2000, 32(3), 9-15..
(15)
Figure
+7
Documento similar
Convection heat loss from cavity receiver in parabolic dish solar thermal power system: A review. Application of phase change materials for thermal energy storage in concentrated
For characterization, we used a method previously developed for the analysis and systematic characterization of HCN-derived polymers that consisted of elemental analysis,
Conceptual model of the system: (a) Thermal sensor connected to the Khepri; (b) Data package generated by the system; (c) Thermal information and georeferentiation of the system
· En el artículo “Characterization of macadamia and pecan oils and detection of mixtures from other edible seed oils by Raman spectroscopy” se caracterizan por Raman
So, we have combined the analysis by two different techniques such as x-ray absorption spectroscopy (XAS) and neutron powder diffraction (NPD) to extend our understanding on
Characterization of the thermal contacts between heat exchangers and a thermoelectric module by impedance spectroscopy (under
In summary, the ability to perform a complete characterization of all TE properties of a bulk material as a function of temperature, from a single electrical impedance
There are a lot of simulation softwares for industrial use, which can develop the processes of identification, execution and optimization of tasks in an assembly chain, design
