Energy efficient real estate or how it is perceived by potential homebuyers in four latin american countries
24
0
0
Texto completo
(2) Sustainability 2019, 11, 3531. 2 of 24. The slow adoption of energy efficiency has been called “Energy Efficiency Paradox”, understood as the discrepancy between the levels of adoption in practice and the cost-effective energy efficient technologies identified by energy-economic models [3,5,6]. The relevance of the informational and behavioural failures in the Energy Efficiency Paradox has been recognised, and the design of policies that provide better information to consumers has been promoted as a tool to avoid behavioural failures and promote adoption [6]. Therefore, informational instruments and regulations have become popular to tackle these issues. Regulations can be approached from a prescriptive point of view (requirements for constructive elements, i.e., thermal transmittance of walls or ceilings) or performance (performance indicators, i.e. demand or consumption heating). Nevertheless, majority of such regulations apply only to new developments or comprehensive retrofits which are far uncommon. For those reasons, the regulation is complemented by the mandatory incorporation of energy certificates [7]. Energy certification for buildings appeared in the 1990s in Europe as a method to allow greater transparency regarding the use of energy in buildings and consequently minimising energy consumption through informed transactions [7]. From then onwards, energy certifications have been periodically reviewed, and the labelling has been defined through a ranking of classes, which can be identified by colours and rankings. Energy labels provide consumers with a way of understanding the environmental and energy impacts associated with products and services and allow the comparison of options [8]. The real estate industry has adopted certificates and labels. As an example, The Energy Performance of Buildings Directive has introduced Energy Performance Certificates (EPC) in the Communitarian real estate market [9,10]. Therefore, EPC allows measuring and raising awareness of the energy efficiency of buildings, aiming to provide energy transparency to real estate transactions and to provide more information for buying or renting decisions. Thus, it is expected that buildings with higher energy efficiency standards receive indirect promotion, since it is understood that the avoided costs in energy have a positive effect on the willingness to pay for them, translated into higher prices that compensate the marginal production costs linked with efficient construction, encouraging real estate developers to achieve these standards. Nevertheless, limitations of conventional regulatory instruments have been found in developed countries, as well as in Latin America, Africa and the Middle East, despite the recent growing use of energy standards in these regions [6,11]. In the context of the Latin American region, energy consumption framed by sustainable urban development appears as a goal for most countries, and regulatory frameworks for energy efficiency have been encouraged. Notwithstanding, policy-makers in the region have focused on economic and social development since they promote the liberalisation of the energy market to achieve lower prices and improving its access [12]. Indeed, in Latin American countries, the inclusion of energy efficiency measures applied to buildings, certificates and labels appears in their public agenda, but the effective adoption has been scarce. However, there is not enough evidence in the literature regarding the causes of such low adoption. In this article, we explore the reasons behind this behaviour, which could respond, on one hand, to the lack of environmental awareness or interest in sustainable attributes that influences the demand or, on the other hand, to the “vicious circle of blame” [13]. To fill this gap, we explored these issues through a targeted survey applied to potential homebuyers in four Latin American countries, aiming to find if sustainable and energy efficiency attributes have potential demand in this region and to define future research agenda from the results. Argentina, Brazil, Chile and Mexico were selected as case studies, where energy certificates exist as tools, but they are not mandatory to be applied in housing transactions. Moreover, certifications are an increasingly relevant topic, due to the early adoption of regulations that affect energy performance in houses in the region and the rate of urbanisation that countries in Latin America experience nowadays. In addition to this, Mexico and Argentina represent approximately two-thirds of the energy consumption of the whole region [14], and Chile had the highest growth rate in the region, with an average annual growth of 7% [15]..
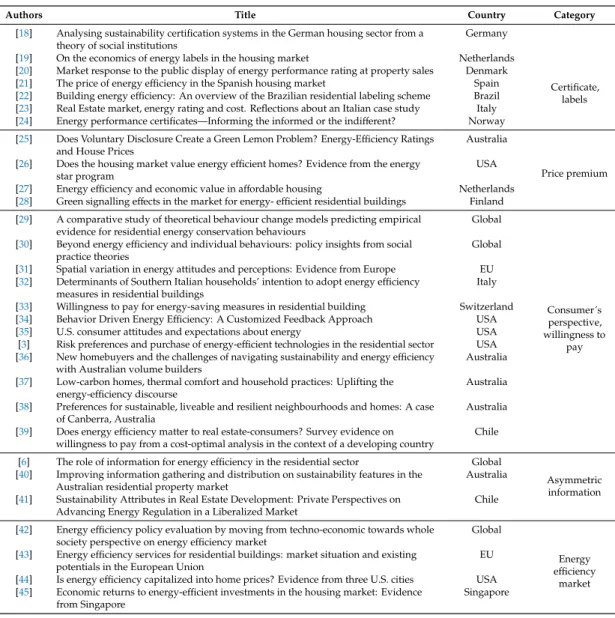
(3) Sustainability 2019, 11, 3531. 3 of 24. The remainder of this article is organised as follows. In Section 2, a scoping review is presented regarding the consumer’s perspective on energy efficiency and sustainable attributes in order to find research gaps in this area. In Section 3, it is described how the four countries selected have built their regulatory frameworks around buildings energy efficiency and the role of residential labelling in the context of developing economies. In Section 4, the methodology used for a survey applied with exploratory purposes to consumers who were looking for homes is presented. In Section 5, the results are presented. Finally, in Section 6, the results of the study are discussed, aiming to understand the reaction of consumers to energy efficiency and sustainable attributes to propose a future research agenda in the field. 2. Scoping Review: Consumer’s Perspective 2.1. Study Selection A scoping review was used to rapidly map the existing literature on sustainable construction and residential real-estate market from the consumer’s perspective. The purpose of the review was to identify gaps in the existing literature on this topic, especially regarding Latin America. This study adopted the methodological framework of Arksey and O’Malley [16], which comprises six stages as follows: (1) identifying the research question(s); (2) identifying relevant studies; (3) study selection; (4) charting the data; (5) collating, summarising and reporting the results; and (6) an optional consultation exercise. A team of three scholars participated in the selection of the articles. The research question that guided the scope was: what information is available regarding the reaction of consumers to energy efficiency and sustainable attributes concerning their homes, especially in Latin America? Initially, Scopus, Google Scholar and ScienceDirect were used during the first approach, but access to full articles found in that search was available from ScienceDirect. Therefore, the team decided to conduct the scoping review using the search engine ScienceDirect. Publication language was limited to documents in English, and only the first 100 hits were screened because it was assumed that further screening was unlikely to provide many more relevant articles [17]. The keywords were “energy efficiency”, “sustainable” “attributes”, “housing market”, “residential”, and “real/estate market” which were used in the following phrases: “energy efficiency attributes in housing market” (7940 results), “Sustainable attributes in residential real-estate market” (2412 results), and “Consumers’ perceptions on residential energy efficiency” (3677 results). A first selection was made by the team scanning the titles and abstracts. The manuscripts were chosen by their relevance in understanding the consumers’ perspective regarding energy efficiency and sustainable attributes. On the first round, articles were discarded if they did not cover the user’s perspective and if they were focused on other topics, such as eco-labelled building products, green building materials, assessment of energy labels though eye-tracking, tax on land values due to sustainable urban development, policy goals on CO2 emissions, and those unrelated to sustainability or energy efficiency. Finally, 37 articles were selected from which seven were eliminated due to repetition, leaving 30 articles for further reading. The selected papers were read by the team and organised in categories (Table 1). Although the main interest of the researchers was to study experiences in Latin America, most of the articles selected were focused on European countries, USA and Australia, and only three papers included a Latin American country as a case study (Chile and Brazil), of which just one was directly addressed to the consumer´s behaviour. Despite this, the team found that the information provided by the articles was relevant to understand users’ behaviour in different geographical areas, and therefore, they could contribute to the study. Finally, the articles selected for further analysis were those focused on the consumer’s perspective, willingness to pay and asymmetric information, to comprehend the response of consumers to energy efficiency and sustainable attributes. The main topics found in these articles are the perceptions and attitudes, particular characteristics (geographical location, gender, age, income, level of education), and level of information that influence behaviour in consumer’s decisions..
(4) Sustainability 2019, 11, 3531. 4 of 24. Table 1. The initial selection of articles in the scoping review. Authors. Title. Country. [18]. Analysing sustainability certification systems in the German housing sector from a theory of social institutions On the economics of energy labels in the housing market Market response to the public display of energy performance rating at property sales The price of energy efficiency in the Spanish housing market Building energy efficiency: An overview of the Brazilian residential labeling scheme Real Estate market, energy rating and cost. Reflections about an Italian case study Energy performance certificates—Informing the informed or the indifferent?. Germany. [19] [20] [21] [22] [23] [24] [25] [26] [27] [28] [29] [30] [31] [32] [33] [34] [35] [3] [36] [37] [38] [39] [6] [40] [41] [42] [43] [44] [45]. Does Voluntary Disclosure Create a Green Lemon Problem? Energy-Efficiency Ratings and House Prices Does the housing market value energy efficient homes? Evidence from the energy star program Energy efficiency and economic value in affordable housing Green signalling effects in the market for energy- efficient residential buildings A comparative study of theoretical behaviour change models predicting empirical evidence for residential energy conservation behaviours Beyond energy efficiency and individual behaviours: policy insights from social practice theories Spatial variation in energy attitudes and perceptions: Evidence from Europe Determinants of Southern Italian households’ intention to adopt energy efficiency measures in residential buildings Willingness to pay for energy-saving measures in residential building Behavior Driven Energy Efficiency: A Customized Feedback Approach U.S. consumer attitudes and expectations about energy Risk preferences and purchase of energy-efficient technologies in the residential sector New homebuyers and the challenges of navigating sustainability and energy efficiency with Australian volume builders Low-carbon homes, thermal comfort and household practices: Uplifting the energy-efficiency discourse Preferences for sustainable, liveable and resilient neighbourhoods and homes: A case of Canberra, Australia Does energy efficiency matter to real estate-consumers? Survey evidence on willingness to pay from a cost-optimal analysis in the context of a developing country The role of information for energy efficiency in the residential sector Improving information gathering and distribution on sustainability features in the Australian residential property market Sustainability Attributes in Real Estate Development: Private Perspectives on Advancing Energy Regulation in a Liberalized Market Energy efficiency policy evaluation by moving from techno-economic towards whole society perspective on energy efficiency market Energy efficiency services for residential buildings: market situation and existing potentials in the European Union Is energy efficiency capitalized into home prices? Evidence from three U.S. cities Economic returns to energy-efficient investments in the housing market: Evidence from Singapore. Netherlands Denmark Spain Brazil Italy Norway. Category. Certificate, labels. Australia USA. Price premium. Netherlands Finland Global Global EU Italy Switzerland USA USA USA Australia. Consumer´s perspective, willingness to pay. Australia Australia Chile Global Australia Chile. Asymmetric information. Global EU USA Singapore. Energy efficiency market. 2.2. Perception and Attitudes A recurrent model used to explain the adoption of Energy Efficiency Measures (EEM) by consumers is the “Theory of Planned Behaviour” described by Ajzen in 1991 [46]. This theory includes attitude, subjective norms, and perceived behavioural control. Several studies have used this theory to understand the intention to adopt EEMs [47–51]. However, attitudes and perceptions can change after events. Opinions, perceptions and behaviours about energy types, conservation and efficiency, energy policies and related concerns can be determined by issues of the day, environmental events and how they are portrayed in the media [35]. Indeed, examples from other fields have also shown as people’s perception of risks and concerns can constitute an outrage indicator (in the case of Dettori et al. [52] and Lindenmeir, Schleer, & Pricl [53], related to threats to public health and unethical corporate behaviour, respectively). Moreover, Sarkis [29] found a lack of empirical-based studies that could demonstrate how specifically real behaviours could fit into this particular theory. Also, Shen and Cui [34] indicated that personality traits should be included because they influence energy-related behaviours. Moreover, Labanca and Bertoldi [30] criticised the idea that behaviours can be driven by exogenous factors (information, product prices, attitudes, values, objects, infrastructures) based on the idea that individuals make rational decisions (cause-effect relationships). Instead, based on Spurling et al. [54], they argued that social practice theories could inform better energy policy.
(5) Sustainability 2019, 11, 3531. 5 of 24. interventions by recrafting practices changing their elements (materials and meanings), substituting whole practices with alternative ones (other practices that fulfil same needs and wants), or changing how practices are interlocked (e.g., changing interactions within mobility, shopping and eating activities) [30]. Despite these gaps, some researchers keep utilising this model as a way to investigate the household’s intention to adapt and willingness to pay (WTP) for Energy Efficiency Measures (EEMs). For example, Prete et al. [32] extended Ajzen’s Model, including environmental concern in research conducted in a Southern Italian region. They found that there is a positive relationship between environmental concern and intention to adopt EEMs, which coincide with results from previous studies [55,56]. Although attitude seems to be an essential determinant to explain the intention to adopt and WTP for EEMs [32,50,57], environmental and socio-demographic variables (geographical context, income level, education, gender and age of household) have an influence, too [31,32,35,58]. Some studies identify geographical differences, which could be influenced by institutional constraints based on specific regional context and socially embedded choices [31,32,35]. De Cicco et al. [35] found different regional responses regarding the extent to which energy impacts the environment in a survey applied in the United States. Households from the South appear to be less likely to believe that energy affects the environment, whereas respondents from the other three regions did not differ significantly from one another in that respect. Balta-Ozkan and Le Gallo [31] analysed the extent to which energy perceptions and attitudes vary across between large urban, small urban and rural areas in Europe. They concluded that householders in large and small urban areas in Europe are “less likely to think of energy as a nationally important issue compared to their rural counterparts” [31]. In addition to this, large city residents are “less likely to think that renewables will play a significant role in the future energy system but are more likely than those in rural areas to think that national energy policy should be centred on protecting the environment, guaranteeing energy reliability, and less around guaranteeing low prices for consumers” [31]. Urban residents might overlook the potential contribution of renewables due to the lack of space to install these technologies in urban areas, and therefore they are unfamiliar with them. Regarding income level, researchers have found different results on its influence, with some studies showing an effect on households’ income in their degree of investment on energy efficient technology and others showing no correlation. In their study on a Southern Italian region, Prete et al. [32] found that high-income households are more influenced by specific situations or events regarding the use of EEMs and on environmental concerns, while low-income households focus on the advantages or disadvantages of using EEMs. In the same study, Prete et al. (2017) found that highly educated households are more influenced by their environmental concern to undertake actions, coinciding with previous studies [59]. On the other hand, less educated households appear to be more influenced by their attitudes toward EEMs and perceived behavioural control [32]. Encinas et al. [39] found that in Santiago, Chile income and educational level, as well as other demographic aspects, have a positive influence on WTP. In the Latin American country, households with young children and respondents with higher education seem to have a more environmentally friendly behaviour [39]. In respect of consumers’ age, the results of surveys conducted in the United States and Italy indicate that younger users base their decisions on environmental concerns while the latter base them on attitude, perceived behavioural control, and subjective norms coinciding with prior studies [32,35]. Finally, findings of the study of Romanach et al. [37] in Australia suggest that the meaning of energy efficiency for consumers is focused on technological aspects instead of behavioural ones. This means that householders focus on features or attributes they feel disconnected from their routines and behaviours, such as the setting up solar panels. They suggest that the methods for promoting energy efficiency focus mainly on the financial and environmental benefits of energy efficiency (reduction of costs and emissions) instead of other benefits such as thermal comfort..
(6) Sustainability 2019, 11, 3531. 6 of 24. 2.3. Information Asymmetry and Barriers Another factor that influences energy efficiency behaviours is information provision because it can have an impact on consumers’ decisions [31]. Some scholars have found that consumer´s decision to adopt EEMs can be limited by the asymmetric information distribution from sellers to buyers, meaning that users have limited knowledge about prices, alternatives, options and technologies, that provide energy efficiency and sustainable features [32,33,36,40]. This situation coincides with the study of Warren-Myers [36] in Australia, which shows that the implementation barriers related to unclear information, engagement ad unfamiliarity with the opportunities and options available limits the interest of homebuyers. Moreover, homebuyers feel powerless to demand sustainability, and they are put off by the cost of incorporating the available options [36]. Another study from Australia shows that property practitioners are not willing to or interested in highlighting sustainability features to their clients, indirectly affecting the homebuyer´s purchasing decisions [40]. Property practitioners indicate that they do not find reliable and appropriate information of the economic benefits of such features; therefore, they are limited but the concern about the liability they may face if the information is incorrect [40]. This situation fits in the “vicious circle of blame” defined by David Cadman in 2000, where different actors in the real estate market indicate their willingness to undertake actions to incorporate sustainable construction, but they claim that they rely on other actors to make a prior action, generating a spiral of inaction [13]. Encinas et al. [39] indicate that energy labelling policy can help to reduce some causes of the information gap, such as reducing asymmetry by providing relevant information to consumers, standardising the format in which energy efficiency information is presented and, if accompanied by a communication strategy, may support consumers’ awareness on the benefits of energy efficiency. Focused on information barriers to the use of energy efficiency measures in the residential sector, Ramos et al. [6] reviewed the effectiveness of informational instruments, policies and strategies, focusing on energy certificates, feedback programs, and energy audits. Although these instruments seem to be promising and useful, evidence shows mixed results. The potential of energy certificates and labels appears to be less favourable for residential buildings, probably due to a less rational decision-making process of households, perception of higher maintenance costs, and the way information is framed [6]. For the latter, Ramos et al. [6] suggest that it is more effective to show economic losses or energy savings rather than potential benefits. Also, there is not enough information yet to estimate the effect of introducing certificates on energy demand, neither at the aggregate nor at the disaggregate level [6]. Consumers might be discouraged to use more efficient equipment even if certificates show energy savings due to the perception of higher maintenance costs and the potential rebound effects of more efficient appliances [6]. Also, it might be the case that more information can create confusion, having an impact on outcomes [3]. In the Latin American context, Encinas, Aguirre and Marmolejo-Duarte [41] studied how the attributes of energy efficiency and sustainability are advertised in real-estate offers in Santiago de Chile and found that “these attributes are presented mainly as isolated elements, irrespective of the energy performance as a complete system”. Therefore, the information presented is incomplete and does not fill the information gap, leaving buyers unaware of the economic and environmental benefits of energy efficiency and sustainable attributes [41]. 3. Standards, Certifications and Incentives in Latin-America 3.1. Between the Carrot and the Stick: Energy Efficiency Regulations International experience has supported the creation of energy regulations in the context of building and mainly associated with housing in Latin America. These regulations establish the minimum requirements that a project must comply with, ensuring certain conditions of safety and habitability. Although this is associated with the definition of minimum standards, in recent years, the application of these instruments has promoted energy efficiency and sustainability of construction.
(7) Sustainability 2019, 11, 3531. 7 of 24. through regulation [60]. The international experience has supported the creation of energy regulations in the context of building and mainly associated with housing in Latin America. The first energy efficiency initiatives in the region go back to 1996, in the context of a seminar organised by the Economic Commission for Latin America and the Caribbean (ECLAC) and the European Union [61]. According to Ruiz [62], the most important achievement of this event was the introduction of the concept “energy efficient use” into the regional agenda. During the 1990s, several Latin America countries suffered deep economic reforms, including restructuring, liberation and privatisation of the energy sector [12,61]. Energy regulations establish the minimum requirements that a project must comply with, ensuring certain conditions of safety and habitability. Although this is associated with the definition of minimum standards, in recent years, the application of these instruments has promoted energy efficiency and sustainability of construction through regulation [60]. The adoption of these can be understood through the analogy of the “carrot and stick” metaphor—a combination of reward and minimum requirements to induce the desired behaviour—which, in the case of developing countries has shown serious barriers or to be ineffective. Given that the initial investment traditionally is one of the main barriers to the adoption of sustainability by the market [11,63,64], public subsidies or rewards have been very useful to overcome these economic gaps. In fact, according to the literature, there is an “energy efficiency gap” that slows the diffusion of energy-efficient products below the socially optimal rate [39]. The studies of Gillingham and Palmer [65], and Gillingham et al. [66] have presented some causes for such gap, especially related to the information asymmetry, investment decisions, credit restrictions and government regulations. However, these public instruments do not discard incentives that the private sector can carry out, which in developed countries have been addressed, from financial institutions, insurance companies or electricity distribution companies, among others [60]. Under this logic, since “carrots” are inefficient or insufficient to generate a significant change, “sticks” appear in place. However, given that sustainable construction is gradually becoming the “only way to build” [67], regulations are becoming stricter, and incentives are focusing directly on promoting the adoption of high standard performance concerning the energy efficiency of buildings [60]. Between these two approaches—the carrot and the stick—energy labels applied to buildings have become instruments of mandatory application in contexts such as the European community. One of the reasons to make energy labels mandatory has been the need for overcoming information asymmetries, which has been identified as one of the leading market failures for sustainable construction [68]. Moreover, the difficulty for the end user in getting objective, third part, and available information about building quality, practical energy efficiency and other characteristics, such as indoor air quality, has led to “a market for lemons” (which, in colloquial American speech refers to a car of poor quality). According to Akerlof [69], the used car market is a clear example of the existence of information asymmetries between the seller and the buyer, generating a devaluation of used cars of good quality which are not “lemons”. This analogy has been used to explain why lower-quality houses end up displacing high-quality (energy-efficient) homes, discouraging new investments in sustainable construction [70]. Energy labels can take the form of voluntary certifications, which seek to promote a set of private benefits associated with the production of public goods. In this context, private certifications—which are also applied by third parties without commercial interests related to supply and demand, such as LEED by the United States Green Building Council (USGBC) and BREAAM by the Building Research Establishment (BRE) in the UK— in addition to energy efficiency, incorporate other criteria linked to sustainable construction, such as water saving, environmental quality or impact of materials on the environment. A study developed by Iwaro and Mwasha [11] reported that the Latin American region seemed to be in the early stages of developing energy efficiency regulations, with countries without any regulatory framework in place, while in others they were being implemented, although they were not mandatory yet. Below, we describe how the four countries selected for analysis have built their regulatory frameworks around energy efficiency..
(8) Sustainability 2019, 11, 3531. 8 of 24. 3.2. The Normative Context in four Latin American Countries In Argentina, the energy regulation of buildings has a set of norms that have been periodically studied and updated since 1964 [71]. These regulations are prepared by the Subcommittee on Thermal Conditioning of Buildings of the Argentinian Standardization Institute (IRAM, by its Spanish initials) and are designed to guarantee the conditions of hygrothermal habitability, hygiene and sanitation. The compliance of these standards is voluntary throughout the country, except in the Province of Buenos Aires (since 2003, Law 13.0590/03), in the city of Rosario (since 2010) and in the Autonomous City of Buenos Aires (since 2012), where they are mandatory by law. Regarding the energy labelling of buildings, in 2010 the IRAM 11,900 standard was approved, which indicates the energy efficiency in the heating of buildings. The norm was revised in 2017 and currently is voluntary. The label is similar to the one used to qualify the energy efficiency of household appliances, such as refrigerators, washing machines, and lamps [22]. In Brazil, regulations regarding conservation and rational use of energy emerged in the 1980s with the implementation of the Brazilian Labelling Program (PBE) developed by the National Institute of Metrology, Quality, and Technology (IN-METRO), a federal agency of the Ministry of Development, Industry and Foreign Trade [22]. In 2001, after a national energy crisis, the first energy efficiency standard was introduced to determine the maximum energy consumption and energy efficiency of both appliances and buildings, based on specific indicators and regulations [22]. The Action Plan for Energy Efficiency in Buildings started in 2003 (PROCEL Edifica), and a Technical Group was established to improve the energy efficiency in buildings (GT-Buildings) [72]. In the context of this program, different criteria were developed for the labelling of buildings: in 2009 the “Regulation of Energy Efficiency Labelling for Commercial, Services and Public Buildings” was published (RTQ-C) and in November 2010 it was published for Residential Buildings (RTQ-R). Currently, the labelling is voluntary, except for federal public buildings of more than 500 m2 or reconditioned as of 2014, although it is expected to become mandatory progressively [72]. Parallel to this initiative, in 2005 the first standard of thermal behaviour of buildings was developed, which considers the calculation of the thermal properties of the elements and components of a building and provides the main guidelines for the construction of the single-family social housing [22]. In Chile, the “Thermal Regulation” was defined in 2000, in which the maximum permissible thermal transmittance for roofing was included as a requirement for residential buildings, being one of the first Latin American countries to adopt energy regulation for housing. This regulation was updated in 2007, including thermal conditioning requirements for roofing, perimeter walls and ventilated floors [73]. Although Chile was seen as a proactive country regarding building energy efficiency by the World Bank, the regulation was considered “lenient” compared to the international context [74]. Consequently, the OECD advised the country to improve the standards for thermal envelopes [75], therefore the thermal regulations were updated in 2014 [76]. The upgrade was included as a reference for the Standards of Sustainable Construction [77], instead of creating a mandatory regulation [39]. Since 2013, Chile has implemented a voluntary home energy rating to evaluate the energy efficiency of dwellings based on hot water, lighting and heating consumption. The labelling is similar to that of the EPC, i.e., a ranking goes from the most to the least efficient in a range of letters from A+ to G, where E represents the standard of the current thermal regulations. In Mexico, given the critical role of the housing sector in energy consumption and polluting emissions, the government, in conjunction with the housing industry, has implemented a set of initiatives related to sustainability and residential energy efficiency, with greater emphasis on social issues. Both the Sector Energy Program (PSE) and the National Program for the Sustainable Use of Energy (PRONASE) define strategies for the housing sector. The PSE promotes the implementation of energy efficiency technologies by establishing it as a requirement to grant social housing subsidies. Social houses are delivered by the National Commission of Housing (CONAVI), the National Institute of Workers’ Housing (INFONAVIT) addressed to employees of private companies and the Housing Fund of ISSSTE (FOVISSSTE) addressed to public servants. Besides this, INFONAVIT, with advice.
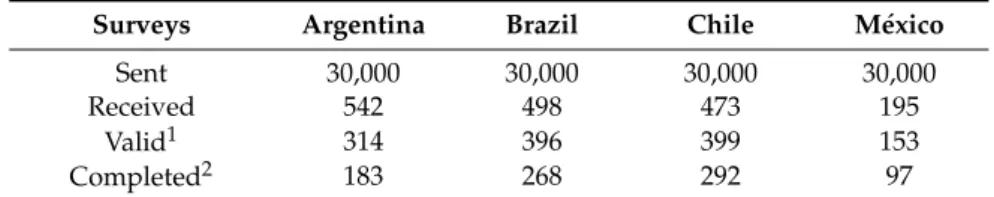
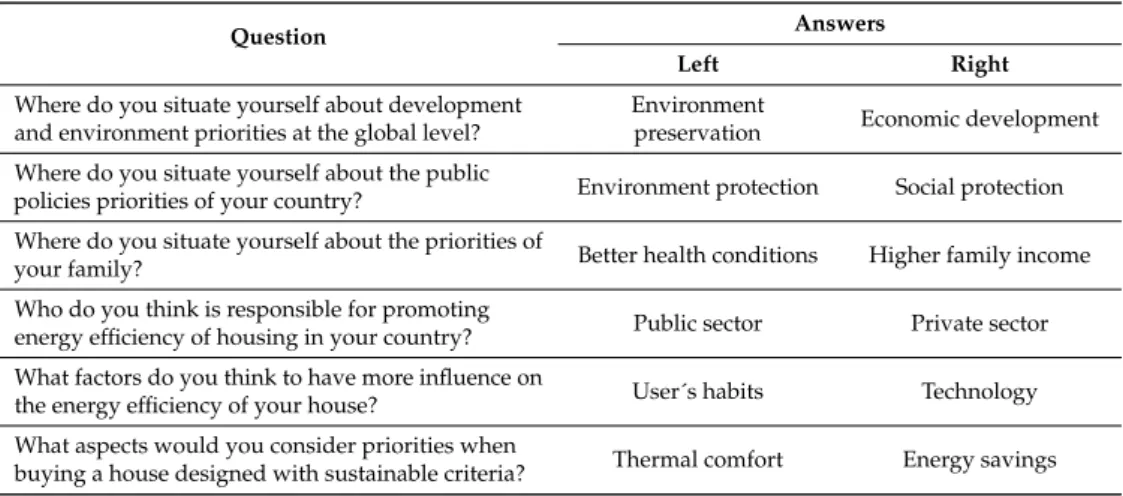
(9) Sustainability 2019, 11, 3531. 9 of 24. from IDEA Foundation and GIZ, has established an energy rating tool for housing: SISEVIVE. Various agencies and institutions of the housing sector have promoted this tool to have a standard rating system in the sector at the national level. Despite the promotion of energy efficiency, a general regulatory framework is needed to regulate and grant general guidelines to all building certification programs. In conclusion, in the four countries studied, there is an interest of public bodies in promoting and facilitating the adaptation of sustainability strategies, including energy efficiency in the residential sector. However, the compliance is not reflected in the totality of the housing stock or the entire extension of the countries’ territories. The implementation of a subsidy policy that promotes the incorporation of thermal insulation and the efficient use of energy for Argentina, Brazil and Chile has been envisaged [71]. However, as the Mexican case has shown, the adoption of certifications and subsidies on a discretionary basis may mean that only social housing projects, as well as buildings of high socioeconomic sectors, are the only ones to incorporate the new standards [78]. In that sense, between “the carrot and the stick” in Latin America, it seems that the adoption of mandatory instruments may be needed for overcoming information asymmetries, a “market of lemons” and a “club good” as the result of the discretional application of energy ratings [79]. At this moment, all four countries have residential energy efficiency labelling but applied as voluntary schemes. In that sense, it is possible to question if the lack of mandatory regulations responds to a scarce environment awareness in the region or if it exists because of a structural problem regarding the construction sector (that can be associated to the “vicious circle of blame”). Thus, to fill this gap, this paper explores, by means a targeted survey, whether energy efficiency attributes has a potential demand in the region. 4. Methodology A survey was conducted between August and September of 2017 in the selected four Latin American countries to understand the opinion of consumers regarding energy efficiency and sustainable attributes. The survey was sent to 30,000 registered users in “Mercado Libre” that were looking for homes to buy in each country, of which 183 were completed in Argentina, 268 in Brazil, 292 in Chile and 97 in Mexico (Table 2). Mercado Libre is a company with a presence in several countries of Latin America, which provides an electronic commerce platform that integrates real estate property online listings. It is important to mention that this registry is an interesting approach for willingness to buy since registered users receive alerts when new dwellings match their desired features. The first question allowed filtering out those who were effectively looking to buy a home. The sample was defined at 90% confidence level and with a margin of error of 10%. Table 2. Survey sample. Surveys. Argentina. Brazil. Chile. México. Sent Received Valid1 Completed2. 30,000 542 314 183. 30,000 498 396 268. 30,000 473 399 292. 30,000 195 153 97. 1. Total of surveys that answer “yes” to the question: “Are you looking for or have you been looking for a house to buy?”; 2 Surveys that responded to all the questions.. The objective of the survey was to get the opinion of users regarding preferences of economic development versus natural environment at global, national and familiar level; aspects that have an influence in the energy efficiency of houses; the role of promoting energy efficiency of housing; their priorities to buy a house with sustainable criteria; and their socioeconomic status. Consequently, a “bipolar or contrapositive format” was used to design questions, which allows identifying compensatory effects in issues that usually are rivals (Table 3). The visual representation of the questions for the respondents was a “slider scale”: a bar with the rival issues at each end, where respondents use a slider to position themselves within the two extremes for each specific question (Figure 1)..
(10) features. The first question allowed filtering out those who were effectively looking to buy a home. The sample was defined at 90% confidence level and with a margin of error of 10%. Table 2. Survey sample. Surveys Argentina Brazil Chile México Sent 30,000 30,000 30,000 30,000 Received 542 498 473 195 1 Table 3. Valid Questions of the314 survey with 396the contrapositive 399 153format.. Sustainability 2019, 11, 3531. Completed2. 183. 268. 292. Question. 10 of 24. 97. Answers. Total of surveys that answer “yes” to the question: “Are you looking for or have you been looking Left Right for a house to buy?”; 2 Surveys that responded to all the questions. 1. Where do you situate yourself about development and environment priorities at the global level?. Environment preservation. Economic development. TheWhere objective the yourself surveyabout wasthe topublic get the opinion of users regarding preferences of economic do youof situate Environment protection Social protection policies priorities of your country? development versus natural environment at global, national and familiar level; aspects that have an do energy you situate yourself about the priorities influenceWhere in the efficiency of houses; theofroleBetter of promoting energyHigher efficiency housing; their health conditions familyof income your family? priorities to buy a house with sustainable criteria; and their socioeconomic status. Consequently, a Who do you think is responsible for promoting Public sector Privateallows sector identifying “bipolar energy or contrapositive format” was used to design questions, which efficiency of housing in your country? compensatory effects in issues that usually are rivals (Table 3). The visual representation of the What factors do you think to have more influence on User´s habits Technology thefor energy of your house? questions theefficiency respondents was a “slider scale”: a bar with the rival issues at each end, where What aspects priorities when within the two extremes for each specific question respondents use a would slideryou to consider position themselves Thermal comfort Energy savings buying a house designed with sustainable criteria? (Figure 1).. Figure 1. 1. Example Example of of aa question question following following the the “contrapositive “contrapositive format.”. format.”. Figure. A A critical critical observation observation of of the the experience experience with with this this survey survey method method is is the the lack lack of of commitment commitment to to the the answers. answers. In most of the the responses, responses, 20–35% 20–35% of of users users situate situate themselves themselves in in the the middle, middle, so so they they do do not not take take aa clear clear decision decision between between the the options options presented presented as asrivals. rivals. This This type type of of distortion distortion has has been been identified in other survey designs, such as the Likert scale, where respondents may avoid using extreme identified in other survey designs, such as the Likert scale, where respondents may avoid using responses to elude being perceived as extremist in their views, or views, simplyor because do not have extreme responses to elude being perceived as extremist in their simplythey because they do anot clear opinion for all the with contrapositive format,format, the sums the have a clearformed. opinion Therefore, formed. Therefore, foranswers all the answers with contrapositive theofsums responses towards towards each sideeach of theside central axiscentral (excluding central cohort) have been considered, to of the responses of the axis the (excluding the central cohort) have been show clearerto tendencies in the answers. in Also, survey offered someanonymity, questions considered, show clearer tendencies the although answers. the Also, although theanonymity, survey offered might have pushed individuals’ responses to be compromised by “social correctness”, which may some questions might have pushed individuals’ responses to be compromised by “social result in situating themselves in ainpositive light. In addition this, four questions were to included to correctness”, which may result situating themselves in atopositive light. In addition this, four characterise the socio-demographic aspects of socio-demographic the participants: age, gender, level and questions were included to characterise the aspects of educational the participants: age, household composition (Table The resultscomposition of the survey(Table are explained the following gender, educational level and4).household 4). Theinresults of the section. survey are explained in the following section. Table 4. Categorical questions of the survey. Answers. Question What is your age. 1. 2. 18–30 years old. 30–45 years old. 3. 4. 45–65 years old. Over 65 years old. Which gender do you identify most?. Male. Female. I would prefer not to comment. What is the highest study level you have completed?. School. Technical degree. University degree. Postgraduate degree (e.g., master, PhD). How do you define your household?. Household of one person. Couple without children. Couple with children younger than 6. Couple with children between 6 to 18. 5. Couple with children older than 18.
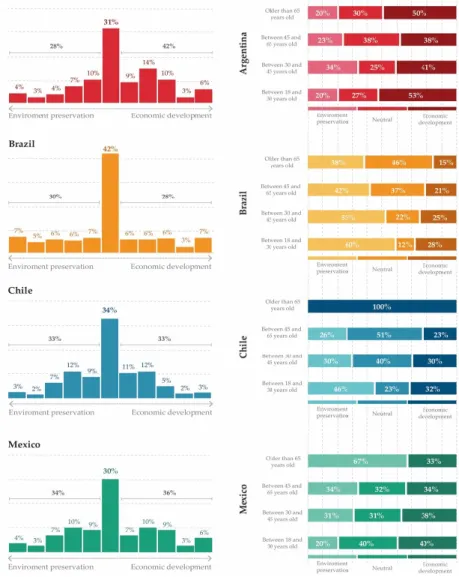
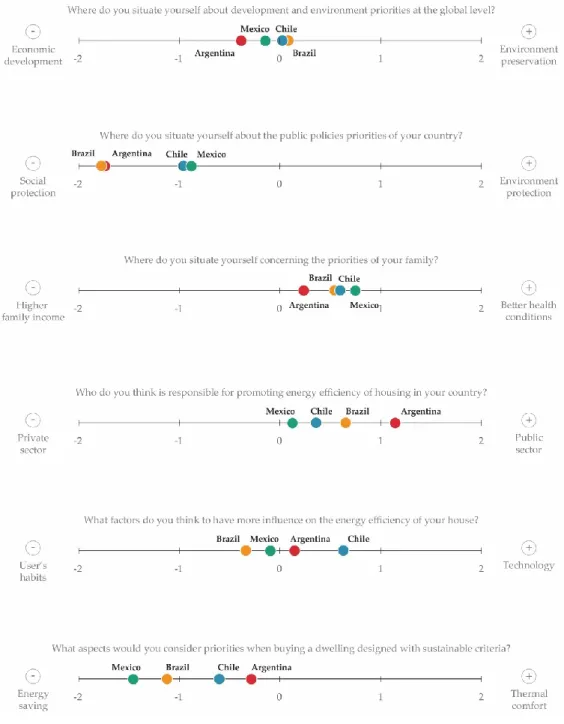
(11) Sustainability 2019, 11, 3531. 11 of 24. 5. Results 5.1. Global Priorities: Environment Preservation versus Economic Development While Brazilian users show a tendency to look for a balance between environmental conservation and global financial concerns, in Argentina, most users situate their priorities towards economic growth. Chilean and Mexican respondents are evenly divided between environmental preservation and economic growth; although in the case of Chile, the respondents tend to find equilibrium between these rival issues (Figure 2). When responses are disaggregated by age, these differences appear to be more apparent. In Brazil, environment preservation seems to be relevant for all ages, but visibly it takes more preponderance for younger users (60%). This happens in Chile as well, where priorities are very different for people older than 65 than users between 18 and 30 years, where a 100% of the former considers economic development as the main issue and only 32% of the youngest rates economic issues as the primary concern. In Argentina, on the other hand, although economic development rates high in importance for all ages, it appears to be crucial for the younger generations (53%). Finally, in Mexico, 67% of users older than 65 years old considers environment preservation as critical, while only 20% of the youngest respondents believe the same. These responses might have been influenced by a perception of environmental degradation in the case of Brazil (e.g., Amazonas river) and Chile (e.g., mines, hydroelectric) and economic struggles in Argentina and Mexico (recessions), in past decades. Sustainability 2019, 11, x FOR PEER REVIEW. 12 of 25. Figure 2. Response to Question 1: Where do you situate yourself about development and. Figure 2. Response to Question 1: Where do you situate yourself about development and environment environment priorities at the global level? priorities at the global level? 5.2. National Development Priorities: Environment Protection versus Social Protection Regarding this question, users from the four countries show a tendency to choose social security (access to education and health) over environmental protection. This decision appears to be more relevant to Argentinian and Brazilian respondents than to Chileans and Mexicans (Figure 3)..
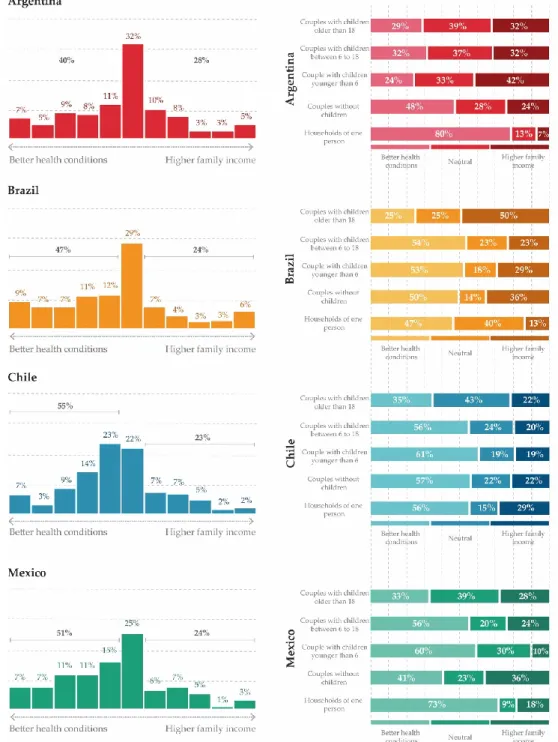
(12) Sustainability 2019, 11, 3531. 12 of 24. 5.2. National Development Priorities: Environment Protection versus Social Protection Regarding this question, users from the four countries show a tendency to choose social security (access to education and health) over environmental protection. This decision appears to be more relevant to2019, Argentinian and REVIEW Brazilian respondents than to Chileans and Mexicans (Figure 3). 13 of 25 Sustainability 11, x FOR PEER. Figure3.3. Response Response to to Question Question 2: Where do you of Figure you situate situate yourself yourselfabout aboutthe thepublic publicpolicies policiespriorities priorities your country? of your country?. 5.3. Family Priorities: Higher Family Income versus Better Health Conditions 5.3. Family Priorities: Higher Family Income versus Better Health Conditions When asked about their family priorities, respondents from the four countries prefer to have When asked about their family priorities, respondents from the four countries prefer to have better health as the result of lower atmospheric contamination rather than having a higher income. better health as the result of lower atmospheric contamination rather than having a higher income. However, there are some differences in the distribution of the responses. Although most Chilean and However, there are some differences in the distribution of the responses. Although most Chilean Mexican users tend to prefer health over salary, that tendency is more exacerbated in Mexico while in and Mexican users tend to prefer health over salary, that tendency is more exacerbated in Mexico Chile users tend to situate themselves closer to the centre of the bar (Figure 4). When the responses are while in Chile users tend to situate themselves closer to the centre of the bar (Figure 4). When the analysed considering household composition, there are two main tendencies: while respondents living responses are analysed considering household composition, there are two main tendencies: while in a household of one person tend to choose health over salary—80% in Argentina, 47% in Brazil, 56% respondents living in a household of one person tend to choose health over salary—80% in in Chile and 73% in Mexico—households formed by couples with children older than 18 years old rate Argentina, 47% in Brazil, 56% in Chile and 73% in Mexico—households formed by couples with health very low in comparison other household compositions. children older than 18 years old rate health very low in comparison other household compositions..
(13) Sustainability 2019, 11, 3531 Sustainability 2019, 11, x FOR PEER REVIEW. 13 of 24 14 of 25. Figure 4. Response Question3:3: Where Where do yourself about the the priorities of your family? Figure 4. Response to to Question doyou yousituate situate yourself about priorities of your family?. 5.4. Role of Public versus PrivateSector Sector in in Promoting Promoting Energy 5.4. Role of Public versus Private EnergyEfficiency Efficiency Regarding responsibility promotingthe theenergy energyefficiency efficiency of of housing housing in in their their country, country, most Regarding thethe responsibility of of promoting most Argentinian respondents consider the government to have a primary role (Figure 5). This Argentinian respondents consider the government to have a primary role (Figure 5). This opinion is opinion is not shared by Mexican users, who in turn divide their responses evenly between the not shared by Mexican users, who in turn divide their responses evenly between the government and government and private companies (real state). On the other hand, surveyed respondents from private companies (real state). On the other hand, surveyed respondents from Brazil and Chile show Brazil and Chile show similar answers, because many users (around 45%) express a tendency to give similar many users 45%) express a tendency to give that30%). role to the state, thatanswers, role to thebecause state, while others give(around that responsibility to private companies (around. while others give that responsibility to private companies (around 30%)..
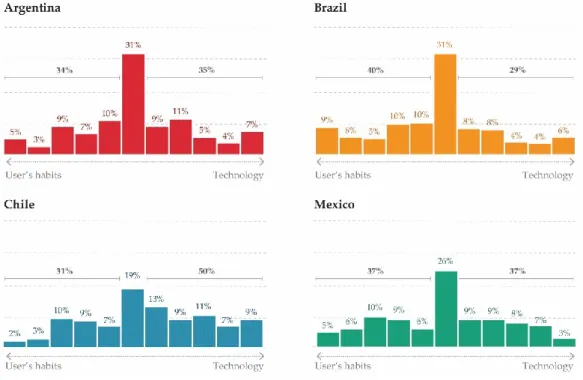
(14) Sustainability2019, 2019,11, 11,3531 x FOR PEER REVIEW Sustainability. 15ofof2425 14. Sustainability 2019, 11, x FOR PEER REVIEW. 15 of 25. Figure 5. Response to Question 4: Who do you think is responsible for promoting energy efficiency of housing in your country? Figure Response Question4:4:Who Whodo doyou youthink thinkisisresponsible responsiblefor forpromoting promotingenergy energyefficiency efficiencyofof Figure 5.5.Response totoQuestion housingininyour yourcountry? country? housing. 5.5. Role of User’s Habits versus Technology as Factors that Influence the Residential Energy Efficiency 5.5. 5.5.Role RoleofofUser’s User’sHabits Habitsversus versusTechnology TechnologyasasFactors Factorsthat thatInfluence Influencethe theResidential ResidentialEnergy EnergyEfficiency Efficiency Users were asked about the influence of their habits, such as the turn of the lights off when Users asked about the influence their habits, such as the as turn ofturn the offlights whenand nobody nobody iswere inwere a room building andoftechnologic aspects, such asthe the typelights of the windows walls , versus Users asked about the influence of their habits, such of off when isnobody in a room, versus building and technologic aspects, such as the type of windows and walls or or heating/air the energy efficiency the as house. Users Argentina, is in a conditioning room, versus systems, building in and technologic aspects,ofsuch the type of in windows andBrazil walls heating/air conditioning systems, in the efficiency of the UsersUsers in Argentina, and andheating/air Mexico show similarities because theenergy responses are evenly along bar.Brazil However, or conditioning systems, inenergy the efficiency ofhouse. the spread house. inthe Argentina, Brazil Mexico show similarities because the responses are evenly spread along the bar. However, respondents respondents show a because strong tendency to giveare thatevenly role to spread building and technologic aspects and Mexico from showChile similarities the responses along the bar. However, from Chile a strong tendency to give that role building and aspects (Figureaspects 6). (Figure 6).show respondents from Chile show a strong tendency to to give that role totechnologic building and technologic (Figure 6).. Figure 6. Response to Question 5: What factors do you think to have more influence on the energy Figure 6. Response to Question 5: What factors do you think to have more influence on the energy efficiency of your house? Figure to Question 5: What factors do you think to have more influence on the energy efficiency6.ofResponse your house? efficiency of your house?.
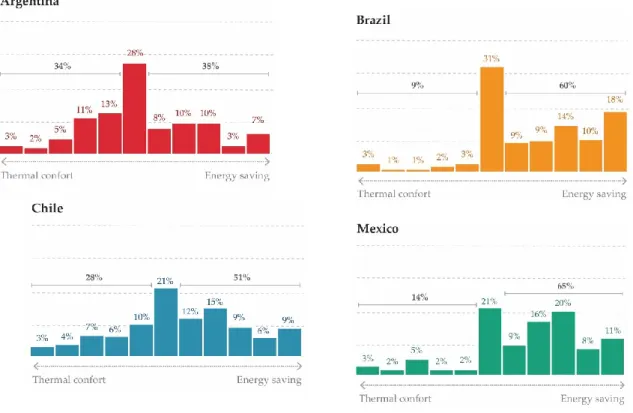
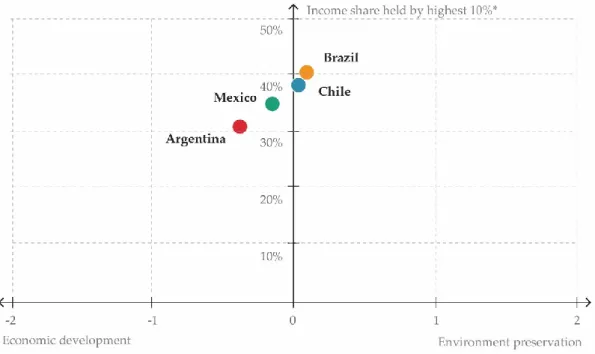
(15) Sustainability 2019, 11, 3531 Sustainability 2019, 11, x FOR PEER REVIEW. 15 of 24 16 of 25. 5.6.Thermal ThermalComfort Comfortversus versusEnergy EnergySaving Saving Priorities Buying a House with Sustainable Criteria 5.6. asas Priorities forfor Buying a House with Sustainable Criteria Concerningthis thisquestion, question,answers answersininBrazil Braziland andMexico Mexicoshow showa similar a similar tendencytoto prioritise Concerning tendency prioritise energysaving saving(paying (payingless lessforforelectricity) electricity)instead insteadofofthermal thermalcomfort comfort(having (havingananadequate adequateindoor indoor energy temperature).Most MostChilean Chileanrespondents respondentsalso alsoselect selectenergy energysaving savingasasthe themain mainfactor. factor.However, However,anan temperature). important number of users consider thermal comfort their responses. are the important number of users also also consider thermal comfort in theirin responses. Different Different are the answers answers from Argentinian users,a who show a balance in their responses, giving to thermal comfort from Argentinian users, who show balance in their responses, giving to thermal comfort an important an (Figure important roleanswers (Figure could 7). The could be explained by climate between the role 7). The beanswers explained by climate differences betweendifferences the countries studied, countries where Brazil andtemperatures Mexico havethan warmer than Chile and where Brazilstudied, and Mexico have warmer Chiletemperatures and Argentina. Although thisArgentina. depends thisofdepends the city, in each responses from the onAlthough the location the city,on in the eachlocation country,ofmost responses arecountry, from themost capitals, whichare have very capitals,climates. which have very different climates. different. Figure 7. Response to Question 6: What aspects would you consider priorities when buying a house Figure 7. Response to Question 6: What aspects would you consider priorities when buying a house designed with sustainable criteria? designed with sustainable criteria?. Discussion 6. 6.Discussion Resultsofof the survey were synthesizedinin indicatorsthat thatconsider considerthe the direction the answers Results the survey were synthesized indicators direction ofof the answers vectorially. doing difference between of responses was calculated from the(zero) centre vectorially. In In doing so, so, the the difference between a set aofset responses was calculated from the centre (zero) towards each of the extremes with 5 or −5, accordingly. This difference reflects the perception towards each of the extremes with 5 or −5, accordingly. This difference reflects the perception of ofrespondents the respondents towards one statement the eliminating other, eliminating Consequently, the towards one statement or theor other, central central values. values. Consequently, some some weighted analysis indicators were defined for each question of the survey, where the sign weighted analysis indicators were defined for each question of the survey, where the sign determines determines the inclination towards one or another side of the contrapositive format (Figure 8). the inclination towards one or another side of the contrapositive format (Figure 8). Figures 9 to 14 show a comparison of these new indicators with data from the countries available from the World Bank [80], through a series of perceptual maps. In all cases, it suggests some formation patterns between the weighted indicator and aspects such as electric power consumption and economic data, among others. In this sense, when comparing the values with the production of electricity based on renewable energies (Figure 9), we can hypothesise that there exists a discourse related to the generation of clean energy that can impact on the trend toward environmental preservation. Similarly, when comparing the indicator of income share held by the highest 10% of the population regarding environmental preservation, there is a tendency to favourably evaluate environmental preservation when this participation is higher (Figure 10). On the contrary, annual GDP growth has a positive relationship with valuing environmental protection rather than social protection, a result consistent with the expected perceptions in developing.
(16) Regarding the assessment of technologies as an approach for improving the energy efficiency of buildings, this has a direct and positive relationship with income, expressed through the GDP per capita (Figure 13). This finding can be considered as expected, but difficult to manage because the user´s habits also represent a relevant aspect of achieving the optimum efficiency of a dwelling. However, there is also a correlation between electric power consumption per capita and Sustainability 2019, 11,for 3531 appreciation energy savings rather than thermal comfort as priorities for buying a house16 of 24 designed with sustainable criteria (Figure 14), which is also expected.. Figure 8. Results of the weighted analysis indicators by country.. Figure 8. Results of the weighted analysis indicators by country.. Figures 9–14 show a comparison of these new indicators with data from the countries available from the World Bank [80], through a series of perceptual maps. In all cases, it suggests some formation patterns between the weighted indicator and aspects such as electric power consumption and economic data, among others. In this sense, when comparing the values with the production of electricity based on renewable energies (Figure 9), we can hypothesise that there exists a discourse related to the generation of clean energy that can impact on the trend toward environmental preservation. Similarly, when comparing the indicator of income share held by the highest 10% of the population regarding environmental preservation, there is a tendency to favourably evaluate environmental preservation when this participation is higher (Figure 10). On the contrary, annual GDP growth has a positive relationship with valuing environmental protection rather than social protection, a result consistent with the expected perceptions in developing societies, with industries focused on the exploitation of raw materials (Figure 11). If we compare annual GDP with the intensity level of primary energy—associated.
(17) Sustainability 2019, 11, 3531. 17 of 24. with an indirect measure of industrial production—there is a relation with greater social protection 18 of 25 levels of industrialisation (Figure 12). 18 of 25. Sustainability 2019, 11, x FOR PEER REVIEW that could 2019, be explained due REVIEW to higher Sustainability 11, x FOR PEER. Figure 9. Weighted analysis indicator for the question: Where do you situate yourself in relation to Figure 9. 9. Weighted Weightedanalysis analysisindicator indicatorfor for thequestion: question: Where do you situate yourself in relation Figure you situate yourself in relation to development and environment prioritiesthe at the globalWhere level?do versus electricity production from to development and environment priorities at the global level? versus electricity production from development and environment priorities at the global level? versus electricity production from renewable sources (excluding hydroelectric) for the year 2014 by country according to The World renewable sources sources (excluding (excluding hydroelectric) hydroelectric) for for the the year 2014 2014 by country country according according to to The The World World renewable Bank [80]. (*) Includes geothermal, solar, tides, wind,year biomass,by and biofuels. Source: IEA Statistics Bank [80]. [80]. (*) (*) Includes Includes geothermal, geothermal, solar, solar, tides, tides, wind, Source: IEA IEA Statistics Statistics Bank wind, biomass, biomass, and and biofuels. biofuels. Source: OECD/IEA 2014. OECD/IEA 2014. OECD/IEA 2014.. Figure 10. 10. Weighted Weighted analysis analysis indicator indicator for for the the question: question: Where Where do do you you situate situate yourself yourself about about Figure development and environment priorities at the global level? versus income share held by highest Figure 10. Weighted analysis indicator theglobal question: you situate yourself about development and environment priorities for at the level?Where versusdo income share held by highest 10% for the years 2015–2016 by priorities country according to The World Bankincome [80]. (*) Source: World Bank, development and environment at the global level? versus share held by highest 10% for the years 2015–2016 by country according to The World Bank [80]. (*) Source: World Bank, Development Research Group. Data are based on primary household survey data obtained from 10% for the years 2015–2016 by Data country The World Bank [80]. (*) Source: World Bank, Development Research Group. areaccording based on to primary household survey data obtained from government statistical agencies and World Bank country departments. Developmentstatistical Researchagencies Group. and DataWorld are based on primary household survey data obtained from government Bank country departments. government statistical agencies and World Bank country departments..
(18) Sustainability FOR PEER REVIEW Sustainability2019, 2019,11, 11,x3531. 1918ofof25 24. Sustainability 2019, 11, x FOR PEER REVIEW. 19 of 25. Figure 11. Weighted analysis indicator for the question: Where do you situate yourself about the public priorities of your country? versus GDP growth for the by country Figurepolicies 11. Weighted Weighted analysis indicator question: Where doyear you 2016 situate yourself about the 11. analysis indicator forfor thethe question: Where do you situate yourself aboutaccording the public to The World Bank [80]. (*) Annual percentage growth rate of GDP at market prices based on policiespolicies priorities of yourofcountry? versus versus GDP growth for the for year 2016 country according to The public priorities your country? GDP growth the yearby2016 by country according World (*) Annual growth rate ofaccounts GDPrate at market prices based on constant constant local[80]. currency. Source: World percentage Bank national data, and National Accounts to TheBank World Bank [80]. (*)percentage Annual growth of GDP atOECD market prices basedlocal on currency. Source: World Source: Bank national data, and OECDdata, National Accounts data files. data files. local constant currency. Worldaccounts Bank national accounts and OECD National Accounts data files.. Figure 12. Weighted analysis indicator for the question: Where do you situate yourself about the Figure 12. Weighted analysis indicator the question: Where level do you situate yourself about the public policies priorities of your country?for versus energy intensity of primary energy for the year public policies priorities of to your country? versus energy intensity primary energy for the Figure 12. Weighted analysis indicator the [80]. question: Whereintensity dolevel you of situate about the 2015 by country according The Worldfor Bank (*) Energy level of yourself primary energy is year 2015 by country according to The World Bank [80]. (*) Energy intensity level of primary energy public policies priorities of your country? versus energy intensity level of primary energy for the the ratio between energy supply and gross domestic product measured at purchasing power parity. isyear the2015 ratio energy supply gross domestic at power bybetween country according to The World Bank [80]. (*) Energy intensity of primary energy Energy intensity is an indication of and how much energy isproduct used tomeasured producelevel onepurchasing unit of economic parity. Energy intensity is an indication of how much energy is used to produce one unit of economic is the ratio between supply andEnergy gross domestic productdatabase measured at the purchasing power output. Source: Worldenergy Bank, Sustainable for All (SE4ALL) from SE4ALL Global output. Source: Worldled Bank, Energy forInternational All (SE4ALL) database fromand thethe SE4ALL Global parity. Energy intensity is anSustainable indication of how much energy is used to produce one unit of economic Tracking Framework jointly by the World Bank, Energy Agency, Energy Sector Tracking Framework jointly by the World Bank, International Energy Agency, the Energy output. Source: Worldled Bank, Sustainable Energy for All (SE4ALL) database from theand SE4ALL Global Management Assistance Program. Sector Management Assistance Program. Tracking Framework led jointly by the World Bank, International Energy Agency, and the Energy Sector Management Assistance Program..
(19) Sustainability 2019, 11, 3531 Sustainability 2019, 11, x FOR PEER REVIEW Sustainability 2019, 11, x FOR PEER REVIEW. 19 of 24 20 of 25 20 of 25. Figure 13. Weighted analysis indicator for the question: What factors do you think to have more Figure Figure13.13.Weighted Weightedanalysis analysisindicator indicatorfor forthe thequestion: question:What Whatfactors factorsdo doyou youthink thinktotohave havemore more influence in the energy efficiency of your house? versus GDP per capita based on purchasing power influence in the energy efficiency of your house? versus GDP per capita based on purchasing power influence in the energy efficiency of your house? versus GDP per capita based on purchasing power parity (PPP) for the year 2017 by country, according to The World Bank [80]. (*) Source: World Bank, parity (PPP) according toto The Bank [80]. parity (PPP)for forthe theyear year2017 2017bybycountry, country, according TheWorld World Bank [80].(*)(*)Source: Source:World WorldBank, Bank, International Comparison Program database. International Comparison Program database. International Comparison Program database.. Figure 14. 14. Weighted Weighted analysis analysis indicator indicator for for the the question: question: What What aspects aspects would would you you consider consider priorities priorities Figure Figure 14. Weighted analysis indicator for the question: What aspects would you consider priorities when buying buying aa house house designed versus electric electric power power consumption consumption per when designed with with sustainable sustainable criteria? criteria? versus per when buying a house designed with sustainable criteria? versus electric power consumption per capita for the year 2014 by country, according to The World Bank [80]. (*) Electric power consumption capita for the year 2014 by country, according to The World Bank [80]. (*) Electric power capita for the year 2014 by country, according to The World Bank [80]. (*) Electric power measures the measures production power plants and combined heat and power less transmission, consumption theofproduction of power plants and combined heatplants and power plants less consumption measures the production ofown power plants and combined heat Source: and power less distribution, and transformation losses and use by heat and power plants. IEA plants Statistics transmission, distribution, and transformation losses and own use by heat and power plants. Source: transmission, distribution, and transformation losses and own use by heat and power plants. Source: OECD/IEA 2014. IEA Statistics OECD/IEA 2014. IEA Statistics OECD/IEA 2014.. Regarding the assessment of technologies as an approach for improving the energy efficiency of buildings, this has a direct and positive relationship with income, expressed through the GDP per capita (Figure 13). This finding can be considered as expected, but difficult to manage because the user´s.
(20) Sustainability 2019, 11, 3531. 20 of 24. habits also represent a relevant aspect of achieving the optimum efficiency of a dwelling. However, there is also a correlation between electric power consumption per capita and appreciation for energy savings rather than thermal comfort as priorities for buying a house designed with sustainable criteria (Figure 14), which is also expected. 7. Conclusions This paper presents a scoping review focused on the consumer’s perspective on energy efficiency and sustainable attributes in buildings. The main topics found in the revision are the perceptions and attitudes, the characteristics of the users, and the influence that the level of information has on consumer’s decisions. The “Theory of Planned Behaviour” by Ajzen [46] is used to explain attitude, subjective norms, perceived behavioural control, and intention to adapt and willingness to pay for energy efficiency measures. Also, the literature indicates that another factor that influences energy efficiency behaviour is information provision and asymmetric information distribution. The information provided to consumers has shown to be crucial, and the paper explores the user’s perspective in the Latin American context, where regulatory frameworks have been introduced in the past decades in a context of a liberalised real estate market. In order to understand the reaction of consumers to energy efficiency and sustainable attributes, a survey was applied to consumers from Mexico, Brazil, Argentina and Chile. The paper explores the opinions of homebuyers from these four countries, analysing their opinions on sustainability, energy efficiency, and the role of the state versus the individual role, among other issues. Significant findings are observed, such as the relationship between the macroeconomic context and responses to energy efficiency, or the relationship between habits and the adoption of constructive technologies concerning economic growth, where a direct and quantifiable relationship is observed. In addition to this, there is a significant difference between Chile—which has an established neoliberal economy—and countries that have economies in transition, where the concept of energy efficiency can be understood as a collective effort rather than an individual one. Also, there are different views on the role of the State, and the houses thermal comfort, which is considered a matter of rights and habits rather than a mere technological problem. From the results, it can be observed that the countries, despite their common cultural origin, do not have significant differences between the factors associated with the preservation of the environment as opposed to economic growth. In this sense, the conditions of economic growth, based on a process of industrialisation and exploitation of raw materials, allow to visualise a higher preference towards spending on technology as an approach to energy efficiency and therefore a process less focused on the habits of use by the inhabitants. Finally, for driving more sustainable behaviours and creating demand and markets for sustainability, consumers should be engaged in the implementation of these standards, creating a twofold process including homebuyers on one hand and mandatory requirements for builders on the other. This study has an exploratory purpose of identifying consumers’ perception of energy efficiency and sustainability to promote a future research agenda in the Latin American context. Author Contributions: F.E., C.M.-D. and C.A. conceived and designed the survey applied to potential homebuyers in the four Latin American countries; E.W. led the scoping review and the bibliographical discussion of the article; F.E. and C.A. performed the analysis of the survey results; C.M.-D. built the theoretical framework and contributed to interpretation of results; and F.E. and E.W. wrote the paper. All authors read and approved this version. Funding: This research was funded by the National Commission for Scientific and Technological Research of Chile, CONICYT, through the FONDECYT Research Initiation Project No.11130556, and from the 2017 Interdisciplinary Research Contest of the Vice Presidency of Research of the Pontificia Universidad Católica de Chile. We also received support from the Spanish Project EnerValor ref. MINECO/FEDER BIA-2015-63606-R and the Centre for Sustainable Urban Development (CEDEUS), CONICYT/FONDAP Project 15110020. Acknowledgments: The authors would like to acknowledge Nicolas Izquierdo, Head of Research, and Ramsses Inojosa, Research Analyst of Mercado Libre Clasificados for their collaboration to design and application of the survey in the four Latin-American countries that made this research possible. The authors are also grateful to the support of the architect Javiera Díaz for reviewing the energy efficiency regulatory framework in the four countries and to the architect Agustín Sepúlveda for elaborating the figures contained in this article..
Figure
+7

Documento similar