Article
Economic Sustainability in Franchising: A Model to
Predict Franchisor Success or Failure
Esther Calderon-Monge1,*, Ivan Pastor-Sanz2and Pilar Huerta-Zavala1
1 Department of Economics and Business Administration, University of Burgos, C/Parralillos, s/n, 09001 Burgos, Spain; [email protected]
2 Department of Economics and Business Administration, University of Valladolid, Avda. Del Valle Esgueva, 6, 47011 Valladolid, Spain; [email protected] * Correspondence: [email protected]; Tel.: +34-947-258967
Received: 9 July 2017; Accepted: 7 August 2017; Published: 11 August 2017
Abstract:As a business model, franchising makes a major contribution to gross domestic product (GDP). A model that predicts franchisor success or failure is therefore necessary to ensure economic sustainability. In this study, such a model was developed by applying Lasso regression to a sample of franchises operating between 2002 and 2013. For franchises with the highest likelihood of survival, the franchise fees and the ratio of company-owned to franchised outlets were suited to the age of the franchise. Surviving franchises were those that opened franchised outlets at a sustainable pace, increased the franchise fee as intangible assets increased, and effectively managed profitability and efficiency.
Keywords:franchise; survival; economic sustainability; Lasso regression model; Spain
1. Introduction
Corporate sustainability entails the pursuit of goals consistent with the broader concept of sustainable development. This broad concept of sustainable development is based on protecting the environment, promoting social equity, and achieving economic development while implementing a management model that fosters dialogue and forges relationships with stakeholders [1]. As a business model, franchising advances economic development by contributing to a country’s gross domestic product (GDP). For example, in the US, where franchising is highly developed, there are 732,842 franchise outlets that provide more than 7.6 million jobs and generate 674 billion USD, accounting for 2.5% of US GDP [2].
Sustainability has three pillars: economic prosperity and development, environmental integrity, and social equity [3]. This study focused on the economic pillar of franchise sustainability. The economic pillar is based on initiatives that aim at ensuring the firm’s long-term survival through innovation, efficiency, and wealth creation [4,5]. In addition, the franchise model is characterized by fluent dialogue and close relationships with one of the principal stakeholder groups: franchisees. Entrepreneurs-franchisors who have successfully tested a highly profitable business concept use franchising to replicate the business concept through the opening of franchised outlets. Franchisor-franchisee relationships are governed by contracts whose clauses are negotiated by both parties. Economic prosperity and development—economic sustainability—enable the firm not only to achieve economic success, but also to enhance its reputation while building stakeholder loyalty [6].
However, franchise chains can fail even if the franchisor has successfully tested the business model using company-owned outlets. Representative bodies such as the International Franchise Association (IFA), the British Franchise Association (BFA), and the Franchise Council of Australia (FCA) disagree about the rate of failed franchise chains [7]. One cause of franchise failure is the failure of franchised outlets [7,8], which jeopardizes the survival of the franchise chain. The aim of this study
was to understand why certain franchise chains fail and others survive. The answer to this question can help franchisors avoid failure and ensure franchise chain survival. To achieve our research aims, we addressed the following research questions: (1) Does the survival of a franchise chain depend solely on its financial success, or does it also depend on its economic sustainability? Some franchise chains keep franchised outlets open even though these outlets are unprofitable. Doing so maintains the chain’s brand recognition and the loyalty of other franchisees, two dimensions of economic sustainability [6], as previously discussed. The negative financial performance of these franchised outlets is offset by the positive performance of other franchised outlets. Such a financial situation is more difficult to sustain under an independent business ownership model; Therefore, (2) if the survival of a franchise chain depends solely on its financial success, why has franchising emerged as an alternative to independent business ownership? If the franchising business model did not enable the aforementioned financial situation, there would be no difference between franchising and independent business ownership. Yet one advantage of franchising over independent businesses is the development of economies of scale derived from product or service standardization and know-how; (3) Does the choice of suitable corporate governance mechanisms that mitigate franchisor-franchisee conflict affect financial success? The franchise contract is the mechanism that governs the franchisor-franchisee relationship by stipulating clauses that affect the financial success of the franchisor and franchisees. To answer these questions and achieve our research aims, we analyzed the causes—financial causes and causes that relate to the mechanisms of franchise governance (i.e., the contract)—of franchise chain sustainability.
The main research aim of this study was to develop a model to predict the failure or success of franchisors. The model included contractual and financial variables. We studied 220 franchisors operating in Spain between 2002 and 2013. These franchisors belonged to three sectors: retailing, hotels, and services. The study period spanned all periods of the franchise chain lifecycle. Results show that franchise-specific variables exerted a considerable influence on the economic sustainability of franchise chains. To ensure that it is economically sustainable, a franchise must maintain a sustainable pace of franchised outlet openings, increase the franchise fee as the franchise incorporates and consolidates services offered to franchisees, and manage its profitability and efficiency.
This study contributes to the literature in several ways. First, it presents a model that predicts franchise chain failure. Although numerous studies have sought to explain business failure, few studies have focused on franchising. Second, the model includes measures of financial performance, which is unusual in franchising studies. Financial performance data for franchise chains is difficult to obtain because most franchises are privately owned [9]. In the literature, it is more common to find studies that analyze franchise failure or survival based on contractual variables.
This paper has the following structure. Section2provides a review of the literature on the economic sustainability of franchises and the survival of franchise chains. Section3presents the research method, describing the sample, variables, and Lasso regression method. Section4presents the results of the analysis. Section5discusses these results and presents the conclusions, limitations, and research opportunities.
2. Economic Sustainability: Franchise Chain Survival
economic stability, the franchisor must create value for franchisees [14], developing trustful relationships with franchisees.
Franchisees’ needs are usually linked to economic clauses that are stipulated in the contract. Notable examples of such clauses include the franchise fee and royalties. These clauses should be carefully drafted considering the age and property structure of the chain so that the franchisor can meet the needs of franchisees without jeopardizing the franchise chain’s survival. Survival has been defined as non-failure, whereas firm failure has been defined in different ways, including discontinuance of business ownership [15], cessation of business [16], bankruptcy [17], and failure to “make a go of it” [18] (p. 52) [19]. There is a lack of consistency regarding the definition of franchise failure [8], which hampers estimation of the rate of franchise failure. Shane and Spell [8] found that most of the US franchisees that they studied failed during the initial years of operations. This failure was related to the size of the chain, the number of services that it offered, its brand recognition, the duration of the contract, the number of employees in the franchised outlets, and the likelihood of belonging to franchise associations. Frazer and Winzar [7] found that the degree of conflict between franchisor and franchisee, franchise system size, and level of franchisee investment are related to franchise failure.
Empirical studies of franchise chain success are more common [20–26]. From the perspective of organizational learning, Gorovaia and Windsperger [20] argue that the success of a franchise chain can be attributed to the franchisor’s capacity to transfer knowledge. Minguela-Rata et al. [21] report that success stems from the capability of franchisees to absorb and apply the knowledge that has been transferred to them. In the context of institutional theory, Shane and Foo [22] explored the propensity to franchise and the rate of franchisor survival, finding that the success of new franchise chains depends on economic efficiencies—economic sustainability—and institutional approval to establish the legitimacy of new franchisors. From the perspective of organizational ecology, Kosova and Lafontaine [23] studied the franchise’s age, size, growth, and survival. Shane [24] examined the effect of incentive contracting on the rate of survival of franchise chains. Kalnins [25] analyzed the relationship between franchisor survival and the franchisor’s commitment to developing an international master franchise, finding that a major commitment negatively affected the survival of the franchisor if that commitment was not easily renegotiable. Azoulay and Shane [26] found that franchisor survival was linked to territorial exclusivity granted by the franchisor.
As previously mentioned, one of the principal goals of franchisors in the 21st century is to ensure the survival of their chains. They can achieve this goal in two ways: by developing trustful relationships [27–29] or by avoiding conflict with franchisees [7,30–32]. To analyze how franchisors develop trustful relationships, studies have focused on measures of relationship quality [33], the franchisee’s perceived relationship value [26], the moderators of the relationship [34], interpretation and perception asymmetries between franchisor and franchisee [35], the control mechanisms adopted to avoid free-riding and opportunistic behaviors [36], and the role of the wider business network [37]. To analyze how franchisors avoid conflict with franchisees, studies have focused on the influence of investments and the franchisor’s support [7,30,31] and the effects of the allocation of decision rights [34]. Grunnhagen and Dorsch [34] found that the allocation of rights for decisions regarding local advertising, personnel, and merchandising—variety of products and store display—improve franchisor-franchisee relations. Franchise-specific aspects, however, such as the economic clauses in the contract—up-front franchise fees, royalties, and the initial investment—can also encourage a trustful relationship between franchisor and franchisee and avoid franchisor-franchisee conflict, which jeopardizes the chain’s survival.
2.1. Variables of the Franchise Agreement
2.1.1. Age
Early studies of organizational survival suggested that age was positively correlated with organizational survival [38–42]. Supposedly, this correlation owed to the lack of legitimacy and sustainable resources associated with the novelty of young organizations [43]. This finding was refuted by later studies, which showed that adolescent organizations have a higher risk of failure than newly created organizations because their initial stock of resources becomes depleted. After adolescence, the risk of failure returns to that of the novelty stage and decreases over time [44]. During the obsolescence stage, older organizations are more likely to fail because of the growing mismatch between resources and environmental conditions [45]. Finally, old organizations are more likely to fail because accumulated rules, routines, and structures eventually reduce these organizations’ efficiency and effectiveness [46]. In franchising, the relationship between franchise survival and the age of the franchise chain has barely been studied [23,24,46]. In one of the few studies on this topic, Dobbs et al. [47] found that a franchise chain needs time to develop a business concept that is capable of making a profit for the franchisor. Therefore,
Hypothesis 1.The likelihood of survival is greater for older franchise chains.
2.1.2. Proportion of Franchised Outlets versus Company-Owned Outlets
The percentage of franchised and company-owned outlets affects profits. Chains with a higher proportion of franchised outlets than company-owned outlets are more profitable [47]. From the perspective of contractual organizational arrangements, franchisees have greater incentives to work hard than employees of company-owned outlets do [48]. Franchisees are more motivated than employees of company-owned outlets are because franchisees receive residual income. Furthermore, the economies of scale that are obtained from the franchise model encourage franchisors to have more franchised outlets than company-owned outlets to compete with other franchise chains.
These mature franchise systems with higher ratios of franchised outlets may be able to overcome issues of adverse selection, moral hazard, holdup, obsolescence, and senescence [47]. Franchisee selection is based on financial requirements and operational considerations [49,50]. Pre-qualification standards are used to safeguard against adverse selection of franchisees who are less likely to succeed in the long term [51,52]. Franchisors who have been operating for longer have probably learned more about the factors that are necessary for their chains to succeed and have better franchisee selection processes. The franchisee selection process is important for franchisors because unsuitable franchisees might cause franchisor-franchisee conflict, leading to the failure of the franchised outlet. It is therefore reasonable to expect that, as a franchise chain gets older and its selection processes improve, the franchise chain will benefit from these improvements and will therefore open more franchised outlets than company-owned outlets.
Moral hazard arises when the agent promises to behave one way but fails to do so, thereby reaping additional rewards (money, time energy, etc.). Therefore, the monitoring costs to avoid moral hazard will decrease with time for franchise chains with higher proportions of franchised outlets, leading to lower mortality rates.
outlets age, they will become better positioned to cope with the threats of obsolescence and senescence. Franchised outlets have lower monitoring costs than company-owned outlets [56], provide franchisors with access to franchisees’ market knowledge and local experience [47,54], and contribute to the profits of franchise chains by limiting the aforementioned effects of obsolescence and age. Therefore,
Hypothesis 2.The likelihood of survival is greater for franchise chains with higher ratios of franchised outlets to company-owned outlets.
Hypothesis 3.Younger franchise chains with high ratios of franchised outlets to company-owned outlets are less likely to survive than older franchise chains with high ratios of franchised outlets to company-owned outlets.
2.1.3. Royalties and Up-Front Franchise Fees
The franchise fee and royalties, both of which are stipulated in the franchise agreement, are two quantities that franchisees must pay franchisors. Both quantities act as incentives for franchisors. They provide an indication of the value of the franchise chain, which should reflect the services offered to franchisees, the cost of operating the franchise and managing the brand, and economic efficiencies [57]. Several studies have examined the relationship between royalties and franchise survival [33,38,58], yet these studies have failed to find significant effects. According to signaling theory, however, high royalties signal the franchisor’s confidence in the demand for the product [59]. Furthermore, the chains that charge high royalties attract franchisees that are capable of generating high income [60], meeting the franchisor’s goal of making a profit [61]. Therefore,
Hypothesis 4.The likelihood of survival is greater for franchise chains that charge higher royalties.
When they negotiate the franchise contract, the franchisor and franchisee establish royalties as a percentage of expected sales. In the initial years of the franchise chain’s operations, there is greater uncertainty as to whether the franchisee will achieve sales targets, partly because of the franchisor’s inexperience. Accordingly, if the franchisee fails to meet sales targets, the franchisee bears all losses [58]. Franchisees, who pay low royalties, however, have higher earnings and therefore greater chances of survival than franchisees who pay higher royalties. Accordingly, charging royalties that are suitable for the chain and varying these amounts over time is necessary to create a stable franchisor-franchisee relationship and ensure the survival of the chain. Therefore,
Hypothesis 5. Younger franchise chains that charge low royalties are more likely to survive than younger franchises that charge high royalties.
for the chain and varying this amount over time is necessary to create a stable franchisor-franchisee relationship and ensure the survival of the chain. Therefore,
Hypothesis 6.The likelihood of survival is greater for franchise chains that charge lower franchise fees.
Hypothesis 7.Younger franchise chains that charge low franchise fees are more likely to survive than younger franchise chains that charge high franchise fees.
2.2. Financial Performance
Franchise agreements also stipulate formal targets. Targets that relate to growth in profitability emphasize the market share and profits after tax. Targets that relate to growth in size, however, focus on increasing sales and reducing margins by lowering prices to boost volume. In saturated markets, achieving sales growth is more difficult because of intense competition. Therefore, if the franchisor charges royalties as a percentage of sales and wishes to meet sales targets, then he or she will have to lower prices. Hence, profit margins will also fall, and the likelihood of failure will rise. Focusing on market share and profits after tax leads franchisees to concentrate on the efficiency of their outlets. Franchise chains that care more about sales than about margins lead franchisees to focus on size. According to Julian and Castrogiovanni [63], Manolis et al. [64], and Phan et al. [65], more attention is generally paid to the growth of sales than profitability. Sales growth thus becomes the basis of the franchisor’s strategy and the focus of the franchise agreement.
Franchise contracts also stipulate an agreement for sharing expenses [65]. This agreement is linked to a sales target and advertising expenses. This agreement indemnifies franchisors and franchisees for opportunism regarding the brand value that is generated by each party’s marketing efforts. The effect of this agreement, however, is to increase the income but not necessarily the profit of the chain. Franchisees’ efforts, which result in greater profit, are more difficult to observe and measure. Therefore, franchise contracts usually link royalties to sales rather than profits because sales are easier to control. Accordingly, franchisors seek to steer the strategies of their franchisees toward strategies designed to maximize sales. Consequently, franchisors base the success of their businesses on the income they generate and focus on maximizing sales. Maximizing sales, however, can be a shared target for franchisor and franchisee because it implies an increase in profit [63]. The problem arises in highly competitive or declining markets, which are respectively characterized by a large number of companies and low demand. The chance of gaining a large, profitable market share in either kind of market is slim. In such cases, franchisees must sacrifice their margins to increase their market share, if the franchisor lets franchisees engage in such practices. Conflict between franchisor and franchisee thereby ensues [66]. Franchisors win if sales are maximized, so they have the incentive to stimulate growth in sales by franchisees. In contrast, franchisees do not win because they have to sacrifice their margins to meet the sales targets set by the franchisor. An additional advantage is the ease of monitoring sales. Therefore, franchisors design contracts that stipulate formal targets based on sales rather than profit.
Hypothesis 8.Franchise chains that base their performance on income (sales) are more likely to survive than franchise chains that base their performance on profitability and efficiency.
3. Research Method
3.1. Sample and Variables
To develop the model, we used financial information for 220 franchisors operating in Spain between 2002 and 2013. These franchisors belonged to three sectors: retailing (123 franchisors), hotels (80 franchisors), and services (17 franchisors). We also used contractual data for each franchisor to test the effectiveness of formal governance mechanisms at predicting failures. These contractual data were gathered for the following variables: franchised outlets as a percentage of total outlets, royalties, up-front franchise fees, annual variation in royalties, annual variation in franchise fees, and the number of years the franchise chain had been operating (franchisor’s age). To test our hypotheses, three interactions among contractual variables were also included in the model. The model therefore comprised 27 variables, 17 of which were financial variables and 10 of which were variables that referred specifically to franchises.
We selected 17 financial variables with the potential to explain bankruptcy risk. These variables have been widely used in the literature [67–69]. Their use in previous studies enhances the comparability of our results. Financial data were gathered from the Sistema de Análisis de Balances Ibéricos (SABI) database. This database is one of the most complete repositories of financial data for firms in Spain and Portugal. In addition, contractual data were gathered for each franchisor. Table1shows the complete list of variables used in the model.
Table 1.Description of financial and contractual variables (additional information about the sample, (descriptive analysis and correlations are not reported in this paper but information is available upon request).
Variable Type Variable Code Variable Description Variable Measure
Financial variables
Var1 Return on equity (ROE) (%) Profitability
Var2 Return on capital employed (%) Profitability
Var3 Return on assets (ROA) (%) Profitability
Var4 Profit margin (%) Profitability
Var11 Profit per employee (thousand Euro) Profitability Var12 Operating income per employee (thousand Euro) Profitability Var13 Personnel expenses/operating income (%) Efficiency Var14 Total equity per employee (thousand Euro) Size/Efficiency Var15 Total assets per employee (thousand Euro) Size/Efficiency Var16 Annual variation in total assets (%) Growth Var17 Annual variation in total equity (%) Growth
Contractual variables
Var18 Royalties (%)
Var19 Up-front franchise fees (thousand Euro) Var20 Age of franchise chain (years) Var21 Annual variation in number of franchised outlets Var22 Annual variation in royalties Var23 Annual variation in up-front franchise fees Var24 Franchised outlets as percentage of total outlets (%)
Interaction variables
Var25 Age and number of franchised outlets
Var26 Age and royalties
Var27 Age and royalties
3.2. Lasso Regression
set of financial ratios as inputs. Logit models make it possible to determine the probability that a firm will fail. In the late 1980s, rule-based expert systems, case-based reasoning systems, and artificial neural networks were successfully applied to bankruptcy prediction [68,69,71]. These approaches overcame some of the statistical restrictions that are associated with logistic regression. More recently, scholars have applied other machine learning methods such as random forest [72–74], support vector machines [75–77], and combinations of these approaches, obtaining increasingly accurate results. The purpose of these hybrid models is to obtain the advantages of individual models without their weaknesses [78,79].
Statistical accuracy is not the only goal, however. Striking a balance between the interpretability of the model and its accuracy is important, particularly if the models are used by individuals who need to understand the dynamics and relationships between variables in the model. Interpreting some of the most sophisticated hybrid models may be more complex than the models themselves. Logistic regression strikes a balance between accuracy and interpretability, although it also has weaknesses. For instance, Hosmer and Lemeshow [80] report that although logistic regression copes with many of the restrictive assumptions of ordinary least squares regression, including linearity, normality, and heteroscedasticity, logistic regression cannot handle multicollinearity. If the number of observations is only slightly larger than the number of covariate variables (p), then variability can be high. The likelihood of the model can be increased by adding more parameters, resulting in overfitting.
If variables are highly correlated or there is collinearity, the model parameters and the variance are expected to be inflated. High variance is not explained by good predictors; rather, it is due to a mis-specified model with redundant predictors. To overcome these limitations, approaches have been designed to impose a penalty depending on the number of predictors in the model. The most common examples of these approaches are ridge regression, least absolute shrinkage and selection operator (Lasso), and elastic net [81–85].
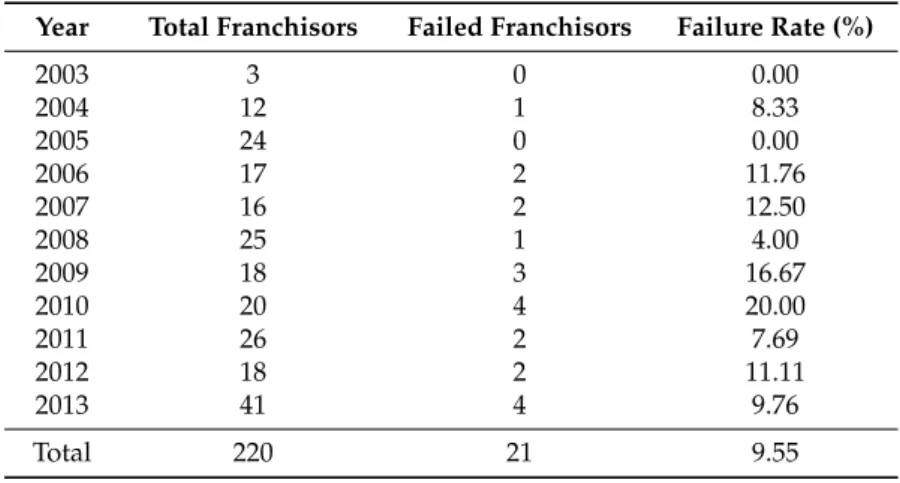
Lasso performs best at overcoming the disadvantages of the other alternatives, and it has recently been applied to forecast corporate bankruptcy [86]. Lasso reduces the number of predictors in the final model. It is useful as a variable selection technique, yielding parsimonious and interpretable models. Thus, we developed a Lasso model to detect the patterns that best explain the likelihood of franchisor failure. From our sample of 220 franchisors, 21 failed during the study period. The data in Table2show how the number of failed franchisors increased in recent years, perhaps because of the global financial crisis.
Table 2.Number of failed franchisors 2002–2013.
Year Total Franchisors Failed Franchisors Failure Rate (%)
2003 3 0 0.00
2004 12 1 8.33
2005 24 0 0.00
2006 17 2 11.76
2007 16 2 12.50
2008 25 1 4.00
2009 18 3 16.67
2010 20 4 20.00
2011 26 2 7.69
2012 18 2 11.11
2013 41 4 9.76
Total 220 21 9.55
for the current year. For the period under study (2003–2013), the overall failure rate of franchises was 9.55%. Before using the Lasso regression model, we carried out some data transformations, which are explained in AppendixA.
4. Results
We applied a Lasso model to the transformed data, as described in AppendixA. Lasso shrinks parameter estimates toward zero, and in some cases equates parameters to zero, thereby excluding some variables from the model. The model was developed in R software using the packageglmnet[87].
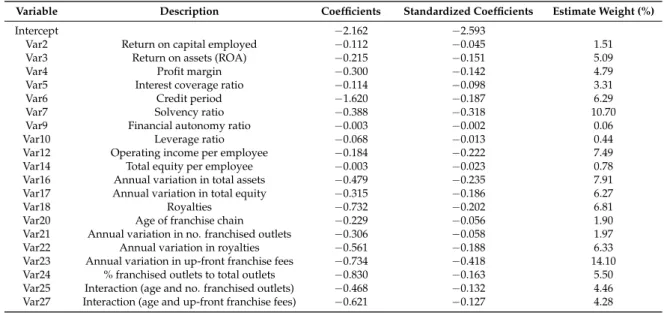
Table3shows the parameter estimates. Of the initial 27 variables, 20 had non-zero coefficients. Surprisingly, only two variables relating to franchise governance control mechanisms were non-significant: up-front franchise fee (Var19) and the interaction between age and royalties (Var26). The following variables were not sufficiently representative to predict franchisor failure: return on equity (Var1), liquidity ratio (Var8), profit per employee (Var11), personnel expenses divided by operating income (Var13), and total assets per employee (Var15). All variables included in the model had a negative sign, as expected. The weight of evidence (Woe) transformation of variables imposed this restriction on the variables.
Table 3.Model estimation.
Variable Description Coefficients Standardized Coefficients Estimate Weight (%)
Intercept −2.162 −2.593
Var2 Return on capital employed −0.112 −0.045 1.51
Var3 Return on assets (ROA) −0.215 −0.151 5.09
Var4 Profit margin −0.300 −0.142 4.79
Var5 Interest coverage ratio −0.114 −0.098 3.31
Var6 Credit period −1.620 −0.187 6.29
Var7 Solvency ratio −0.388 −0.318 10.70
Var9 Financial autonomy ratio −0.003 −0.002 0.06
Var10 Leverage ratio −0.068 −0.013 0.44
Var12 Operating income per employee −0.184 −0.222 7.49
Var14 Total equity per employee −0.003 −0.023 0.78
Var16 Annual variation in total assets −0.479 −0.235 7.91
Var17 Annual variation in total equity −0.315 −0.186 6.27
Var18 Royalties −0.732 −0.202 6.81
Var20 Age of franchise chain −0.229 −0.056 1.90
Var21 Annual variation in no. franchised outlets −0.306 −0.058 1.97
Var22 Annual variation in royalties −0.561 −0.188 6.33
Var23 Annual variation in up-front franchise fees −0.734 −0.418 14.10
Var24 % franchised outlets to total outlets −0.830 −0.163 5.50
Var25 Interaction (age and no. franchised outlets) −0.468 −0.132 4.46 Var27 Interaction (age and up-front franchise fees) −0.621 −0.127 4.28
The standardized coefficients determine the importance of the individual variables in the model. The weight of the financial variables in the model was 53.88%, so 46.22% of franchisor failure or survival depended on the franchisors’ governance mechanisms, which were represented by the contractual variables in the model. Solvency ratio, annual variation of total assets, and the operating income per employee were the most significant financial variables. Annual variation in up-front franchise fees was the most important governance variable in the model. Royalties and the annual variation in royalties were also determinant in predicting franchisor failure.
observe a relationship between franchise fee and franchise survival. However, the annual variation in the franchise fee was the most important variable, and the interaction between age and franchise fee was significant. The likelihood of survival was greater for young franchise chains that charged a low franchise fee than for young franchise chains that charged a high franchise fee, thereby supporting Hypothesis 7. Finally, franchise chains that based their performance on income from sales had a lower survival rate than franchise chains that based their survival on profitability and efficiency. Hence, Hypothesis 8 is rejected. This finding is reasonable because royalties are applied as a percentage of sales, and an increase in royalties means a lower likelihood of franchisor survival.
Tables4and5shows the accuracy of the model in predicting franchisor failure for the training and test (or validation) samples. The model correctly predicted 82.47% of franchisor survival in the training sample and 81.82% in the test sample. Using the area under the receiver operating characteristic (ROC) curve (AUC—area under curve) we estimated performance irrespective of the costs of misclassification and the sizes of each group (failed and non-failed franchises). ROC is a graphical plot that illustrates the diagnostic ability of a binary classifier system as its discrimination threshold is varied. The ROC curve is created by plotting the true positive rate (TPR) against the false positive rate (FPR) at various threshold settings. ROC values range from 0 to 1. A ROC of 0.5 indicates that the predictor can be considered a random predictor, whereas a ROC value of 1 means the prediction model is perfect. The ROC values in the training and test samples were 0.8203 and 0.8057, respectively, reflecting the model’s high predictive power.
Table 4.Training sample.
Observed/Predicted Non-Failed Failed Total Accuracy
Non-failed 114 25 139 82.01%
Failed 2 13 15 86.67%
Total 110 44 154 82.47%
Table 5.Test sample.
Observed/Predicted Non-Failed Failed Total Accuracy
Non-failed 49 11 60 81.67%
Failed 1 5 16 83.33%
Total 46 20 66 81.82%
5. Discussion and Conclusions
To help franchisors prevent the failure of their franchise chains and ensure their survival, we developed a model that predicts franchisor success or failure to ensure economic sustainability. As expected, experience in the franchise sector is important for survival. The early years after a franchisor launches the business model are crucial to the chain’s survival. Unlike in other types of organizations, franchise chains are more likely to survive if they have been operating for several years, with a greater likelihood of failure in the early years. There are two reasons for this finding. First, franchise business concepts are developed over time. These concepts are adapted to environmental changes according to the tacit knowledge that franchisees acquire through contact with consumers and transmit to the franchisor. Second, the experience that the franchisor acquires from years of franchisee selection reduces errors in the selection process. This conclusion is further supported by the finding that franchise governance or control mechanisms are important for the economic sustainability of the franchise.
which indicates that the franchise chains with the lowest failure rate and highest survival rate have more franchised outlets than company-owned outlets. Although operating revenues are generated by both franchised and company-owned outlets, employee-related costs (e.g., salaries) are principally generated by employees working in company-owned outlets.
Highly efficient franchisors with positive, balanced annual growth are more likely to remain solvent over time. The model predicts that a franchisor who wishes to survive must prioritize profitability and efficiency over sales. In addition, franchisors who seek economic sustainability should not charge high royalties on sales to ensure a certain level of profit, but should instead effectively manage profitability and efficiency.
As we have shown, franchisors who increase the up-front franchise fees over time are less likely to fail. The up-front franchise fees indicate market demand to participate in the franchisor’s business model. The most well-known and profitable franchisors usually have high up-front franchise fees. According to the theory of resource scarcity, therefore, franchisors do not consider the franchise fee a means of obtaining financial resources to survive. Instead, franchisors consider the franchise fee a signal of reputation, brand image, and knowledge, as posited by signaling theory.
In conclusion, formal governance mechanisms (i.e., contracts) are important for franchise survival. We thus respond to the questions posed in the introduction. In response to the first question, we conclude that economic sustainability in franchising depends not only on achieving positive financial performance, but also on stable, long-term relationships between the franchisor and franchisees. Sustainability of the franchise business model depends not only on economic sustainability, interpreted as financial success of franchised outlets, but also on meeting the franchisee’s needs through formal governance mechanisms to ensure stable, enduring franchisor-franchisee relationships and the economic sustainability of the chain. Therefore, franchisors should draw up contracts and periodically alter contractual clauses to guarantee the economic sustainability of their franchise chains. To survive, franchise chains must maintain a sustainable pace of franchised outlet openings, increase the franchise fee as they expand the range of services they offer franchisees, and manage their profitability and efficiency. Therefore, because of the advantages of the franchise business model, franchises have a higher survival rate than traditional businesses.
This conclusion has managerial implications for the franchisor. First, economic sustainability refers not only to positive financial performance, but also to the creation of stable, enduring relationships with franchisees based on the sustainable opening of franchised outlets and establishing franchise fees that reflect the chain’s brand image. The franchisor should not view the franchise format as a means of quickly obtaining funding by opening a large number of franchised outlets or charging high franchise fees in the short term. This type of behavior will harm the franchise by creating mistrust among franchisees, likewise harming the economy and job creation. Second, the franchisor should not establish royalties by focusing solely on sales. Instead, the franchisor should focus on improving the efficiency and profitability of franchised outlets by motivating franchisees.
Acknowledgments:University of Burgos collaborated to cover the costs to publish in open access.
Author Contributions:The study was designed by Esther Calderon-Monge, Ivan Pastor-Sanz and Pilar Huerta-Zavala. Esther Calderon-Monge provided the key ideas for the conceptual framework and hypotheses and wrote the paper. Ivan Pastor-Sanz designed the sample, built the model, and wrote up the results. All authors have read, discussed, and approved the final manuscript.
Conflicts of Interest:The authors declare no conflicts of interest.
Appendix A
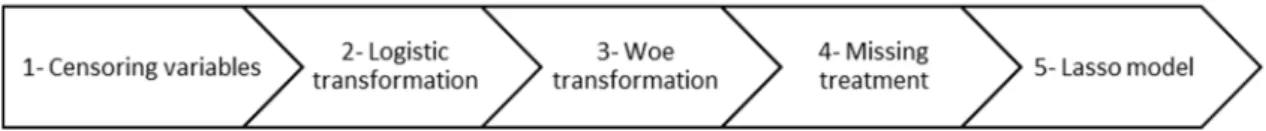
We performed some data transformations before applying the Lasso regression. FigureA1shows the steps we followed to build the model.Sustainability 2017, 9, 1419 12 of 16
Figure A1. Steps followed to build the model
First, we mitigated the effect of possible outliers. Failure to detect outliers can distort the validity of the inferences drawn from Lasso modeling [88].
We performed variable censoring at the 1st and 99th percentiles.
Second, the use of univariate transformations of the variables in a multivariate or Lasso logistic model improves the model’s discriminatory power. Such transformations improve the model’s discriminatory power by mitigating the effect of outliers on estimation and by capturing non-linear relationships between the log-odds and the variables. In this study, these transformations confirmed whether the sign of each failure-related variable was as expected. Individual independent variables were treated as if they constituted univariate classification models. These variables were thus included in the model having already been transformed. We opted to make a logistic transformation that adjusts the probability of failure. We estimated the β parameters (common to all observations) for the ith variable according to the following equation:
, , , A1
ln , , , A2
where (EDF)i is the estimated failure frequency, β0,i, β1,i are the parameters that are to be estimated for each variable and that are common to all observations, and Xi is the value for the ith variable.
Third, the estimated failure frequency (EDF)i for each variable was transformed using the weight of evidence (Woe). The Woe is a widely used measure of the strength of a grouping for separating good and bad risk (failures). The Woe for a franchisor was greater than or less than 0 depending on whether the EDF for the franchisor was lower or higher, respectively, than the EDF for the overall sample. If the EDF for a franchisor was equal to the EDF for the overall sample, the Woe was 0. The Woe was calculated as follows:
ln ln , A3
where (EDF)i was calculated for each franchisor and for each variable in the sample according to Equation (A4) and EDF is the percentage of failed franchise chains in the sample.
Finally, we addressed missing values. The most common approach consists of replacing missing values of variables with the median or mean. Another approach is to remove the observations with missing values. We followed a different approach because missing values might provide relevant information—for example, if missing values usually corresponded to failed franchisors. We calculated the failure rate in observations with missing values and then calculated the corresponding Woe. Missing values were thus assigned to a value depending on the implicit characteristics of observations with missing values. Finally, in a Lasso regression model, the size of regression coefficients is penalized using an L1 penalty as well:
| , ∑ | | , A4
when λ is sufficiently large, some of the coefficient estimates are forced to equal zero. This condition yields models that are more parsimonious. As Equation (A4) shows, the Lasso model requires a penalty parameter λ. A k-fold cross-validation procedure was applied.
Figure A1.Steps followed to build the model.
First, we mitigated the effect of possible outliers. Failure to detect outliers can distort the validity of the inferences drawn from Lasso modeling [88].
We performed variable censoring at the 1st and 99th percentiles.
Second, the use of univariate transformations of the variables in a multivariate or Lasso logistic model improves the model’s discriminatory power. Such transformations improve the model’s discriminatory power by mitigating the effect of outliers on estimation and by capturing non-linear relationships between the log-odds and the variables. In this study, these transformations confirmed whether the sign of each failure-related variable was as expected. Individual independent variables were treated as if they constituted univariate classification models. These variables were thus included in the model having already been transformed. We opted to make a logistic transformation that adjusts the probability of failure. We estimated theβparameters (common to all observations) for theith
variable according to the following equation:
where (EDF)iis the estimated failure frequency,β0,i,β1,iare the parameters that are to be estimated for each variable and that are common to all observations, andXiis the value for theith variable.
Third, the estimated failure frequency (EDF)ifor each variable was transformed using the weight of evidence (Woe). TheWoeis a widely used measure of the strength of a grouping for separating good and bad risk (failures). TheWoefor a franchisor was greater than or less than 0 depending on whether theEDFfor the franchisor was lower or higher, respectively, than theEDFfor the overall sample. If theEDFfor a franchisor was equal to theEDFfor the overall sample, theWoewas 0. TheWoewas calculated as follows:
where (EDF)iwas calculated for each franchisor and for each variable in the sample according to Equation (A4) andEDFis the percentage of failed franchise chains in the sample.
the failure rate in observations with missing values and then calculated the correspondingWoe. Missing values were thus assigned to a value depending on the implicit characteristics of observations with missing values. Finally, in a Lasso regression model, the size of regression coefficients is penalized using anL1 penalty as well:
argmaxβ(L(β|y,x)−λΣ
K
k=1|βk|), (A4)
whenλis sufficiently large, some of the coefficient estimates are forced to equal zero. This condition
yields models that are more parsimonious. As Equation (A4) shows, the Lasso model requires a penalty parameterλ. Ak-fold cross-validation procedure was applied.
References
1. Chouinard, Y.; Ellison, J.; Ridgeway, R. The sustainable economy.Harv. Bus. Rev.2011,89, 52–62.
2. 2016 Franchaise Economy. Available online:
http://www.franchise.org/new-economic-impact-study-shows-franchise-businesses-produce-significant-impact-on-us-economy(accessed on 27 July 17).
3. Bansal, P. Evolving sustainability: A longitudinal study of corporate sustainable development. Strateg. Manag. J.2005,26, 197–218. [CrossRef]
4. Sebastiania, R.; Corsaroa, D.; Montagninic, F.; Caruanab, A. Corporate sustainability in action.Serv. Ind. J. 2014,34, 584–603. [CrossRef]
5. Romero-Martínez, A.M.; Ortiz-de-Urbina-Criado, M.; Ribeiro Soriano, D. Evaluating European Union support for innovation in Spanish small and medium enterprises.Serv. Ind. J.2010,30, 671–683. [CrossRef] 6. Crittenden, V.L.; Crittenden, W.L.; Ferrell, L.K.; Ferrell, O.C.; Pinney, C.C. Market-oriented sustainability:
A conceptual framework and propositions.J. Acad. Mark. Sci.2011,39, 71–85. [CrossRef]
7. Frazer, L.; Winzar, H. Exits and expectations: Why disappointed franchisees leave. J. Bus. Res. 2005,58, 1534–1542. [CrossRef]
8. Shane, S.; Spell, C. What Successful Franchisors Have in Common. Available online:http://www.franchise.
co.nz/article/view/69(accessed on 17 May 2017).
9. Combs, J.G.; Michael, S.C.; Castrogiovanni, G.J. Franchising: A review and avenues toward greater theoretical diversity.J. Manag.2004,30, 907–931. [CrossRef]
10. Soriano, D.R. The new role of the corporate and functional strategies in the tourism sector: Spanish small and medium-sized hotels.Serv. Ind. J.2005,25, 601–613. [CrossRef]
11. Combs, J.G.; Ketchen, D.J., Jr.; Shook, C.L.; Short, J.C. Antecendents and consequences of franchising: Past accomplishements and future challenges.J. Manag.2011,37, 99–126.
12. Gladwin, T.N.; Kennelly, J.J.; Krause, T. Shifting paradigms for sustainable development: Implications for management theory and research.Acad. Manag. Rev.1995,20, 874–907. [CrossRef]
13. Soriano, D.R.Asesoramiento en Dirección de Empresas: La Consultoría; Ediciones Díaz de Santos: Madrid, Spain, 1998; pp. 105–106.
14. Closs, D.J.; Speier, C.; Meacham, N. Sustainability to support end-to-end value chains: The role of supply chain management.J. Acad. Mark. Sci.2011,39, 101–116. [CrossRef]
15. Williams, M.L. Measuring business starts, success and survival, some database considerations.J. Bus. Ventur. 1993,8, 295–299. [CrossRef]
16. Bates, T. Survival patterns among newcomers to franchising.J. Small Bus. Ventur.1998,13, 113–130. [CrossRef] 17. Hall, G.; Young, B. Factors associated with insolvency amongst small firms.Int. Small Bus. J.1991,9, 54–63.
[CrossRef]
18. Cochran, A.B. Small business mortality rates: A review of the literature.J. Small Bus. Manag.1989,19, 50–59. 19. Gaskill, L.R.; Van Auken, H.E. A factor analytic study of the perceived causes of small business failure.
J. Small Bus. Manag.1993,31, 18–31.
20. Gorovaia, N.; Windsperger, J. The use of KT mechanisms in franchising.Knowl. Process Manag.2010,14, 12–21. [CrossRef]
21. Minguela-Rata, B.; Lopez-Sanchez, J.; Rodriguez-Benavides, M. KT mechanisms and the performance of franchise systems: An empirical study.Afr. J. Bus. Manag.2010,44, 396–405.
23. Kosova, F.; Lafontaine, F. Survival growth in retail service industries: Evidence from franchised chains. J. Ind. Econ.2010,58, 542–578. [CrossRef]
24. Shane, S.A. Organizational incentives and organizational mortality.Organ. Sci.2001,12, 136–140. [CrossRef] 25. Kalnins, A. Overestimation and venture survival: An empirical analysis of development commitments in
international master franchising ventures.J. Econ. Manag.2005,14, 933–953. [CrossRef]
26. Azoulay, P.; Shane, S. Entrepreneurs, contracts, and the failure of young firms.Manag. Sci.2001,47, 337–358. [CrossRef]
27. Blut, M.; Backhaus, C.; Heussler, T.; Woisetschläger, D.M.; Evanschitzky, H.; Ahlert, D. What to expect after the honeymoon: Testing a lifecycle theory of franchise relationships.J. Retail.2001,87, 306–319. [CrossRef] 28. Combs, J.G.; Ketchen, D., Jr.; Hoover, V.L. A strategic groups approach to the franchising-performance
relationship.J. Bus. Ventur.2004,19, 877–897. [CrossRef]
29. Harmon, T.R.; Griffiths, M.A. Franchisee perceived relationship value.J. Bus. Ind. Mark.2008,23, 256–263. [CrossRef]
30. Frazer, L. Causes of disruption to franchise operations.J. Bus. Res.2001,54, 227–234. [CrossRef]
31. Spinelli, S.; Birley, S. An Empirical evaluation of conflict in the franchise system. Br. J. Manag. 1998,9, 301–326. [CrossRef]
32. López-Bayón, S.; López-Fernández, B. Partner empowerment and relationship failure in franchising.J. Small Bus. Manag.2016,54, 1059–1079. [CrossRef]
33. Shane, S.A. Making new franchise systems work.Strateg. Manag. J.1998,19, 697–707. [CrossRef]
34. Grunnhagen, M.; Dorsch, M.J. Does the franchisor provide value to franchisees? Past, current, and future value assessments of two franchisee types.J. Small Bus. Manag.2003,41, 366–384. [CrossRef]
35. De Castro, L.M.; Mota, J.; Marnoto, S. Toward a relational perspective of franchising chains.Serv. Bus.2009, 3, 15–30. [CrossRef]
36. Sánchez Gómez, R.; Suárez González, I.; Vazquez Suárez, L. Service quality control mechanisms in franchise networks.Serv. Ind. J.2011,31, 713–723. [CrossRef]
37. Vazquez, L. How passive ownership restrictions affect the rate of franchisee failure.Serv. Ind. J.2009,29, 847–859. [CrossRef]
38. Freeman, J.; Carroll, G.R.; Hannan, M.T. The liability of newness: Age dependence in organizational death rates.Am. Sociol. Rev.1983,48, 692–710. [CrossRef]
39. Barnett, W.P.; Carroll, G.R. Competition mutualism among early telephone companies.Adm. Sci. Q.1987,32, 400–421. [CrossRef]
40. Baum, J.A.C.; Mezias, S.J. Localized competition organizational failure in the Manhattan hotel industry. Adm. Sci. Q.1992,37, 590–604. [CrossRef]
41. Ribeiro Soriano, D. Modeling the enterprising character of European firms.Eur. Bus. Rev.2003,15, 29–37. [CrossRef]
42. Bruderl, J.; Preisendorfer, P.; Ziegler, R. Survival chances of newly founded business organizations. Am. Sociol. Rev.1992,57, 227–242. [CrossRef]
43. Hannan, M.T.; Freeman, J.H. The population ecology of organizations. Am. J. Sociol. 1977,83, 929–984. [CrossRef]
44. Bruderl, J.; Schissler, R. Organizational mortality: The liabilities of newness and adolescence.Adm. Sci. Q. 1990,35, 530–547. [CrossRef]
45. Hannan, M.T. Rethinking age dependence in organizational mortality: Logical formalizations.Am. J. Sociol. 1998,104, 126–164. [CrossRef]
46. Ranger-Moore, J. Bigger may be better, but is older wiser? Organizational age and size in the New York life insurance industry.Am. Sociol. Rev.1997,62, 903–920. [CrossRef]
47. Lafontaine, F.; Shaw, K.L. Franchising growth and franchisor entry and exit in the U.S. market: Myth and reality.J. Bus. Ventur.1998,13, 95–112. [CrossRef]
48. Windsperger, J.; Dant, R.P. Contractibility and ownership redirection in franchising: A property rights view. J. Retail.2006,82, 259–272. [CrossRef]
49. Rubin, P. The theory of the firm and the structure of the franchise contract.J. Law Econ.1978,21, 224–233. [CrossRef]
51. Dnes, A.W. Unfair contractual practices hostage in franchise contracts.J. Inst. Theor. Econ.1992,148, 484–504. 52. Bergen, M.; Dutta, S.; Walker, O.C., Jr. Agency relationships in marketing: A review of the implications
applications of agency related theories.J. Mark.1992,56, 1–24. [CrossRef]
53. Barne, J.B.; Ouchi, W.G.Organizational Economics; Jossey-Bass Publishers: San Francisco, CA, USA, 1986. 54. Eisenhardt, K.M. Agency theory: An assessment and review.Acad. Manag. Rev.1989,14, 57–74. [CrossRef] 55. Windsperger, J. The structure of ownership rights in franchising: An incomplete contracting view.Eur. J.
Law Econ.2002,13, 129–142. [CrossRef]
56. Dobbs, M.E.; Boggs, D.J.; Grünhagen, M.; Lucia-Palacios, L.; Flighet, R.L. Time will tell: Interaction effects of franchising percentages and age on franchisor mortality rates.Int. Entrep. Manag. J.2014,10, 607–621. [CrossRef]
57. Baucus, D.A.; Baucus, M.; Human, S.E. Choosing a franchise: How base fees and royalties relate to the value of a franchise.J. Small Bus. Manag.1993,31, 91–104.
58. Bordanaba-Juste, V.; Lucia-Palacios, L.; Polo-Redondo, Y. An analysis of franchisor failure risk: Evidence from Spain.J. Bus. Ind. Mark.2011,26, 407–420. [CrossRef]
59. Gallini, N.T.; Lutz, N.A. Dual distribution and royalty fees in franchising.J. Law Econ. Organ.1992,8, 471–501. 60. Michael, S.C. The elasticity of franchising.Small Bus. Econ.1999,12, 313–320. [CrossRef]
61. Dant, R.P.; Kacker, M.; Coughlan, A.T.; Emerson, J. A Cointegration Analysis of the Correlates of Performance in Franchised Channels. InEconomics and Management of Networks: Franchising, Strategic Alliances, and Cooperatives, 1st ed.; Cliquet, G., Tuunanen, M., Hendrikse, G., Windsperger, J., Eds.; Springer: New York, NY, USA, 2007; pp. 169–189.
62. Windsperger, J. The fee structure in franchising: A property rights view.Econ. Lett.2001, 73, 219–226. [CrossRef]
63. Julian, S.D.; Castrogiovanni, G.J. Franchisor geographic expansion.J. Small Bus. Manag.1995,33, 1–11. 64. Manolis, C.; Dahlstrom, R.; Nygaard, A. A preliminary investigation of ownership conversions in franchised
distribution systems.J. Appl. Bus. Res.1995,11, 1–8. [CrossRef]
65. Phan, P.H.; Butler, J.E.; Lee, S.H. Learning: Key to leveraging the value of a franchise.J. Enterp. Cult.1994,1, 367–382. [CrossRef]
66. Spinelli, S.; Birley, S. Toward a theory of conflict in the franchise system.J. Bus. Ventur.1996,11, 329–342. [CrossRef]
67. Fanning, K.; Cogger, K. A comparative analysis of artificial neural networks using financial distress prediction. Intell. Syst. Account. Financ. Manag.1994,3, 241–252. [CrossRef]
68. Min, J.; Lee, Y. Business failure prediction with support vector machines and neural networks: A comparative study. In Proceedings of the 9th Asia-Pacific Decision Sciences Institute Conference, Seoul, Korea, 1–4 July 2004.
69. Wu, C.; Tzeng, G.; Goo, Y.; Fang, W. A real-valued genetic algorithm to optimize the parameters of support vector machine for predicting bankruptcy.Expert Syst. Appl.2007,32, 397–408. [CrossRef]
70. Agrawal, D.; Lal, R. Contractual arrangements in franchising: An empirical investigation.J. Mark. Res.1995, 32, 213–221. [CrossRef]
71. Mukta, P.; Kumar, U.A. Neural networks and statistical techniques: A review of applications.Expert Syst. Appl. 2009,36, 2–17. [CrossRef]
72. Adusumilli, S.; Bhatt, D.; Wang, H.; Bhattacharya, P.; Devabhaktuni, V. A low-cost INS/GPS integration methodology based on random forest regression.Expert Syst. Appl.2013,40, 4653–4659. [CrossRef] 73. Booth, A.; Gerding, E.; McGroarty, F. Automated trading with performance weighted random forests and
seasonality.Expert Syst. Appl.2014,41, 3651–3661. [CrossRef]
74. Calderoni, L.; Ferrara, M.; Franco, A.; Maio, D. Indoor localization in a hospital environment using random forest classifiers.Expert Syst. Appl.2015,42, 125–134. [CrossRef]
75. Czarnecki, W.M.; Tabor, J. Two ellipsoid support vector machines.Expert Syst. Appl. 2014,41, 8211–8224. [CrossRef]
76. Horta, I.M.; Camanho, A.S. Company failure prediction in the construction industry.Expert Syst. Appl.2013, 40, 6253–6257. [CrossRef]
78. Sánchez-Lasheras, F.; de Andrés, J.; Lorca, P.; de Cos Juez, F.J. A hybrid device for the solution of sampling bias problems in the forecasting of firms’ bankruptcy.Expert Syst. Appl.2012,39, 7512–7523. [CrossRef] 79. Tsai, C.F.; Hsu, Y.F.; Yen, D.C. A comparative study of classifier ensembles for bankruptcy prediction.
Appl. Soft Comput.2014,24, 977–984. [CrossRef]
80. Hosmer, D.W.; Lemeshow, S. Applied logistic regression. InApplication of Logistic Regression with Different
Sampling Models, 2nd ed.; Hosmer, D.W., Lemeshow, S., Eds.; John Wiley and Sons: New York, NY, USA,
2000; pp. 203–222.
81. Hoerl, A.E.; Kennard, R.W. Ridge Regression: Applications to Non-Orthogonal Problems.Technometrics1970, 12, 69–82. [CrossRef]
82. Cessie, S.; van Houwelingen, J.C. Ridge estimators in logistic regression. Appl. Stat. 1992,41, 191–201. [CrossRef]
83. Tibshirani, R. Regression shrinkage and selection via the lasso. J. R. Stat. Soc. C Ser. B1996,58, 267–288. [CrossRef]
84. Park, T.; Casella, G. The Bayesian Lasso.J. Am. Stat. Assoc.2008,103, 681–686. [CrossRef]
85. Schaefer, R.L.; Roi, L.D.; Wolfe, R.A. A Ridge Logistic Estimator. Commun. Stat.-Theor. Methods1984,13, 99–113. [CrossRef]
86. Tian, S.; Yu, Y.; Guo, H. Variable selection and corporate bankruptcy forecasts. J. Bank. Financ. 2015,52, 89–100. [CrossRef]
87. Friedman, J.; Hastie, T.; Simon, N.; Tibshirani, R. glmnet: Lasso and Elastic-Net Regularized Generalized Linear Models, R Package Version 1.9-8. 2015. Available online:http://cran.r-project.org/web/packages/ glmnet/index.html(accessed on 7 April 17)).
88. Sarkar, S.K.; Midi, H.; Rana, S. Detection of outliers and influential observations in binary logistic regression: An empirical study.J. Appl. Sci.2011,11, 26–35. [CrossRef]