ScienceDirect
Available online at www.sciencedirect.com
Procedia Computer Science 159 (2019) 600–609
1877-0509 © 2019 The Authors. Published by Elsevier B.V.
This is an open access article under the CC BY-NC-ND license (https://creativecommons.org/licenses/by-nc-nd/4.0/) Peer-review under responsibility of KES International.
10.1016/j.procs.2019.09.215
10.1016/j.procs.2019.09.215 1877-0509
© 2019 The Authors. Published by Elsevier B.V.
This is an open access article under the CC BY-NC-ND license (https://creativecommons.org/licenses/by-nc-nd/4.0/) Peer-review under responsibility of KES International.
Available online at www.sciencedirect.com
Procedia Computer Science 00 (2019) 000–000
www.elsevier.com/locate/procedia
23rd International Conference on Knowledge-Based and Intelligent Information & Engineering
Systems
Retinal vascular analysis in a fully automated method for the
segmentation of DRT edemas using OCT images
Joaquim de Moura
a,b,∗, Jorge Novo
a,b, Pablo Charl´on
c, Mar´ıa Isabel Fern´andez
d,e,f, Marcos
Ortega
a,baFaculty of Informatics, Department of Computing, University of A Coru˜na, A Coru˜na, Spain
bCITIC-Research Center of Information and Communication Technologies, University of A Coru˜na, A Coru˜na, Spain cInstituto Oftalmol´ogico Victoria de Rojas, A Coru˜na, Spain
dInstituto Oftalmol´ogico G´omez-Ulla, Santiago de Compostela, Spain
eDepartment of Ophthalmology, Complejo Hospitalario Universitario de Santiago, Santiago de Compostela, Spain fUniversity of Santiago de Compostela, Santiago de Compostela, Spain
Abstract
Optical Coherence Tomography (OCT) is a well-established medical imaging technique that allows a complete analysis and eval-uation of the main retinal structures and their histopathology properties. Diabetic Macular Edema (DME) implies the accumulation of intraretinal fluid within the macular region. Diffuse Retinal Thickening (DRT) edemas are considered a relevant case of DME disease, where the pathological regions are characterized by a “sponge-like” appearance and a reduced intraretinal reflectivity, being visible in OCT images. Additionally, the presence of other structures may alter the OCT image characteristics, confusing the pathological identification process. This is the case of the retinal vessels over all the eye fundus, whose presence produce shadow projections over the retinal layers that may hide the “sponge-like” appearance of the DRT edemas.
Thus, in this paper, we present a proposal for the automatic extraction of DRT edemas, also using as reference the information provided by the automatic identifications of the retinal vessels in the OCT images. To do that, firstly, the system delimits three retinal regions of interest. These retinal regions facilitate the posterior identification of the vessel structures and the segmentation of the DRT regions. For the identification of the vessels structures, the method combined the localization of the upper bright vascular profiles with the presence of their corresponding lower dark vascular shadows. Finally, a learning strategy is implemented for the segmentation of the DRT edemas. Satisfactory results were obtained, reaching values of 0.8346 and 0.9051 of Jaccard index and Dice coefficient, respectively, for the extraction of the existing DRT edemas.
c
2019 The Author(s). Published by Elsevier B.V.
This is an open access article under the CC BY-NC-ND license (https://creativecommons.org/licenses/by-nc-nd/4.0/)
Peer-review under responsibility of KES International.
Keywords: Computer-aided diagnosis; optical coherence tomography; diabetic macular edema; retinal vascular structure
∗Corresponding author. Tel.:+34-881011330; fax:+34-981167160. E-mail address:joaquim.demoura@udc.es
1877-0509 c2019 The Author(s). Published by Elsevier B.V.
This is an open access article under the CC BY-NC-ND license (https://creativecommons.org/licenses/by-nc-nd/4.0/) Peer-review under responsibility of KES International.
J. de Moura et al./Procedia Computer Science 00 (2019) 000–000
1. Introduction
Nowadays, Computer-Aided Diagnosis (CAD) systems are widely used as auxiliary tools for the analysis and
mon-itoring of many different pathologies [2]. In this way, these computational systems have become a part of the clinical
practice routine, simplifying the diagnostic process and, therefore, facilitating the work of the clinical specialists [20].
In particular, Optical Coherence Tomography (OCT) is one of the most commonly used diagnostic imaging
tech-niques in the ophthalmological field [4]. This image modality offers an easy and direct visualization, in depth, of the
main retinal structures in real-time, which allows a complete analysis and evaluation of the retinal tissues and their
properties [14]. Therefore, it is extensively used in the clinical practice of ophthalmological services for the diagnosis,
treatment and monitoring of patients with different ocular disorders such as, for example, the Age-related Macular
Degeneration (AMD), glaucoma or Diabetic Macular Edema (DME).
Regarding DME, this relevant eye disorder represents one of the main causes of preventable blindness and vi-sual impairment in both developed and developing countries, according to the reported statistics of the World Health
Organization (WHO) guidelines [15]. Thus, DME is recognized as a global health problem, which has significative
consequences in terms of personal, economic and social well-being reasons of any affected individual. In this context,
using the OCT image modality as reference, Otaniet al.[13] proposed a reference clinical classification of the DME
disease. In particular, the authors established 3 types of DME: Serous Retinal Detachment (SRD), Cystoid Macular
Edema (CME) and Diffuse Retinal Thickening (DRT). This clinical classification is based on the different
morpholog-ical patterns that each DME type adopts within the retinal tissues. Regarding the DRT type, these edemas constitute the more complex case of identification given their fuzzy presence and unclear contour for what, consequently, they represent the less faced case in contrary to the other edema types. DRT edemas are usually derived from the leakage and accumulation of intraretinal fluids in the macular region, being directly related to early stages of the DME disease
[8]. In particular, they are characterized with an increased retinal thickness and the presence of regions of reduced
reflectivity. Moreover, this DME type presents a “sponge-like” appearance with an undefined shape that can be appre-ciated in the lower retinal tissues. For that reason, a fully automatic system for the identification and characterization of DRT edemas is significantly useful, improving the life quality of the patients and helping the clinicians to make a
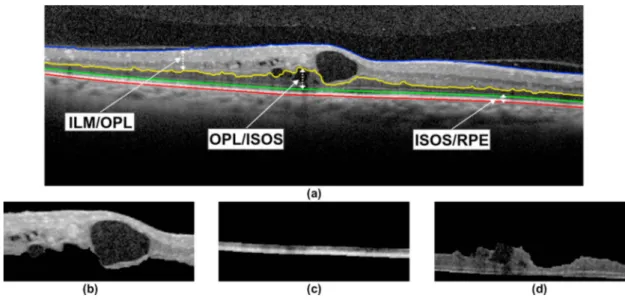
decision about the most accurate diagnosis and treatments, particularly in early stages of the DME disease. Figure1
illustrates representative examples of OCT images with and without the presence of DRT edemas, where we can ob-serve the considerable variability and lack of contrast with respect to the surrounding healthy tissues of these edemas, making the precise segmentation of this DME type a complex scenario.
Globally, given the relevance of the DME disease, many authors have faced its analysis over the recent years,
proposing different methodologies using the OCT images as source of information. As reference, Schleget al.[18]
proposed an automatic system based on deep learning to detect the CME regions in OCT scans. Following this strategy, Royet al.[16] presented an automatic method to segment the CME regions using fully convolutional networks. In the
work proposed by Vidalet al.[19], a complete methodology was designed to identify the CME regions by means of
generating regional binary maps and heat maps. Esmaeiliet al.[3] applied a curvelet transform based on the K-SVD
dictionary learning for the automatic segmentation of CME regions using OCT images. In the case of Mouraet al.
[11], the authors followed a machine learning strategy for the identification of the CME regions.
As we can observe from the literature, most of the presented methods only aimed at the analysis of CME regions and, therefore, addressed the pathological scenarios of DME that are typically more visible and structurally
well-defined. Contrary to the other types, DRT edemas were barely faced. Thus, only Samagaioet al. [17] proposed a
methodology for the automatic segmentation of this DME type using OCT scans. Like other proposals, misclassifi-cations are subsequently filtered to obtain more accurate results. However, the proposed method does not analyze the presence of other ocular structures, such as the retinal vessels, the most frequent and problematic structures of the eye fundus that produce many errors in the DRT extraction. Typically, in the captured OCT images, these relevant structures produce vessel shadows in the regions of the retina where the DRT edema usually appears and, therefore, they can directly influence the final results of the DRT segmentation process.
In this way, we present in this work a robust and complete methodology for the automatic segmentation of DRT edemas in OCT images, using as reference the information provided by the locations of the retinal vessels in order to avoid and correct possible introduced errors. To achieve this, firstly, 3 representative retinal regions are delimited:
simulta-Joaquim de Moura et al. / Procedia Computer Science 159 (2019) 600–609 601
Available online at www.sciencedirect.com
Procedia Computer Science 00 (2019) 000–000
www.elsevier.com/locate/procedia
23rd International Conference on Knowledge-Based and Intelligent Information & Engineering
Systems
Retinal vascular analysis in a fully automated method for the
segmentation of DRT edemas using OCT images
Joaquim de Moura
a,b,∗, Jorge Novo
a,b, Pablo Charl´on
c, Mar´ıa Isabel Fern´andez
d,e,f, Marcos
Ortega
a,baFaculty of Informatics, Department of Computing, University of A Coru˜na, A Coru˜na, Spain
bCITIC-Research Center of Information and Communication Technologies, University of A Coru˜na, A Coru˜na, Spain cInstituto Oftalmol´ogico Victoria de Rojas, A Coru˜na, Spain
dInstituto Oftalmol´ogico G´omez-Ulla, Santiago de Compostela, Spain
eDepartment of Ophthalmology, Complejo Hospitalario Universitario de Santiago, Santiago de Compostela, Spain fUniversity of Santiago de Compostela, Santiago de Compostela, Spain
Abstract
Optical Coherence Tomography (OCT) is a well-established medical imaging technique that allows a complete analysis and eval-uation of the main retinal structures and their histopathology properties. Diabetic Macular Edema (DME) implies the accumulation of intraretinal fluid within the macular region. Diffuse Retinal Thickening (DRT) edemas are considered a relevant case of DME disease, where the pathological regions are characterized by a “sponge-like” appearance and a reduced intraretinal reflectivity, being visible in OCT images. Additionally, the presence of other structures may alter the OCT image characteristics, confusing the pathological identification process. This is the case of the retinal vessels over all the eye fundus, whose presence produce shadow projections over the retinal layers that may hide the “sponge-like” appearance of the DRT edemas.
Thus, in this paper, we present a proposal for the automatic extraction of DRT edemas, also using as reference the information provided by the automatic identifications of the retinal vessels in the OCT images. To do that, firstly, the system delimits three retinal regions of interest. These retinal regions facilitate the posterior identification of the vessel structures and the segmentation of the DRT regions. For the identification of the vessels structures, the method combined the localization of the upper bright vascular profiles with the presence of their corresponding lower dark vascular shadows. Finally, a learning strategy is implemented for the segmentation of the DRT edemas. Satisfactory results were obtained, reaching values of 0.8346 and 0.9051 of Jaccard index and Dice coefficient, respectively, for the extraction of the existing DRT edemas.
c
2019 The Author(s). Published by Elsevier B.V.
This is an open access article under the CC BY-NC-ND license (https://creativecommons.org/licenses/by-nc-nd/4.0/)
Peer-review under responsibility of KES International.
Keywords: Computer-aided diagnosis; optical coherence tomography; diabetic macular edema; retinal vascular structure
∗ Corresponding author. Tel.:+34-881011330; fax:+34-981167160. E-mail address:joaquim.demoura@udc.es
1877-0509 c2019 The Author(s). Published by Elsevier B.V.
This is an open access article under the CC BY-NC-ND license (https://creativecommons.org/licenses/by-nc-nd/4.0/) Peer-review under responsibility of KES International.
J. de Moura et al./Procedia Computer Science 00 (2019) 000–000
1. Introduction
Nowadays, Computer-Aided Diagnosis (CAD) systems are widely used as auxiliary tools for the analysis and
mon-itoring of many different pathologies [2]. In this way, these computational systems have become a part of the clinical
practice routine, simplifying the diagnostic process and, therefore, facilitating the work of the clinical specialists [20].
In particular, Optical Coherence Tomography (OCT) is one of the most commonly used diagnostic imaging
tech-niques in the ophthalmological field [4]. This image modality offers an easy and direct visualization, in depth, of the
main retinal structures in real-time, which allows a complete analysis and evaluation of the retinal tissues and their
properties [14]. Therefore, it is extensively used in the clinical practice of ophthalmological services for the diagnosis,
treatment and monitoring of patients with different ocular disorders such as, for example, the Age-related Macular
Degeneration (AMD), glaucoma or Diabetic Macular Edema (DME).
Regarding DME, this relevant eye disorder represents one of the main causes of preventable blindness and vi-sual impairment in both developed and developing countries, according to the reported statistics of the World Health
Organization (WHO) guidelines [15]. Thus, DME is recognized as a global health problem, which has significative
consequences in terms of personal, economic and social well-being reasons of any affected individual. In this context,
using the OCT image modality as reference, Otaniet al.[13] proposed a reference clinical classification of the DME
disease. In particular, the authors established 3 types of DME: Serous Retinal Detachment (SRD), Cystoid Macular
Edema (CME) and Diffuse Retinal Thickening (DRT). This clinical classification is based on the different
morpholog-ical patterns that each DME type adopts within the retinal tissues. Regarding the DRT type, these edemas constitute the more complex case of identification given their fuzzy presence and unclear contour for what, consequently, they represent the less faced case in contrary to the other edema types. DRT edemas are usually derived from the leakage and accumulation of intraretinal fluids in the macular region, being directly related to early stages of the DME disease
[8]. In particular, they are characterized with an increased retinal thickness and the presence of regions of reduced
reflectivity. Moreover, this DME type presents a “sponge-like” appearance with an undefined shape that can be appre-ciated in the lower retinal tissues. For that reason, a fully automatic system for the identification and characterization of DRT edemas is significantly useful, improving the life quality of the patients and helping the clinicians to make a
decision about the most accurate diagnosis and treatments, particularly in early stages of the DME disease. Figure1
illustrates representative examples of OCT images with and without the presence of DRT edemas, where we can ob-serve the considerable variability and lack of contrast with respect to the surrounding healthy tissues of these edemas, making the precise segmentation of this DME type a complex scenario.
Globally, given the relevance of the DME disease, many authors have faced its analysis over the recent years,
proposing different methodologies using the OCT images as source of information. As reference, Schleget al.[18]
proposed an automatic system based on deep learning to detect the CME regions in OCT scans. Following this strategy, Royet al.[16] presented an automatic method to segment the CME regions using fully convolutional networks. In the
work proposed by Vidalet al.[19], a complete methodology was designed to identify the CME regions by means of
generating regional binary maps and heat maps. Esmaeiliet al.[3] applied a curvelet transform based on the K-SVD
dictionary learning for the automatic segmentation of CME regions using OCT images. In the case of Mouraet al.
[11], the authors followed a machine learning strategy for the identification of the CME regions.
As we can observe from the literature, most of the presented methods only aimed at the analysis of CME regions and, therefore, addressed the pathological scenarios of DME that are typically more visible and structurally
well-defined. Contrary to the other types, DRT edemas were barely faced. Thus, only Samagaioet al. [17] proposed a
methodology for the automatic segmentation of this DME type using OCT scans. Like other proposals, misclassifi-cations are subsequently filtered to obtain more accurate results. However, the proposed method does not analyze the presence of other ocular structures, such as the retinal vessels, the most frequent and problematic structures of the eye fundus that produce many errors in the DRT extraction. Typically, in the captured OCT images, these relevant structures produce vessel shadows in the regions of the retina where the DRT edema usually appears and, therefore, they can directly influence the final results of the DRT segmentation process.
In this way, we present in this work a robust and complete methodology for the automatic segmentation of DRT edemas in OCT images, using as reference the information provided by the locations of the retinal vessels in order to avoid and correct possible introduced errors. To achieve this, firstly, 3 representative retinal regions are delimited:
simulta-602 Joaquim de Moura et al. / Procedia Computer Science 159 (2019) 600–609 J. de Moura et al./Procedia Computer Science 00 (2019) 000–000
(a) (b) (c) (d)
(e) (f) (g) (h)
Fig. 1. Representative examples of regions from OCT images where the DRT edemas typically appear. 1strow, OCT images without the presence of DRT edemas. 2ndrow, OCT images with the presence of DRT edemas where the red regions represent the DRT annotations of a clinical expert.
neous localization of the vascular profiles within the top ILM/OPL region with the presence of their corresponding
vascular shadows within the bottom ISOS/RPE region. A learning strategy was implemented for the DRT
segmenta-tion, extracting a subset of relevant features within the OPL/ISOS region, where they typically appear. Finally, using
the vascular identifications, we implemented a post-processing stage to correct and refine the final segmented DRT regions.
This paper is organized as follows: Section2includes the detailed characteristics of the presented methodology.
Next, the results are presented and discussed in Section 3. Finally, Section 4 includes the conclusions and future
perspectives of this method.
2. Methodology
The proposed method receives, as input, a cross-sectional OCT image centered in the macular region of the retina. The designed pipeline of the proposed methodology is composed by 3 main stages. Firstly, the system extracts 3 retinal regions of clinical interest to delimit the search space of the retinal vasculature as well as the DRT edemas. Then, the main retinal vessels are localized using as reference the identification of the vascular profiles and their corresponding shadows. Finally, a learning strategy is implemented for the segmentation of the DRT edemas. As output, the system presents a labeled OCT image with the precise segmentation of this DME type.
2.1. Identification and Delimitation of the Regions of Interest
This stage consists of two main steps: the delimitation of 4 main retinal layers and the subsequent extraction of 3 retinal regions of interest to be analyzed. The identification of these relevant regions facilitates the posterior process of extraction of the retinal vessels as well as the segmentation of DRT edemas. A more detailed description of this process is described in the following subsections.
J. de Moura et al./Procedia Computer Science 00 (2019) 000–000
2.1.1. Retinal Layer Segmentation
In the human eye, the retina is a transparent and light-sensitive organ that is composed of different progressive
overlapping layers. In particular, in this work, 4 main retinal layers are segmented: the Inner Limiting Membrane (ILM), the Retinal Pigment Epithelium (RPE), the junction of the Inner and Outer Segments (ISOS) and the Outer Plexiform Layer (OPL). In particular, for the precise delimitation of the ILM, RPE and ISOS layers, we based our
approach on the work proposed by Gonz´alez-L´opez et al.[5], given its simplicity and efficiency. To do that, the
proposed algorithm uses an active contour-based model to segment and extract the boundaries of the 3 aimed retinal layers. Then, using anatomical knowledge, a refinement process is applied to correct possible mistakes and obtain a better adjustment.
With respect to the OPL layer, we implemented a different and specific strategy given the advanced state of
deteri-oration of the intraretinal tissues that present the OCT images that are used in this work, specially, in the pathological scenarios of the DME disease. To achieve this, the implemented algorithm takes the ISOS layer, which was previously
identified, as baseline for the application of a region growing approach [9]. To do that, firstly,N seed points were
randomly generated within this retinal region, whereNrepresents an amount of 10% of the width of the input OCT
image. Then, the surrounding pixels of the seed points are grouped according to their intensity values, generating a
final connected region. In particular, the upper limits of this region represents the aimed OPL layer. In Fig.2, we can
see an illustrative example of an OCT image where the ILM, OPL, ISOS and RPE layers were correctly segmented by our proposed method.
Fig. 2. Example of OCT image with the segmentation of the aimed 4 retinal layers: ILM, OPL, ISOS and RPE.
2.1.2. Division of the Retinal Regions of Interest: ILM/OPL, OPL/ISOS and ISOS/RPE
Using the previous layer extractions, 3 representative retinal regions of interest are delimited: ILM/OPL, OPL/ISOS
and ISOS/RPE regions, as represented in Fig.3(a). Based on different clinical knowledge, these regions were defined
to facilitate the posterior vascular and pathological identification and segmentation processes. In particular, the
vas-cular positions and profiles, with bright intensities, are localized in the ILM/OPL region (Fig.3(b)). In opposition,
the vascular shadows are more visible and defined in the ISOS/RPE region (Fig.3(c)), with dark intensities.
Regard-ing the DRT edemas, this particular DME case typically appears in the OPL/ISOS region (Fig.3(d)), presenting a
characteristic relative position in the innermost tissues of the retina.
2.2. Retinal Vessel Detection
Normally, OCT images provide detailed information of the main blood vessels that are present in the inner retinal
layers. In Fig.4, we can observe a representative example where the retinal vessel profiles are visualized as points of
bright intensity that block the transmission of light and provoke vascular shadow projections in the lower retinal tis-sues. In this context, we designed a specific strategy for the identification of the main retinal vessels by combining the
simultaneous identification of the bright vascular profiles at the top of the retinal layers (within the ILM/OPL region)
with the presence of their corresponding vascular shadows at the bottom of the retinal layers (within the ISOS/RPE
Joaquim de Moura et al. / Procedia Computer Science 159 (2019) 600–609 603
J. de Moura et al./Procedia Computer Science 00 (2019) 000–000
(a) (b) (c) (d)
(e) (f) (g) (h)
Fig. 1. Representative examples of regions from OCT images where the DRT edemas typically appear. 1strow, OCT images without the presence of DRT edemas. 2ndrow, OCT images with the presence of DRT edemas where the red regions represent the DRT annotations of a clinical expert.
neous localization of the vascular profiles within the top ILM/OPL region with the presence of their corresponding
vascular shadows within the bottom ISOS/RPE region. A learning strategy was implemented for the DRT
segmenta-tion, extracting a subset of relevant features within the OPL/ISOS region, where they typically appear. Finally, using
the vascular identifications, we implemented a post-processing stage to correct and refine the final segmented DRT regions.
This paper is organized as follows: Section2includes the detailed characteristics of the presented methodology.
Next, the results are presented and discussed in Section3. Finally, Section4 includes the conclusions and future
perspectives of this method.
2. Methodology
The proposed method receives, as input, a cross-sectional OCT image centered in the macular region of the retina. The designed pipeline of the proposed methodology is composed by 3 main stages. Firstly, the system extracts 3 retinal regions of clinical interest to delimit the search space of the retinal vasculature as well as the DRT edemas. Then, the main retinal vessels are localized using as reference the identification of the vascular profiles and their corresponding shadows. Finally, a learning strategy is implemented for the segmentation of the DRT edemas. As output, the system presents a labeled OCT image with the precise segmentation of this DME type.
2.1. Identification and Delimitation of the Regions of Interest
This stage consists of two main steps: the delimitation of 4 main retinal layers and the subsequent extraction of 3 retinal regions of interest to be analyzed. The identification of these relevant regions facilitates the posterior process of extraction of the retinal vessels as well as the segmentation of DRT edemas. A more detailed description of this process is described in the following subsections.
J. de Moura et al./Procedia Computer Science 00 (2019) 000–000
2.1.1. Retinal Layer Segmentation
In the human eye, the retina is a transparent and light-sensitive organ that is composed of different progressive
overlapping layers. In particular, in this work, 4 main retinal layers are segmented: the Inner Limiting Membrane (ILM), the Retinal Pigment Epithelium (RPE), the junction of the Inner and Outer Segments (ISOS) and the Outer Plexiform Layer (OPL). In particular, for the precise delimitation of the ILM, RPE and ISOS layers, we based our
approach on the work proposed by Gonz´alez-L´opezet al. [5], given its simplicity and efficiency. To do that, the
proposed algorithm uses an active contour-based model to segment and extract the boundaries of the 3 aimed retinal layers. Then, using anatomical knowledge, a refinement process is applied to correct possible mistakes and obtain a better adjustment.
With respect to the OPL layer, we implemented a different and specific strategy given the advanced state of
deteri-oration of the intraretinal tissues that present the OCT images that are used in this work, specially, in the pathological scenarios of the DME disease. To achieve this, the implemented algorithm takes the ISOS layer, which was previously
identified, as baseline for the application of a region growing approach [9]. To do that, firstly,N seed points were
randomly generated within this retinal region, whereNrepresents an amount of 10% of the width of the input OCT
image. Then, the surrounding pixels of the seed points are grouped according to their intensity values, generating a
final connected region. In particular, the upper limits of this region represents the aimed OPL layer. In Fig.2, we can
see an illustrative example of an OCT image where the ILM, OPL, ISOS and RPE layers were correctly segmented by our proposed method.
Fig. 2. Example of OCT image with the segmentation of the aimed 4 retinal layers: ILM, OPL, ISOS and RPE.
2.1.2. Division of the Retinal Regions of Interest: ILM/OPL, OPL/ISOS and ISOS/RPE
Using the previous layer extractions, 3 representative retinal regions of interest are delimited: ILM/OPL, OPL/ISOS
and ISOS/RPE regions, as represented in Fig.3(a). Based on different clinical knowledge, these regions were defined
to facilitate the posterior vascular and pathological identification and segmentation processes. In particular, the
vas-cular positions and profiles, with bright intensities, are localized in the ILM/OPL region (Fig.3(b)). In opposition,
the vascular shadows are more visible and defined in the ISOS/RPE region (Fig.3(c)), with dark intensities.
Regard-ing the DRT edemas, this particular DME case typically appears in the OPL/ISOS region (Fig.3(d)), presenting a
characteristic relative position in the innermost tissues of the retina.
2.2. Retinal Vessel Detection
Normally, OCT images provide detailed information of the main blood vessels that are present in the inner retinal
layers. In Fig.4, we can observe a representative example where the retinal vessel profiles are visualized as points of
bright intensity that block the transmission of light and provoke vascular shadow projections in the lower retinal tis-sues. In this context, we designed a specific strategy for the identification of the main retinal vessels by combining the
simultaneous identification of the bright vascular profiles at the top of the retinal layers (within the ILM/OPL region)
with the presence of their corresponding vascular shadows at the bottom of the retinal layers (within the ISOS/RPE
604 Joaquim de Moura et al. / Procedia Computer Science 159 (2019) 600–609 J. de Moura et al./Procedia Computer Science 00 (2019) 000–000
Fig. 3. Illustrative example of the identification of the regions of interest. (a) Delimitation of the 3 aimed retinal regions. (b) Delimitation of the ILM/OPL region. (c) Delimitation of the ISOS/RPE region. (d) Delimitation of the OPL/ISOS region.
Fig. 4. Representative example of OCT image, indicating the vascular profiles (red arrows) and their corresponding vascular shadow projections (yellow arrows) of a set of retinal vessels (white arrows).
profiles and another for the vascular shadows, where each signal represents the mean intensity in each column within the corresponding analyzed retinal region. The vascular profiles are localized by local maxima of the corresponding
signal, given their representative bright intensity profiles (Fig.5(a)). On the other hand, the vascular shadow regions
are identified by the presence of local minima given their representative lower intensity profiles (Fig.5(b)). To do that,
we analyze the prominence of the peaks and valleys of the signal as selection criteria [10]. Finally, in order to obtain a
final vessel identification, we combined the previous vascular localizations to produce the final identifications as those
that present both properties (Fig.5(c)). These vessel identifications are used in the subsequent segmentation process
to correct and refine the final DRT regions and improve the performance of the presented method.
J. de Moura et al./Procedia Computer Science 00 (2019) 000–000
Fig. 5. Example of OCT image with the detection of the main retinal vessels. (a) Signal representing the mean intensity of the bottom ILM/OPL region, where the vascular profiles are represented as peaks (blue points). (b) Signal representing the mean intensity of the top ISOS/RPE region, where the vascular shadows are represented as valleys (red points). (c) Final extraction of the retinal vessels, combining both criteria (green markers).
2.3. Segmentation of the DRT edemas
For the segmentation of the DRT edemas, a machine learning strategy was implemented, extracting a subset of
relevant features from the OPL/ISOS region where these edemas are typically located. Then, a representative classifier
is used to train and test the potential of the identified DRT regions, which will be described in more detail below.
2.3.1. Feature Extraction
In this step, a set of relevant features is used to characterize the presence of the DRT edemas using OCT images. Generally, given the characteristic ”sponge-like” appearance and relative position, among other pathological
proper-ties, of the DRT edemas, different intensity, texture and clinical-based characteristics are exploited. In particular, a
total of 307 features were extracted from the search space, includingGlobal Intensity-Based Features (GIBS),
Gray-Level Co-Occurrence Matrix (GLCM),Histogram of Oriented Gradients (HOG),Gabor filters,Local Binary Pattern
(LBP)andRetinal Thickness Analysis (RTA) features[17]. For the extraction of these features, the method uses a
window of variable height, which corresponds to the column height of the OPL/ISOS region and using a window
width of a predefined size. The analyzed set of features is summarized in Table1.
2.3.2. Feature Selection and Classification
The effectiveness of the machine learning algorithms strongly depends on the selection of the optimal subset of
features that maximize the discrimination or separation between the target classes. For this reason, we employed a specific strategy for the selection of the most representative subset of features given the large amount of features that
are studied in this work. In particular, the feature selection process was performed using three different approaches:
Joaquim de Moura et al. / Procedia Computer Science 159 (2019) 600–609 605
J. de Moura et al./Procedia Computer Science 00 (2019) 000–000
Fig. 3. Illustrative example of the identification of the regions of interest. (a) Delimitation of the 3 aimed retinal regions. (b) Delimitation of the ILM/OPL region. (c) Delimitation of the ISOS/RPE region. (d) Delimitation of the OPL/ISOS region.
Fig. 4. Representative example of OCT image, indicating the vascular profiles (red arrows) and their corresponding vascular shadow projections (yellow arrows) of a set of retinal vessels (white arrows).
profiles and another for the vascular shadows, where each signal represents the mean intensity in each column within the corresponding analyzed retinal region. The vascular profiles are localized by local maxima of the corresponding
signal, given their representative bright intensity profiles (Fig.5(a)). On the other hand, the vascular shadow regions
are identified by the presence of local minima given their representative lower intensity profiles (Fig.5(b)). To do that,
we analyze the prominence of the peaks and valleys of the signal as selection criteria [10]. Finally, in order to obtain a
final vessel identification, we combined the previous vascular localizations to produce the final identifications as those
that present both properties (Fig.5(c)). These vessel identifications are used in the subsequent segmentation process
to correct and refine the final DRT regions and improve the performance of the presented method.
J. de Moura et al./Procedia Computer Science 00 (2019) 000–000
Fig. 5. Example of OCT image with the detection of the main retinal vessels. (a) Signal representing the mean intensity of the bottom ILM/OPL region, where the vascular profiles are represented as peaks (blue points). (b) Signal representing the mean intensity of the top ISOS/RPE region, where the vascular shadows are represented as valleys (red points). (c) Final extraction of the retinal vessels, combining both criteria (green markers).
2.3. Segmentation of the DRT edemas
For the segmentation of the DRT edemas, a machine learning strategy was implemented, extracting a subset of
relevant features from the OPL/ISOS region where these edemas are typically located. Then, a representative classifier
is used to train and test the potential of the identified DRT regions, which will be described in more detail below.
2.3.1. Feature Extraction
In this step, a set of relevant features is used to characterize the presence of the DRT edemas using OCT images. Generally, given the characteristic ”sponge-like” appearance and relative position, among other pathological
proper-ties, of the DRT edemas, different intensity, texture and clinical-based characteristics are exploited. In particular, a
total of 307 features were extracted from the search space, includingGlobal Intensity-Based Features (GIBS),
Gray-Level Co-Occurrence Matrix (GLCM),Histogram of Oriented Gradients (HOG),Gabor filters,Local Binary Pattern
(LBP)andRetinal Thickness Analysis (RTA) features[17]. For the extraction of these features, the method uses a
window of variable height, which corresponds to the column height of the OPL/ISOS region and using a window
width of a predefined size. The analyzed set of features is summarized in Table1.
2.3.2. Feature Selection and Classification
The effectiveness of the machine learning algorithms strongly depends on the selection of the optimal subset of
features that maximize the discrimination or separation between the target classes. For this reason, we employed a specific strategy for the selection of the most representative subset of features given the large amount of features that
are studied in this work. In particular, the feature selection process was performed using three different approaches:
606 Joaquim de Moura et al. / Procedia Computer Science 159 (2019) 600–609 J. de Moura et al./Procedia Computer Science 00 (2019) 000–000
Table 1. A brief description of the defined set of 307 features that are used in this work.
Category Features
Global Intensity-Based Features (GIBS) [1-15] Maximum, minimum, mean, median, std, variance, 25thpercentile,
75thpercentile, skewness and maximum likelihood estimates for Normal distribution. Gray-Level Co-Occurrence Matrix (GLCM) [16-31] Contrast, energy, correlation and homogeneity.
Histogram of Oriented Gradients (HOG) [32-112] 9 windows per bound box and 9 histogram bins. Gabor filters [113-240] Mean and std. Orientations=8 and scale=8.
Local Binary Pattern (LBP) [241-304] Mean and std. Number of neighbors=(4, 8, 12, 16) and filter radius: 1-8. Retinal Thickness Analysis (RTA) [305-307] Thickness analysis: OPL/ISOS, ILM/RPE and the ratio between the
OPL/ISOS and ILM/ISOS regions.
[1]. Then, a Support Vector Machine (SVM) [6] classifier was trained to test the potential and suitability of the
implemented method in the segmentation of the DRT regions.
2.3.3. Post-Processing
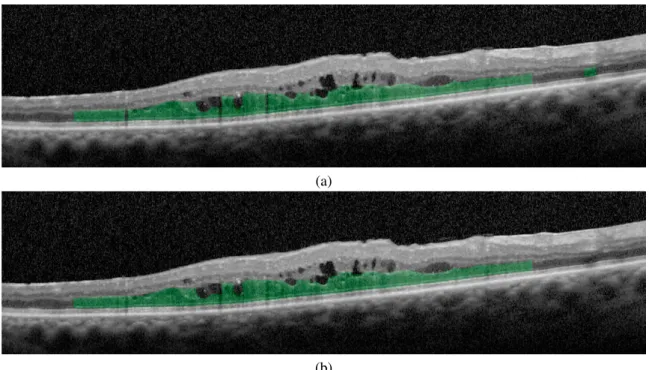
As said, the presence of blood vessels may significantly alter the results that would be obtained from the seg-mentation of DRT regions. In general, these vascular structures typically generate shadows (dark columns) in the lower layers of the retina, altering the intensity patterns of the main retinal tissues in the OCT images and, therefore, complicating the process of DRT identification. Given the complete and regional appearance of the DRT edemas, we implemented a post-processing stage to rectify the misclassifications and obtain a more precise and compact DRT regions. To do that, using the vessel identifications as reference, the method reduce the false positive rates by elimi-nating isolated DRT regions that fall under detected vascular regions. Moreover, false negative rates are also reduced given that detected DRT regions that are separated by gaps that were mainly extracted as vascular regions are directly
combined as a unified DRT region. Figure6shows two representative examples of OCT images with and without the
application of the post-processing stage in the DRT segmentation process.
3. Results and Discussion
The proposed methodology was validated using a dataset composed by 70 OCT histological images. These images
were obtained with a SpectralisR OCT capture device from Heidelberg Engineering. The image acquisition protocol
was done by selecting the 7 Line Rater scan configuration with a 30◦ ×5◦ of angle of capture and with a space of
240µm. These images are centered on the macular region, from different patients and taken from both left and right
eyes. To ensure the confidentiality of the individuals that participated in this study, the corresponding OCT images were anonymized by the clinical specialists before being provided for the validation of the proposed system.
The image dataset was labeled by an expert clinician, identifying the main retinal vessels as well as the DRT re-gions that appear in the OCT images. Three representative experiments were designed to measure the performance of the proposed system, being tested the results with both the vessels and the DRT regions. In order to test its suitabil-ity, the methodology was validated using statistical metrics that are commonly used in the literature to measure the performance of similar proposals.
Regarding the retinal vessel identification, we evaluated the performance of the proposed system using three rep-resentative metrics: Precision, Recall and F-Score. A total of 402 main retinal vessels were identified by an expert in the entire image dataset, representing our vascular ground-truth. In general terms, the system provided satisfactory results, with a Precision of 84.95%, a Recall of 95.52% as well as a F-Score of 0.8992, demonstrating its suitability in the complex process of the automatic identification of main the retinal vessels in OCT images that were taken from patients with DME.
Regarding the DRT identification, as said, we employed a machine learning strategy to evaluate the potential of the proposed system in the detection and extraction of these pathological fluid regions. To do that, we created a dataset consisting of 280 samples containing DRT and other 280 non-DRT edemas. This dataset was randomly split
J. de Moura et al./Procedia Computer Science 00 (2019) 000–000
(a)
(b)
Fig. 6. Example of application of the DRT segmentation stage. (a) DRT segmentation before the application of the post-processing stage. (b) DRT segmentation after the application of the post-processing stage.
into two equally sized subsets: a set for training the model and a test set for the performance assessment. A 10-fold cross-validation with 50 repetitions was performed to avoid a possible overfitting during the training process. Table
2summarizes the performance of the SVM classifier using the test set and the optimal subset of features that were
chosen by each feature selector. As we can see, the best results were obtained using the subset of features indicated by the SFS feature selector. In particular, a total of 75 features were selected, achieving an accuracy of 85.69%, illustrating the robustness and overall performance of the proposed method.
Table 2. Accuracy results with the test set for the DRT identification using the SVM classifier combined with different feature selectors.
Feature Selector SFS RFS SVM-FS
N. Features 75 142 53
Accuracy 0.85697 0.84094 0.84097
Regarding the DRT segmentation process, we analyzed the presence of this DME type using as reference the best configuration that was achieved for the DRT identification (SVM classifier and SFS feature selector) and the thickness
of the OPL/ISOS region, where this DME type usually appears. For validation purposes, the Jaccard index and the
Dice coefficient were used to measure the similarity between the extracted and the manually labeled DRT regions.
Moreover, we also evaluated the performance of the proposed system using the post-processing strategy that combines the analysis of the segmented DRT regions with the vascular identifications. The results that were obtained without
the post-processing stage were satisfactory, reaching a Jaccard index of 0.6835 and a Dice coefficient of 0.8044.
Additionally, the best results were achieved with the post-processing vascular stage, returning values of 0.8346 and
0.9051 for the Jaccard index and the Dice coefficient, respectively. This way, the post-processing stage using the
vascular regions to correct missclassifications offers a significant improvement in the segmentation process of the
DRT edemas.
Joaquim de Moura et al. / Procedia Computer Science 159 (2019) 600–609 607
J. de Moura et al./Procedia Computer Science 00 (2019) 000–000
Table 1. A brief description of the defined set of 307 features that are used in this work.
Category Features
Global Intensity-Based Features (GIBS) [1-15] Maximum, minimum, mean, median, std, variance, 25thpercentile,
75thpercentile, skewness and maximum likelihood estimates for Normal distribution. Gray-Level Co-Occurrence Matrix (GLCM) [16-31] Contrast, energy, correlation and homogeneity.
Histogram of Oriented Gradients (HOG) [32-112] 9 windows per bound box and 9 histogram bins. Gabor filters [113-240] Mean and std. Orientations=8 and scale=8.
Local Binary Pattern (LBP) [241-304] Mean and std. Number of neighbors=(4, 8, 12, 16) and filter radius: 1-8. Retinal Thickness Analysis (RTA) [305-307] Thickness analysis: OPL/ISOS, ILM/RPE and the ratio between the
OPL/ISOS and ILM/ISOS regions.
[1]. Then, a Support Vector Machine (SVM) [6] classifier was trained to test the potential and suitability of the
implemented method in the segmentation of the DRT regions.
2.3.3. Post-Processing
As said, the presence of blood vessels may significantly alter the results that would be obtained from the seg-mentation of DRT regions. In general, these vascular structures typically generate shadows (dark columns) in the lower layers of the retina, altering the intensity patterns of the main retinal tissues in the OCT images and, therefore, complicating the process of DRT identification. Given the complete and regional appearance of the DRT edemas, we implemented a post-processing stage to rectify the misclassifications and obtain a more precise and compact DRT regions. To do that, using the vessel identifications as reference, the method reduce the false positive rates by elimi-nating isolated DRT regions that fall under detected vascular regions. Moreover, false negative rates are also reduced given that detected DRT regions that are separated by gaps that were mainly extracted as vascular regions are directly
combined as a unified DRT region. Figure6shows two representative examples of OCT images with and without the
application of the post-processing stage in the DRT segmentation process.
3. Results and Discussion
The proposed methodology was validated using a dataset composed by 70 OCT histological images. These images
were obtained with a SpectralisR OCT capture device from Heidelberg Engineering. The image acquisition protocol
was done by selecting the 7 Line Rater scan configuration with a 30◦×5◦ of angle of capture and with a space of
240µm. These images are centered on the macular region, from different patients and taken from both left and right
eyes. To ensure the confidentiality of the individuals that participated in this study, the corresponding OCT images were anonymized by the clinical specialists before being provided for the validation of the proposed system.
The image dataset was labeled by an expert clinician, identifying the main retinal vessels as well as the DRT re-gions that appear in the OCT images. Three representative experiments were designed to measure the performance of the proposed system, being tested the results with both the vessels and the DRT regions. In order to test its suitabil-ity, the methodology was validated using statistical metrics that are commonly used in the literature to measure the performance of similar proposals.
Regarding the retinal vessel identification, we evaluated the performance of the proposed system using three rep-resentative metrics: Precision, Recall and F-Score. A total of 402 main retinal vessels were identified by an expert in the entire image dataset, representing our vascular ground-truth. In general terms, the system provided satisfactory results, with a Precision of 84.95%, a Recall of 95.52% as well as a F-Score of 0.8992, demonstrating its suitability in the complex process of the automatic identification of main the retinal vessels in OCT images that were taken from patients with DME.
Regarding the DRT identification, as said, we employed a machine learning strategy to evaluate the potential of the proposed system in the detection and extraction of these pathological fluid regions. To do that, we created a dataset consisting of 280 samples containing DRT and other 280 non-DRT edemas. This dataset was randomly split
J. de Moura et al./Procedia Computer Science 00 (2019) 000–000
(a)
(b)
Fig. 6. Example of application of the DRT segmentation stage. (a) DRT segmentation before the application of the post-processing stage. (b) DRT segmentation after the application of the post-processing stage.
into two equally sized subsets: a set for training the model and a test set for the performance assessment. A 10-fold cross-validation with 50 repetitions was performed to avoid a possible overfitting during the training process. Table
2summarizes the performance of the SVM classifier using the test set and the optimal subset of features that were
chosen by each feature selector. As we can see, the best results were obtained using the subset of features indicated by the SFS feature selector. In particular, a total of 75 features were selected, achieving an accuracy of 85.69%, illustrating the robustness and overall performance of the proposed method.
Table 2. Accuracy results with the test set for the DRT identification using the SVM classifier combined with different feature selectors.
Feature Selector SFS RFS SVM-FS
N. Features 75 142 53
Accuracy 0.85697 0.84094 0.84097
Regarding the DRT segmentation process, we analyzed the presence of this DME type using as reference the best configuration that was achieved for the DRT identification (SVM classifier and SFS feature selector) and the thickness
of the OPL/ISOS region, where this DME type usually appears. For validation purposes, the Jaccard index and the
Dice coefficient were used to measure the similarity between the extracted and the manually labeled DRT regions.
Moreover, we also evaluated the performance of the proposed system using the post-processing strategy that combines the analysis of the segmented DRT regions with the vascular identifications. The results that were obtained without
the post-processing stage were satisfactory, reaching a Jaccard index of 0.6835 and a Dice coefficient of 0.8044.
Additionally, the best results were achieved with the post-processing vascular stage, returning values of 0.8346 and
0.9051 for the Jaccard index and the Dice coefficient, respectively. This way, the post-processing stage using the
vascular regions to correct missclassifications offers a significant improvement in the segmentation process of the
DRT edemas.
608 Joaquim de Moura et al. / Procedia Computer Science 159 (2019) 600–609 J. de Moura et al./Procedia Computer Science 00 (2019) 000–000
analysis of these pathological regions and, consequently, the production of more adjusted treatments of this relevant ocular disease.
4. Conclusions
In this paper, we present a method for the retinal vessel extraction that facilitates the precise segmentation of the DRT edemas using OCT images. This fully automatic system provides relevant information about the most complex type of DME that is also associated with early stages of the evolution of the disease. Thus, the method facilitates the work of the clinical specialists in the analysis, diagnostic and monitoring of this eye disease. To do that, firstly, 4 main retinal layers are extracted: ILM, RPE, OPL and ISOS layers. Then, 3 representative retinal regions are delimited:
ILM/OPL, OPL/ISOS and ISOS/RPE regions. These retinal regions were defined to facilitate the identification of the
main vascular structures as well as the segmentation of the DRT regions. In particular, for the identification of the
vascular structures, the method combines the simultaneous localization of the vascular profiles in the top ILM/OPL
region with the presence of their corresponding vascular shadows in the bottom ISOS/RPE region. On the other hand,
a machine learning strategy is used for the precise segmentation of the DRT edemas in the inner OPL/ISOS region.
Finally, using the vascular extracted regions, we implemented a post-processing stage that corrects and refines the final segmented DRT regions. Satisfactory results were obtained from the designed experiments, reaching values of 0.8346
and 0.9051 for the Jaccard index and the Dice coefficient, respectively, after the application of the vascular
post-processing stage. As future work, we plan to extend this methodology to detect the presence of pathological structures that can also generate vascular shadows in the OCT images, such as hard exudates, drusen or microaneurysms, also altering the edema extraction process.
Acknowledgements
This work is supported by the Instituto de Salud Carlos III, Government of Spain and FEDER funds of the European
Union through the DTS18/00136 research projects and by the Ministerio de Econom´ıa y Competitividad, Government
of Spain through the DPI2015-69948-R research project. Also, this work has received financial support from the European Union (European Regional Development Fund - ERDF) and the Xunta de Galicia, Centro singular de
investigaci´on de Galicia accreditation 2016-2019, Ref. ED431G/01; and Grupos de Referencia Competitiva, Ref.
ED431C 2016-047.
References
[1] Bi, J., Bennett, K., Embrechts, M., Breneman, C., Song, M., 2003. Dimensionality reduction via sparse support vector machines. Journal of Machine Learning Research 3, 1229–1243.
[2] Doi, K., 2007. Computer-aided diagnosis in medical imaging: historical review, current status and future potential. Computerized medical imaging and graphics 31, 198–211.
[3] Esmaeili, M., Dehnavi, A.M., Rabbani, H., Hajizadeh, F., 2016. Three-dimensional segmentation of retinal cysts from spectral-domain optical coherence tomography images by the use of three-dimensional curvelet based K-SVD. Journal of medical signals and sensors 6, 166. [4] Fujimoto, J.G., Pitris, C., Boppart, S.A., Brezinski, M.E., 2000. Optical coherence tomography: an emerging technology for biomedical
imaging and optical biopsy. Neoplasia 2, 9–25.
[5] Gonz´alez-L´opez, A., de Moura, J., Novo, J., Ortega, M., Penedo, M., 2019. Robust segmentation of retinal layers in optical coherence tomography images based on a multistage active contour model. Heliyon 5, 1–34.
[6] Gunn, S.R., et al., 1998. Support vector machines for classification and regression. ISIS technical report 14, 5–16.
[7] Jain, A., Zongker, D., 1997. Feature selection: Evaluation, application, and small sample performance. IEEE transactions on pattern analysis and machine intelligence 19, 153–158.
[8] Li, X.Q., Meng, X.X., Wang, F.L., Fu, Y.D., 2017. Conbercept in treating Diabetic Macular Edema based on Optical Coherence Tomography patterns. Biomedical Research 28, 9423–9428.
[9] Mehnert, A., Jackway, P., 1997. An improved seeded region growing algorithm. Pattern Recognition Letters 18, 1065–1071.
[10] de Moura, J., Novo, J., Rouco, J., Penedo, M.G., Ortega, M., 2017a. Automatic detection of blood vessels in retinal OCT images, in: Interna-tional Work-Conference on the Interplay Between Natural and Artificial Computation, Springer. pp. 3–10.
Joaquim de Moura et al. / Procedia Computer Science 159 (2019) 600–609 609
J. de Moura et al./Procedia Computer Science 00 (2019) 000–000
analysis of these pathological regions and, consequently, the production of more adjusted treatments of this relevant ocular disease.
4. Conclusions
In this paper, we present a method for the retinal vessel extraction that facilitates the precise segmentation of the DRT edemas using OCT images. This fully automatic system provides relevant information about the most complex type of DME that is also associated with early stages of the evolution of the disease. Thus, the method facilitates the work of the clinical specialists in the analysis, diagnostic and monitoring of this eye disease. To do that, firstly, 4 main retinal layers are extracted: ILM, RPE, OPL and ISOS layers. Then, 3 representative retinal regions are delimited:
ILM/OPL, OPL/ISOS and ISOS/RPE regions. These retinal regions were defined to facilitate the identification of the
main vascular structures as well as the segmentation of the DRT regions. In particular, for the identification of the
vascular structures, the method combines the simultaneous localization of the vascular profiles in the top ILM/OPL
region with the presence of their corresponding vascular shadows in the bottom ISOS/RPE region. On the other hand,
a machine learning strategy is used for the precise segmentation of the DRT edemas in the inner OPL/ISOS region.
Finally, using the vascular extracted regions, we implemented a post-processing stage that corrects and refines the final segmented DRT regions. Satisfactory results were obtained from the designed experiments, reaching values of 0.8346
and 0.9051 for the Jaccard index and the Dice coefficient, respectively, after the application of the vascular
post-processing stage. As future work, we plan to extend this methodology to detect the presence of pathological structures that can also generate vascular shadows in the OCT images, such as hard exudates, drusen or microaneurysms, also altering the edema extraction process.
Acknowledgements
This work is supported by the Instituto de Salud Carlos III, Government of Spain and FEDER funds of the European
Union through the DTS18/00136 research projects and by the Ministerio de Econom´ıa y Competitividad, Government
of Spain through the DPI2015-69948-R research project. Also, this work has received financial support from the European Union (European Regional Development Fund - ERDF) and the Xunta de Galicia, Centro singular de
investigaci´on de Galicia accreditation 2016-2019, Ref. ED431G/01; and Grupos de Referencia Competitiva, Ref.
ED431C 2016-047.
References
[1] Bi, J., Bennett, K., Embrechts, M., Breneman, C., Song, M., 2003. Dimensionality reduction via sparse support vector machines. Journal of Machine Learning Research 3, 1229–1243.
[2] Doi, K., 2007. Computer-aided diagnosis in medical imaging: historical review, current status and future potential. Computerized medical imaging and graphics 31, 198–211.
[3] Esmaeili, M., Dehnavi, A.M., Rabbani, H., Hajizadeh, F., 2016. Three-dimensional segmentation of retinal cysts from spectral-domain optical coherence tomography images by the use of three-dimensional curvelet based K-SVD. Journal of medical signals and sensors 6, 166. [4] Fujimoto, J.G., Pitris, C., Boppart, S.A., Brezinski, M.E., 2000. Optical coherence tomography: an emerging technology for biomedical
imaging and optical biopsy. Neoplasia 2, 9–25.
[5] Gonz´alez-L´opez, A., de Moura, J., Novo, J., Ortega, M., Penedo, M., 2019. Robust segmentation of retinal layers in optical coherence tomography images based on a multistage active contour model. Heliyon 5, 1–34.
[6] Gunn, S.R., et al., 1998. Support vector machines for classification and regression. ISIS technical report 14, 5–16.
[7] Jain, A., Zongker, D., 1997. Feature selection: Evaluation, application, and small sample performance. IEEE transactions on pattern analysis and machine intelligence 19, 153–158.
[8] Li, X.Q., Meng, X.X., Wang, F.L., Fu, Y.D., 2017. Conbercept in treating Diabetic Macular Edema based on Optical Coherence Tomography patterns. Biomedical Research 28, 9423–9428.
[9] Mehnert, A., Jackway, P., 1997. An improved seeded region growing algorithm. Pattern Recognition Letters 18, 1065–1071.
[10] de Moura, J., Novo, J., Rouco, J., Penedo, M.G., Ortega, M., 2017a. Automatic detection of blood vessels in retinal OCT images, in: Interna-tional Work-Conference on the Interplay Between Natural and Artificial Computation, Springer. pp. 3–10.
[11] de Moura, J., Novo, J., Rouco, J., Penedo, M.G., Ortega, M., 2017b. Automatic identification of intraretinal cystoid regions in optical coherence tomography, in: Conference on Artificial Intelligence in Medicine in Europe, Springer. pp. 305–315.
J. de Moura et al./Procedia Computer Science 00 (2019) 000–000
[12] Nie, F., Huang, H., Cai, X., Ding, C.H., 2010. Efficient and robust feature selection via joint 2, 1-norms minimization, in: Advances in neural information processing systems, pp. 1813–1821.
[13] Otani, T., Kishi, S., Maruyama, Y., 1999. Patterns of diabetic macular edema with optical coherence tomography. American journal of ophthalmology 127, 688–693.
[14] Puliafito, C.A., Hee, M.R., Lin, C.P., Reichel, E., Schuman, J.S., Duker, J.S., Izatt, J.A., Swanson, E.A., Fujimoto, J.G., 1995. Imaging of macular diseases with optical coherence tomography. Ophthalmology 102, 217–229.
[15] Romero-Aroca, P., 2011. Managing diabetic macular edema: the leading cause of diabetes blindness. World journal of diabetes 2, 98. [16] Roy, A.G., Conjeti, S., Karri, S.P.K., Sheet, D., Katouzian, A., Wachinger, C., Navab, N., 2017. ReLayNet: retinal layer and fluid segmentation
of macular optical coherence tomography using fully convolutional networks. Biomedical optics express 8, 3627–3642.
[17] Samagaio, G., de Moura, J., Novo, J., Ortega, M., 2018. Automatic segmentation of diffuse retinal thickening edemas using Optical Coherence Tomography images. Procedia Computer Science 126, 472–481.
[18] Schlegl, T., Waldstein, S.M., Bogunovic, H., Endstraßer, F., Sadeghipour, A., Philip, A.M., Podkowinski, D., Gerendas, B.S., Langs, G., Schmidt-Erfurth, U., 2018. Fully automated detection and quantification of macular fluid in OCT using deep learning. Ophthalmology 125, 549–558.
[19] Vidal, P.L., de Moura, J., Novo, J., Penedo, M.G., Ortega, M., 2018. Intraretinal fluid identification via enhanced maps using optical coherence tomography images. Biomedical Optics Express 9, 4730–4754.