Who is where? Matching People in Video to Wearable
Acceleration During Crowded Mingling Events
Laura Cabrera-Quiros
1,2, Hayley Hung
1 1Delft University of Technology, Netherlands 2Instituto Tecnológico de Costa Rica, Costa Rica{l.c.cabreraquiros, h.hung}@tudelft.nl
ABSTRACT
We address the challenging problem of associating acceler-ation data from a wearable sensor with the corresponding spatio-temporal region of a person in video during crowded mingling scenarios. This is an important first step for multi-sensor behavior analysis using these two modalities. Clearly, as the numbers of people in a scene increases, there is also a need to robustly and automatically associate a region of the video with each person’s device. We propose a hierarchi-cal association approach which exploits the spatial context of the scene, outperforming the state-of-the-art approaches significantly. Moreover, we present experiments on match-ing from 3 to more than 130 acceleration and video streams which, to our knowledge, is significantly larger than prior works where only up to 5 device streams are associated.
Keywords
Mingling, wearable sensor, computer vision, association
1.
INTRODUCTION
Mingling scenarios involve a dense concentration of people who come together to socialize. Examples of these events are parties, drinks receptions or networking events, and have the potential to hold rich information about how people could potentially influence each other. These kinds of events have received increasing interest from the multimedia, computer vision, and ubiquitous computing communities [6, 13, 5, 8, 1]. However, as the number of people participanting in-creases they become increasingly challenging to interpret with computer vision alone, due to the difficulties of an-alyzing the human form under appearance changes, shape deformations and body occlusions.
The use of other modalities, in addition to video, has proven to be a suitable alternative [2, 11]. Thus, each ad-ditional modalitiy acts as a complementary source of infor-mation in combination with video. For instance, Alameda-Pineda et al. [1] showed improvements in the detection and analysis of free-standing conversational groups by
leverag-Permission to make digital or hard copies of all or part of this work for personal or classroom use is granted without fee provided that copies are not made or distributed for profit or commercial advantage and that copies bear this notice and the full citation on the first page. Copyrights for components of this work owned by others than the author(s) must be honored. Abstracting with credit is permitted. To copy otherwise, or republish, to post on servers or to redistribute to lists, requires prior specific permission and/or a fee. Request permissions from [email protected].
MM ’16, October 15 - 19, 2016, Amsterdam, Netherlands
c
2016 Copyright held by the owner/author(s). Publication rights licensed to ACM. ISBN 978-1-4503-3603-1/16/10. . . $15.00
DOI:http://dx.doi.org/10.1145/2964284.2967224
Similarity
Matrix Assigment
n Video Acceleration
Streams
m device Acceleration
Streams
Feature Extraction
m Device Acelerations
Video n Video
Tracks Matrix
D
Group Detection
device proximity
matching process
n Video Tracks
Figure 1: Overview of our approach
ing, along with video, speaking status and proximity using wearable audio and infrared (IR).
Although using wearable sensors as complementary source of information has many advantages, manually associating a specific device to a particular region of the video (where a person is wearing the device) quickly becomes unfeasible as the number of people to be associated increases. So, an auto-matic association is needed. However, with a higher number of samples to associate per modality the correct associations become harder to discriminate in a short time. Also, min-gling events are challenging scenarios where people’s social behavior, unlike simple actions like walking, does not tend to have a predictable and easily distinguishable pattern.
In this paper, we associate a time series signal from a wear-able accelerometer to a video acceleration stream extracted from a region of video containing the person wearing the wearable device. We chose accelerometers as they are the simplest and most widespread sensors capturing movement. The main contributions of this paper are: (i) we address large-scale data association in challenging crowded environ-ments, (ii) we propose a novel method based on an exten-sion of the Hungarian algorithm to automatically associate wearable devices via their acceleration reading to its wearer in video (spatio-temporal region) and (iii) we leverage the use of proximity information from the wearable devices and video as a spatial prior to the association process. Using the proximity, we can subdivide the association problem to areas in the real world sharing the same spatial-social context.
The closest works to our own are [15, 10, 9, 12]. Shigeta et al. [10] detected an object which contains an accelerometer out of many moving objects recorded by a single camera, using Normalized Cross-Correlations. Rofouei et al. [9] and Wilson and Benko [15] proposed similar methods to match the accelerometers and gyroscope of a smartphone to the pixels in a 3D video recorded with a Kinect. These ap-proaches can only handle one device at a time and are con-ceived for scenarios where the person (or object) wearing the device is clearly moving in the video.
camera network using a Hidden Markov Models. Although they proposed a solution for more than one device, their ex-periments have one single person walking under the network of cameras, from which they later ‘generate’ more partici-pants. They do not address the challenges from a crowded scene making their solution infeasible for mingling groups.
Compared to these works, our approach proposes a con-siderable increase in the number of accelerometers to be as-sociated. To the best of our knowledge, we are the first to consider the association of video with multiple wearable de-vices in such crowded scenarios and with more than 5 device streams. In addition, we propose to solve the association problem in a much more challenging context where people’s behavior can not be as easily characterized (e.g. walking).
2.
OUR APPROACH
Our approach is summarized in Fig. 1 and detailed below.
2.1
Feature extraction
For a wearable device, a single acceleration stream is ob-tained using the magnitude of the 3 axes. Each axis is first normalized using its mean and variance over the entire time. To associate each device stream with a region containing a person all the regions of interest (or bounding boxes), which include a person, are first extracted. Then, we concatenate the bounding boxes over time for each person, which results in the track (area over time) for that person. The Vatic tool [14] for video annotation was used to extract the bounding boxes. Using the SPOT tracker [16] gave us similar results but since this work only focuses on the already challenging problem of associating large numbers of streams and not in tracking we chose a manual labeling tool.
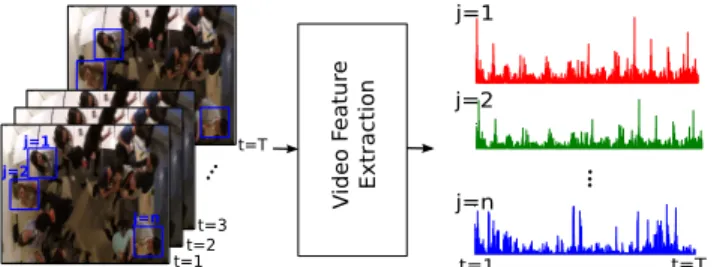
Next, for each track, an acceleration stream is calculated as follows. First, we extract dense optical flow for the video. Then, for each frame, we take the magnitude of all the flow vectors inside the box and compute the mean for those with a magnitude greater than zero. Thus, we obtain a vector of mean flow magnitudes for a given track over the entire video of length T samples, which represents the speed of movement for that person.This captures the influence of fine grained movements, originating from subtle social behavior such as gestures or laughter, as well as movement of the en-tire body. Fig. 2 illustrates the input and output of this step for 3 tracks (subjects). Finally, we compute the acceleration vector from the speed using finite difference approximation. After we extract the acceleration streams from the video and wearable devices, we proceed to treat each stream as fol-lows. First, we normalize the maximum value of all streams to one, so a comparison between video and wearable accel-eration can be made. Next, we apply a sliding window cal-culating the variance over each stream. Using this instead of the raw acceleration gave us a better representation of changes in movement activity of each person.
2.2
Similarity measurements
Both video and acceleration streams are noisy because they capture only partially the behavior of a person. There-fore, we need measurements to assess how similar 2 streams are and not if they are equal. Different widely used [4] met-rics are compared to quantify the affinity between the ac-celeration streams from video and the devices: covariance (COV), Dynamic Time Warping Distance (DTW) and Mu-tual Information (MI).
Figure 2: Feature extraction from video for 3 ex-ample tracks (subjects). Output: speed stream for each participant for interval of lengthT
2.3
Assignment methods
We consider the matching process to be an assignment problem wheremelements of a set M (device streams) need to be associated withnelements of a set N (video streams), by fulfilling a given function or constraint. A distances ma-trix D (size m×n) is formed by the pairwise distances between all possible combinations of macceleration and n video streams, where
Dij=d(i, j), i∈ {1· · ·m}andj∈ {1· · ·n} (1)
anddis one of the similarity metrics from Section 2.2.
Winner-takes-all (greedy) association
State-of-the-art methods ([10, 9, 15]) use a greedy approach where the element in D that has the highest value deter-mines the assignment. The corresponding column and row are removed fromDand the assignment process is repeated, if applicable. This will be our baseline.
Hungarian method
Although the winner-takes-all method is a reasonable base-line, it does not consider that there is likely to be noise in both sensor streams. Hence, it may not be able to distin-guish one possible assignment from the other. This is par-ticularly problematic as the number of streams increases. Trying to optimize the assignments globally may help.
The Hungarian method [3] computes a solution for the assignment problem by optimally matching the elementsm andn, based on a global optimization ofD. For this assign-ment problem, given the matrix of distancesD, the aim is to find the global costcthat minimizes
c= min fulfill 3 constraints: (i) no more than one weight equals to 1 per column soW1n≤1m, (ii) no more than one weight
equals to 1 per row so1T
mW≤1Tn and (iii) the total
num-ber of weights sums to one such that1TmW1n=min(m, n).
Thus, the elements of setsM andNcan only be paired once and the method chooses the set of pairs with the lowest total pairing cost. Several solutions exist to solve this problem [3].
Hierarchical Hungarian method
devices
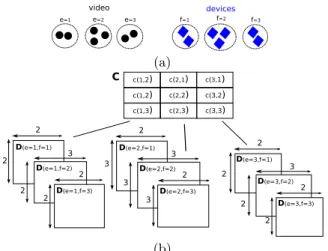
Figure 3: Example of assignment method. (a)
Devices and Video streams representations. The dotted circles show the group detection. (b) Our proposedHierarchical Hungarian method using the streams and clusters from (a).
As a solution, we hypothesize that subdividing the prob-lem based on the local spatial neighborhood in each sensor modality can improve the numbers of correctly associated streams, which exploits the spatial and social context of the gathering. Thus, we propose an extension to the Hungar-ian method by performing the assignment in a hierarchical manner, using a divide-and-conquer strategy. All streams are subdivided into groups in each modality, reducing the initial assignment problem from a global to local optimiza-tion, defined by the number of groups in each modality.
So, the n video and m accelerometer streams are clus-tered intopgroups for the acceleration andqgroups for the video streams, as seen in Fig. 3(a). Then, p×q different distance matrices are generated; one for each group combi-nation (e, f) where indicese ∈ {1· · ·p} and f ∈ {1· · ·q}. For each of these matrices, the corresponding stream as-signment is calculated. Within each group-to-group match-ing, the possible stream combinations are now reduced to n0e×m0f, wheren
0
e and m0f are the number of elements in
theethandfthdevice and video groupings, respectively. Each group-to-group assignment cost c(e, f) is then ob-tained by Eq.2 and placed in a new matrixC(see Fig. 3(b)), which represents the costs of assigning the elements within each possible group combinationeandf. Each costc(e, f) must be normalized by dividing by the number of assign-ments made so Cef = c(e, f)/min(m0f, n
0
e). For example,
when comparing a group of 3 streams against a group of 2, only 2 costs from the 3×2 matrix are used for the fi-nal assignment. Fifi-nally, the Hungarian algorithm is applied to matrixCto find the optimal group-to-group assignment. The stream assignment for that specific group-to-group pair-ing is then chosen. Our Hierarchical Hungarian assignment procedure is illustrated in Fig. 3.
2.4
Clustering Devices and Video Streams
We propose to generate the groups by clustering based on their proximity over a particular time interval. The group detection must be performed independently per sensor type. Each of the devices outputs a dynamic binary proximity graph (see Section 3), which is later refined to eliminate false neighbor detections using the method proposed by Martella
et al. [7]. To do so, they apply a density-based clustering to group all the neighbor detections in time (see [7] for more details). Finally, maximal cliques are identified from the proximity graph to obtain psets of fully connected nodes. We choose maximal cliques as this clustering method has proven to be an accurate approximation for conversational groups [6].
To cluster the video streams, we use the tracks extracted for each of the participants. For each frame of the video, an affinity matrixAis created, which defines a symmetric
distance between person i and j Aij = −e
dij
2σ2 where d ij
is the Euclidean distance in the image plane between the centroids of the bounding boxes for personiandjandσis the width of the Gaussian kernel. In our experiments,σwas set to 150 pixels, as this was an approximate value for group distance given the image size and resolution of the camera. Then, we apply the group detection algorithm that extracts clusters as maximal cliques in edge-weighted graphs [6].
This is an iterative procedure that optimizes the group clustering based on the notion of a dominant set. If we have a graph G with each node representing the centroid of a person’s bounding box and the affinity between people to be the edges, we can consider a representation of the closeness of a subsetS of the graph as follows. We define a measure called the average weighted degree of a vertex i∈ S with respect to setSaskS(i) = |S1|Pj∈Saij. The relative affinity
between nodej /∈Sandiis defined asφS(i, j) =aij−kS(i),
and the weight of each iwith respect to a setS=R∪ {i}
is defined recursively as
wS(i) =
wS(i) measures the overall relative affinity between i and
the rest of the vertices inS, weighted by the overall affinity of the vertices in R. Therefore to find the cliques in the graphwS(i)>0,∀i∈S.For every graph, only one maximal
clique can be identified at a time and a peeling strategy is employed where the same conditions are repeatedly applied to the remaining sub-graph until no more cliques remain. Finally, the cliques identified per frame are combined into a single set of groupings using majority voting.
3.
DATA
We collected video and wearable acceleration for 30 par-ticipants during a group gathering. This data was collected in a real mingling scenario after a speed dating event, where people were encouraged to mingle. Each person wore a wear-able device hung around the neck which recorded triaxial ac-celeration at 20 Hz. These devices also have a binary prox-imity detector based on beacon communication with other devices. Thus, each device emits its own ID to all other devices around it allowing the devices to synchronize every second and detect each other from 2-3 meters away. The detection of a device is considered as a proximity detection (binary signal). Finally, overhead video was captured using 5 different GoPro Hero 3+ cameras that covered the whole mingling area with some overlap.
(a) (b) (c)
Figure 4: Accuracy of the stream association for our proposed method (Hierarchical), the state-of-the-art (Hungarian and Greedy) and a random baseline (Random) using (a) COV, (b) DTW and (c) MI.
Table 1: Association accuracy of the Hungarian and Hierarchical Hungarian method using 100s intervals using the COV
NoPartic. 19 38 76
Hungarian 47.37 36.84 29.83 Hierarchical 73.68 76.32 39.47
these restrictions, we have video and acceleration streams for 19 subjects, for about 6 minutes.
4.
EXPERIMENTS AND RESULTS
4.1
Generating virtual streams
Although significantly higher than those in previous works, our number of subjects is still rather low. To go further, we used virtual streams, similarly to Teixeira et al. [12], by splitting the total time interval of the streams into smaller intervals and treating each one as if they were occurring at the same time. Unlike [12], our data contains densely crowded mingling behavior so the dense crowding property holds across the virtual participants. From our 19 original streams, we created subsets with 38, 57, 76, 95, 114 and 133 virtual subjects, increasing significantly the number of streams we could associate. This leads inevitably to a re-duction in the length of the streams, which is a trade-off that we also study in the following section.
4.2
Results
Fig. 4 shows the assignment accuracy against the number of participants for the 3 assignment methods in Section 2.3 and the metrics in Section 2.2. To stress test the number of streams to associate, we generate up to 133 virtual par-ticipants. Note that by repeatedly splitting the interval by a factor from 1 to 7 we have a time interval of 360s for 19 participants (original data), 180s for 38, and up to 51s for 133 participants for these figures.
Comparison between assignment methods
As seen in Fig.4, both Hungarian approaches performed sig-nificantly better than the random baseline when using the COV and the DTW metrics. Furthermore, our Hierarchical approach tends to have a higher accuracy than the other 2 methods when using the COV for less than 80 participants. These results, although promising, are obtained using in-creasingly shorter intervals of the virtual streams. Due to this, Table 1 shows the accuracy for the two Hungarian-based methods using the same length of 100s for all streams and the COV as metric. For this test, given the data avail-able, we can only split our data into 3 sets of virtual streams. Here, our Hierarchical Hungarian method still outperforms the Hungarian method, so the interval length is not neces-sarily the reason for the higher accuracies.
Table 2: Upper bound case: assignment accuracy using the Hierarchical Hungarian assignment where the correct group-to-group matching is known.*
NoPartic. 19 38 57 76 95 114 133
A
cc(%
) COV 100 94.7 89.5 82.9 81.1 86.0 79.7
DTW 100 89.5 80.7 82.9 75.8 82.5 75.2 MI 84.2 76.3 56.1 64.5 67.4 66.7 66.9 *Group-to-group matching is manually annotated
Although outperforming the other methods, the accuracy for our Hierarchical Hungarian method decreases with a higher number of participants. We hypothesize that as the number of groups increases but the observation time remains low, the method will now have problems to discriminate be-tween the groups instead of streams. Table 2 summarizes the assignment accuracy for all the metrics and different virtual streams using an ideal group-to-group matching, where the groups are matched manually based on the ground truth, in-stead of the matches chosen automatically by our method.
These results represent the upper bound for our Hierar-chical method and suggests that the errors in Fig. 4(a) are introduced by the group-to-group matching, implying that a minimum time is needed to discriminate between groups.
Comparison between metrics
The performance for the Hierarchical Hungarian method is better overall than the Hungarian method when using for the COV but not so for the DTW distance. This implies that, unlike the COV, the costs chosen as globally optimal for assignments using the DTW are very similar between each other, making the matrixCnoisy and difficult to discrimi-nate for the Hierarchical Hungarian method. A particularly interesting result is the low accuracy achieved when using the MI as the similarity metric. However, previous works have shown that when 2 people interact, their MI tend to increase [4]. Thus, due to this and our rather short intervals, this metric it might not be adequate in our case.
5.
CONCLUSION
6.
REFERENCES
[1] X. Alameda-Pineda, Y. Yan, E. Ricci, O. Lanz, and N. Sebe. Analizing free-standing convers. groups:a multimodal approach.ACMMM, 2015.
[2] G. Bahle, P. Lukowicz, K. Kunze, and K. Kise. I see you: How to improve wearable activity recognition by leveraging information from environmental cameras.PerCom, 2013. [3] B. Burkard, M. D.’Amico, and S. Martello.Assignment
problems. 2009.
[4] E. Delaherche, M. Chetouani, A. Mahdhaoui,
C. Saint-Georges, S. Viaux, and D. Cohen. Interpersonal Synchrony: A Survey of Evaluation Methods across Disciplines.Trans. on Affective Computing, 2012. [5] T. Gan, Y. Wong, D. Zhang, and M. Kankanhalli.
Temporal encoded F-formation system for social interac. detection. InACMMM, 2013.
[6] H. Hung and B. Krose. Detecting F-formations as dominant sets.ICMI, 2011.
[7] C. Martella, M. Dobson, A. van Halteren, and M. Van Steen. From proximity sensing to spatial-temporal social graphs.PerCom, 2014.
[8] C. Martella, E. Gedik, L. Cabrera-Quiros, G. Englebienne, and H. Hung. How Was It? Exploiting Smartphone Sensing to Measure Implicit Audience Responses to Live
Performances. InACMMM, 2015.
[9] M. Rofouei, A. Wilson, A. Brush, and S. Tansley. Your Phone or Mine? Fusing Body, Touch and Device Sensing for Multi-User Device-Display Interaction. InCHI, 2012. [10] O. Shigeta, S. Kagami, and K. Hashimoto. Identifying a
moving object with an accelerometer in a camera view. In
IROS, 2008.
[11] S. Stein and S. Mckenna. Comb. embedded accelerometers with computer vision for recogn. food preparation activities.UbiComp, 2013.
[12] T. Teixeira, D. Jung, and A. Savvides. Tasking networked CCTV cameras and mobile phones to identify and localise multiple persons.UbiComp, 2010.
[13] S. Vascon, E. Mequanint, M. Cristani, H. Hung, M. Pelillo, and V. Murino. A Game-Theoretic Probabilistic Approach for Detecting Conversational Groups . InACCV, 2014. [14] C. Vondrick, D. Patterson, and D. Ramanan. Efficiently
Scaling Up Crowdsourced Video Annotation.IJCV, 2012. [15] A. Wilson and H. Benko. CrossMotion:fusing device and
image motion for user identif., tracking and device association. InICMI, 2014.